Austin Economic Indicators

March 16, 2022
Growth in the Austin economy moderated in January. The Austin Business-Cycle Index expanded at a slower pace, with a fall in the unemployment rate offset somewhat by a slight decline in payroll jobs. COVID-19 hospitalizations plummeted as the omicron wave abated, and cases fell to a three-month low. January home sales picked up in the metro as the median home price continued to rise. This has affected home affordability, which slipped in fourth quarter 2021 to its lowest reading since 2000.
Business-cycle index
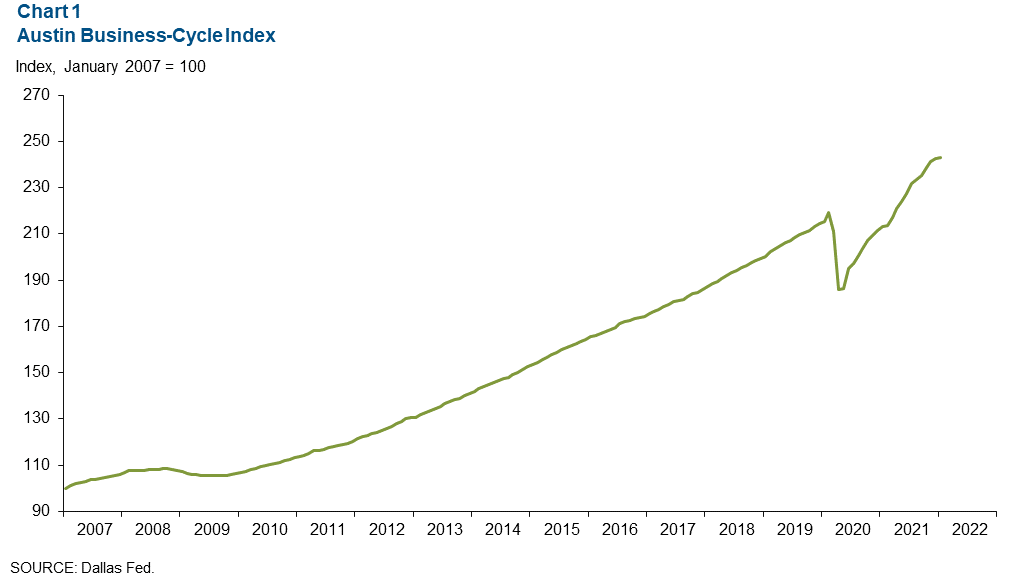
The Austin Business-Cycle Index—a broad measure of economic activity—rose an annualized 2.5 percent in January after growing a robust 6.8 percent in December (Chart 1).
Labor market
Unemployment rate ticks down
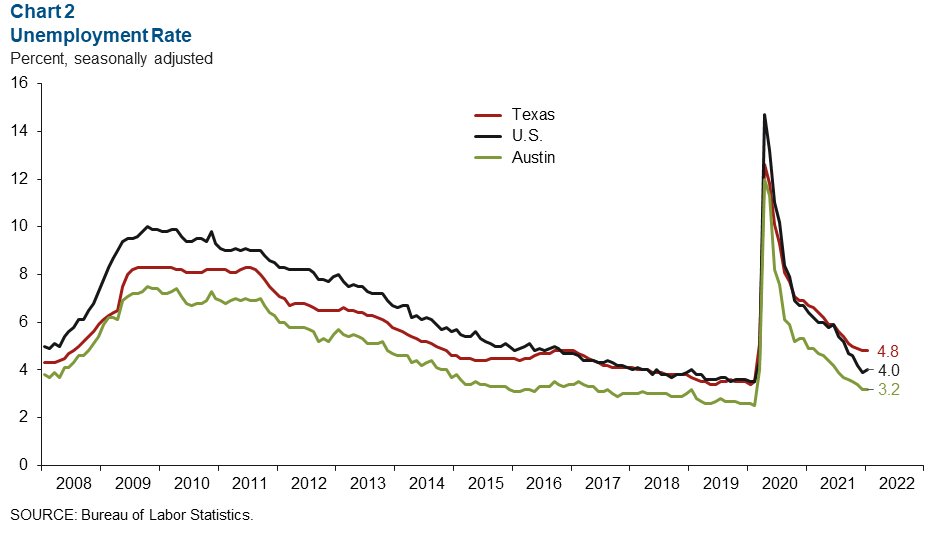
Austin’s unemployment rate dropped to 3.2 percent in January, the lowest level since February 2020 (Chart 2). This is well below the state’s jobless rate of 4.8 percent and the nation’s rate of 4.0 percent. Growth in the metro labor force slowed from an annualized 2.7 percent in December to 0.4 percent in January. This compares with the state’s 4.0 percent and nation’s 10.4 percent labor force growth.
Payroll gains positive across most sectors
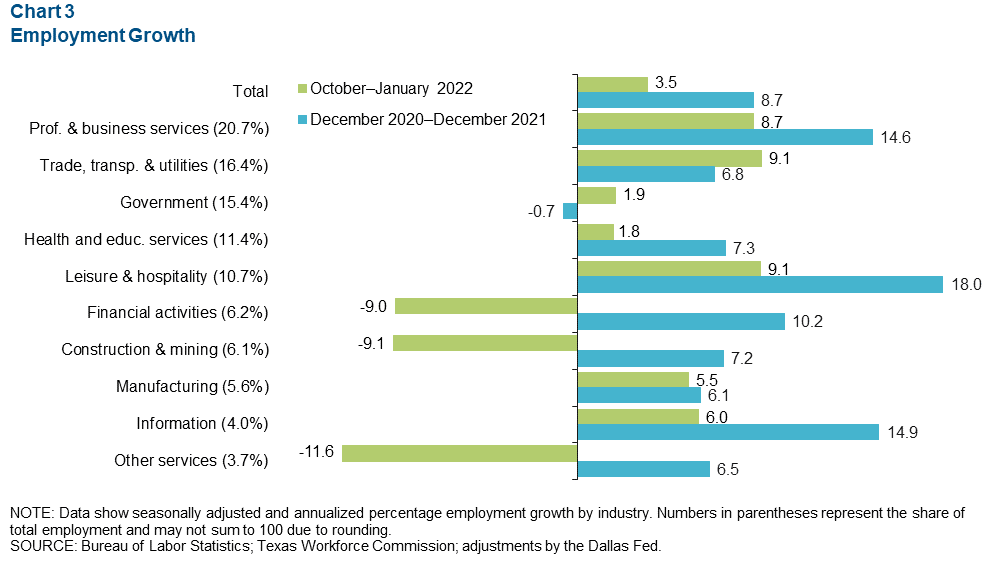
Austin employment increased at a 3.5 percent annualized pace, or by 21,000 net jobs, in the three months ending in January (Chart 3). Leisure and hospitality (up 9.1 percent, or 2,769 jobs) and trade, transportation and utilities (up 9.1 percent, or 4,623 jobs) led overall growth, followed closely by professional and business services (up 8.7 percent, or 5,180 jobs). Sectors that saw a net decline in employment were other services (down 11.6 percent, or 1,392 jobs), construction and mining (down 9.1 percent, or 1,761 jobs) and financial activities (down 9.0 percent, or 1,773 jobs). As of January 2022, Austin payrolls are 5.5 percent above prepandemic (February 2020) levels. Employment rose 8.7 percent year-over-year in December 2021.
COVID-19 statistics
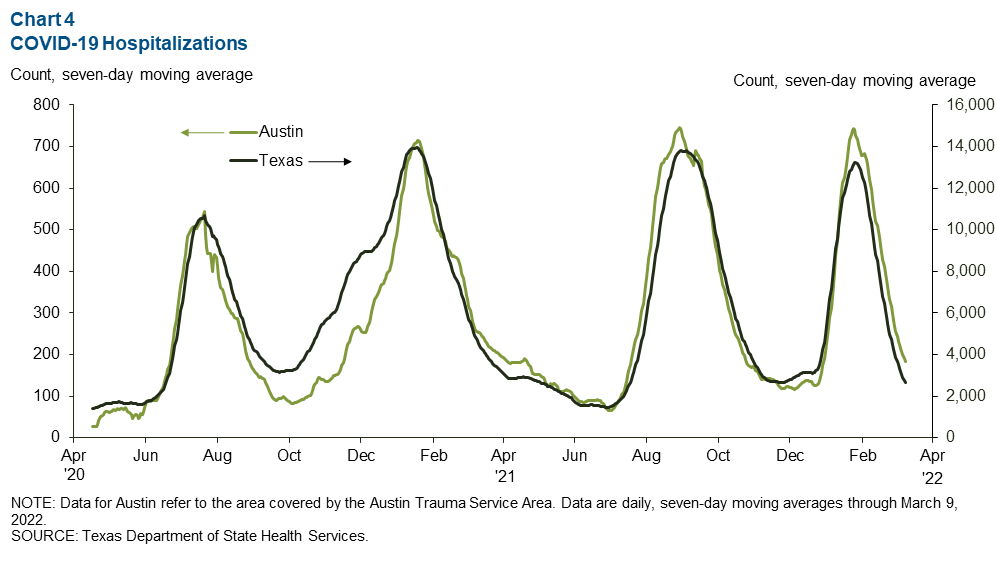
The number of people hospitalized with COVID-19 in Austin and Texas plummeted from peak levels in January (Chart 4). COVID-19 cases recently reached their lowest levels in Austin since late December, while statewide cases were at their lowest levels since July 2021. As of March 9, 165 people in Austin and 2,636 in the state were hospitalized with COVID-19.
Real estate
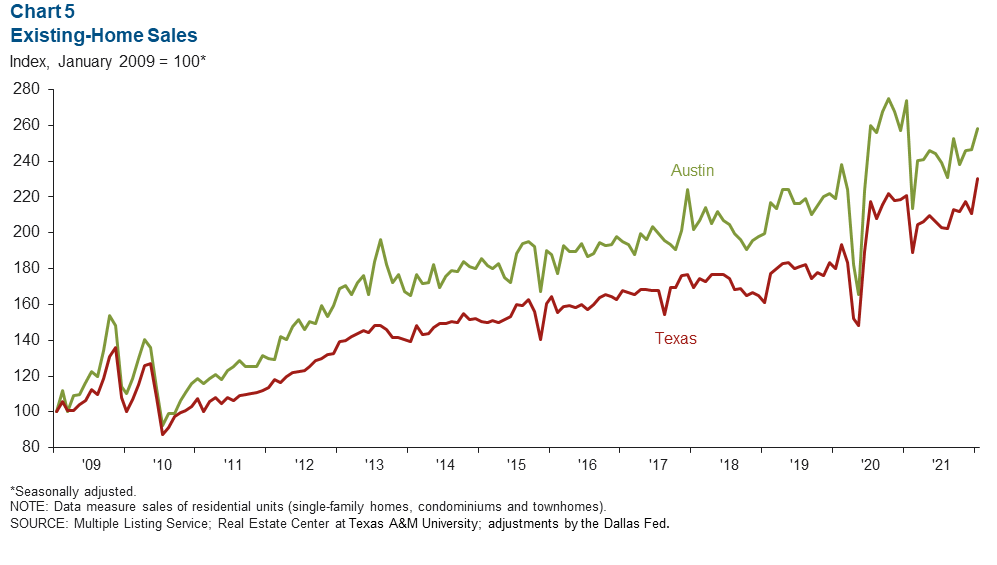
January home sales rise
January existing-home sales in Austin increased 4.6 percent month-over-month, compared with 0.2 percent in December (Chart 5). Year-over-year sales in Austin were down 5.8 percent, while Texas existing-home sales reached a record high as sales grew 4.2 percent. The median price of homes sold at the metro and state levels hit record highs. In January, the median price reached $500,142 in the metro—a 21.1 percent rise year over year. The median price reached $330,175 in the state—a 11.1 percent jump.
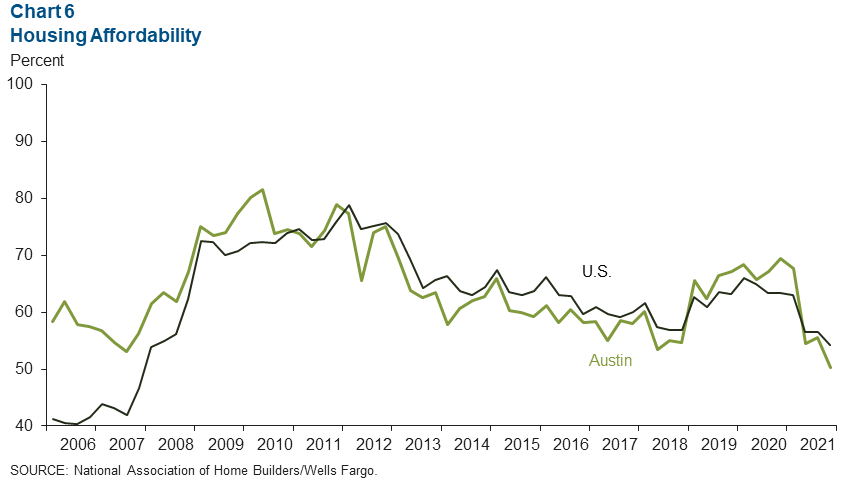
Housing affordability declines
Amid a hot housing market, housing affordability in Austin dipped from 55.5 percent to 50.3 percent in fourth quarter 2021 after increasing 1 percentage point in the third quarter (Chart 6). Housing affordability is defined as the percentage of homes sold that the median-income household can afford. Affordability fell at the national level from 56.6 percent to 54.2 percent. Since the fourth quarter of 2020, housing affordability has retracted 19.2 percentage points in Austin and 9.1 percentage points in the nation.
NOTE: Data may not match previously published numbers due to revisions.
About Austin Economic Indicators
Questions can be addressed to Mytiah Caldwell at Mytiah.Caldwell@dal.frb.org. Austin Economic Indicators is released on the first Thursday of every month.