Austin Economic Indicators

January 4, 2023
| Austin economy dashboard (November 2022) | |||
| Job growth (annualized) Aug.–Nov. '22 |
Unemployment rate |
Avg. hourly wages |
Avg. hourly wage growth y/y |
| 4.6% | 2.8% | $32.19 | 1.2% |
In November, Austin’s economy continued to grow as employment increased and the unemployment rate fell. At the same time, Austin’s housing market continued to cool down due to rising mortgage rates that caused both housing sales and median prices to decline.
Business-cycle index
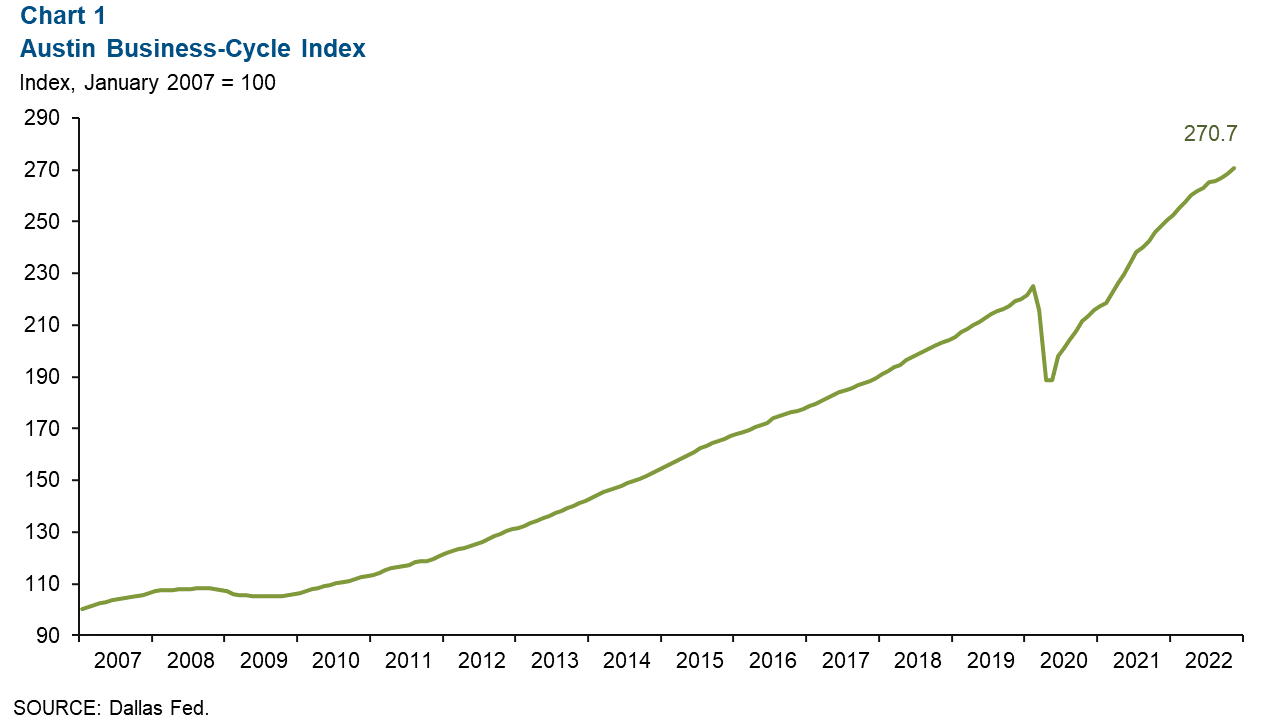
The Austin Business-Cycle Index—a broad measure of economic activity—grew at an annualized 10.6 percent in November, greater than the 8.0 percent growth in October (Chart 1).
Labor Market
Unemployment rate falls further
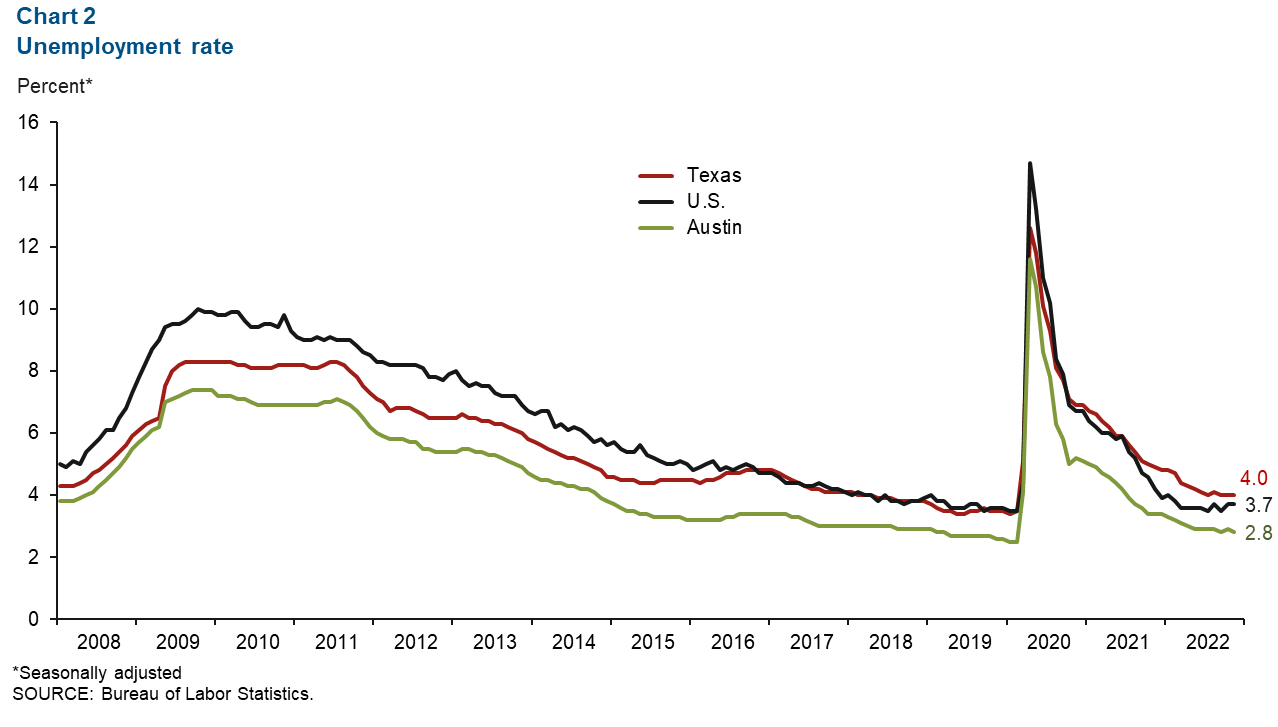
Austin’s unemployment rate fell to 2.8 percent in November (Chart 2). This was lower than the state’s jobless rate of 4.0 percent and the nation’s 3.7 percent rate. The metro area labor force increased at an annualized pace of 5.0 percent in November.
Austin employment stays strong
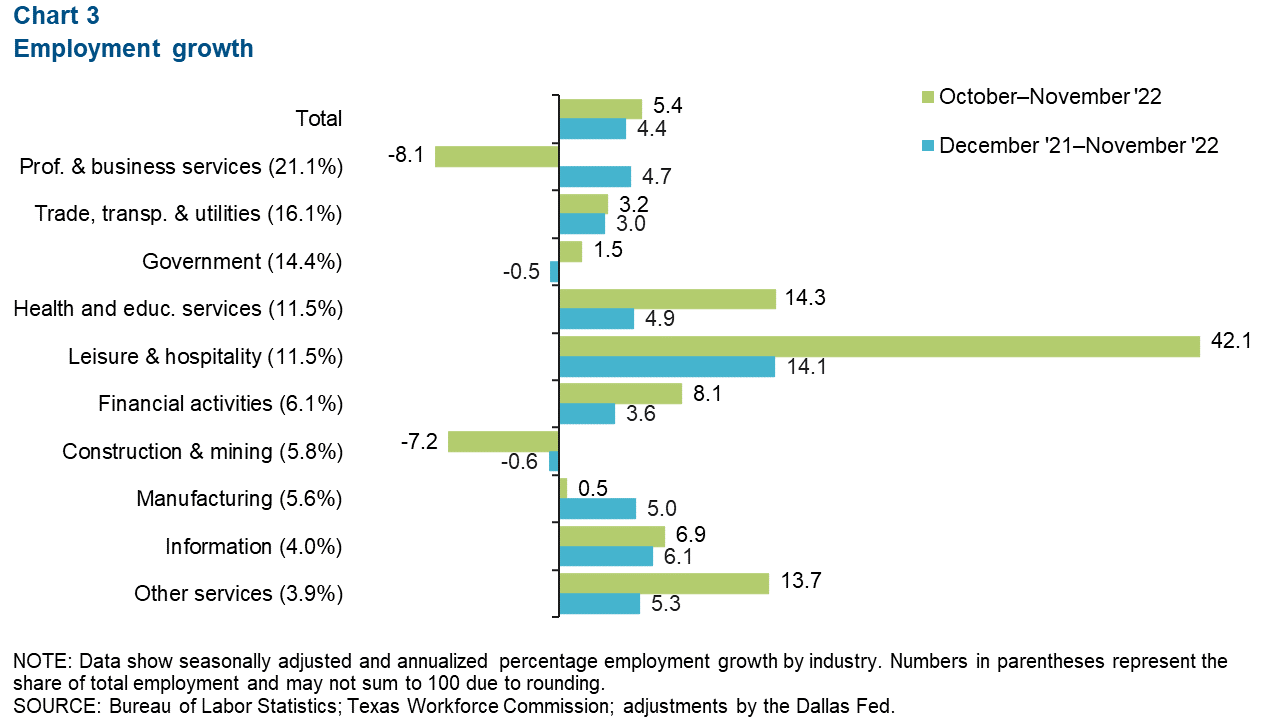
Austin employment grew by an annualized 5.4 percent, or by 40,854 net jobs in November (Chart 3). Growth was led by leisure and hospitality (42.1 percent, or 4,229 jobs), and health and education services (14.3 percent, or 1,605 jobs). Two sectors experienced declines in the past month: professional and business services (8.1 percent, or 1,889 jobs), and construction (7.2 percent, or 461 jobs). As of November, Austin payrolls grew 5.1 percent year over year.
Housing market
Home prices fall further
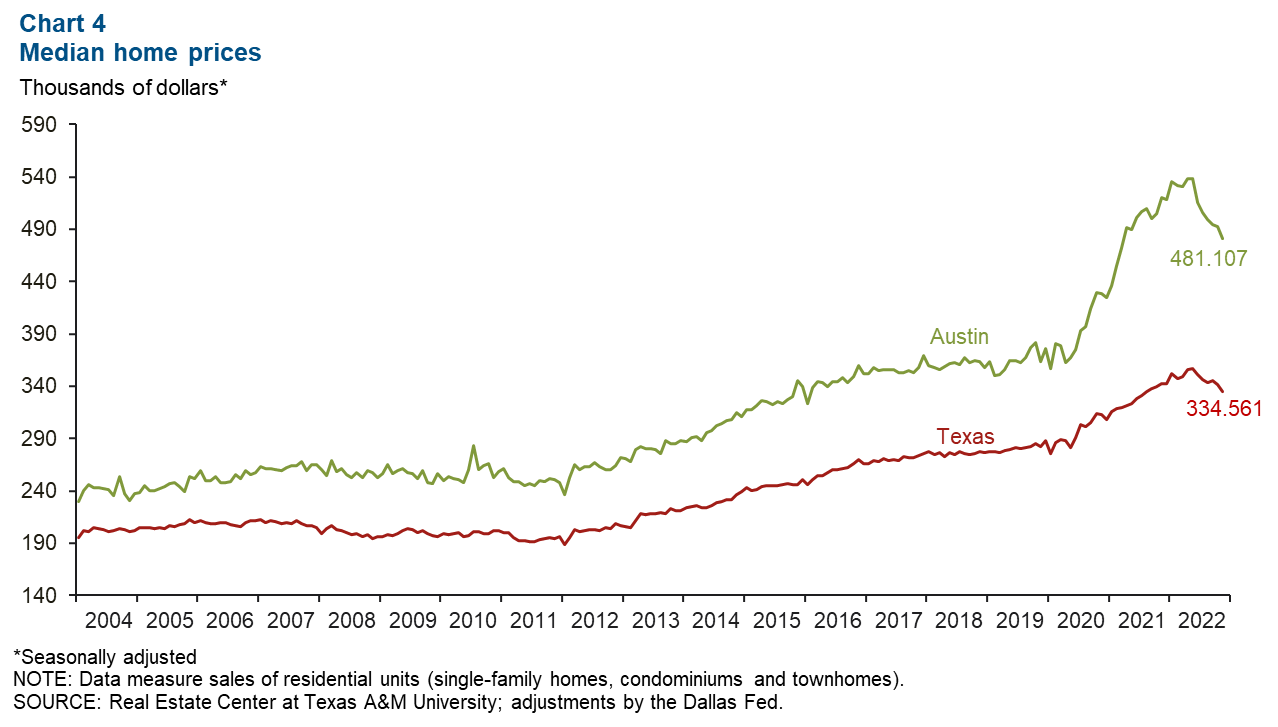
Austin’s median home price continued to decrease in November, by 2.3 percent, reaching $481,107 (Chart 4). One of the reasons the median price of homes sold is declining is due to people choosing lower-priced homes in response to prices and the interest rate. Thus, the decline is also reflective of a composition effect, where the median home prices are indicative of those lower-priced homes. Similar to Austin, Texas’ median home price fell 2.0 percent to $334,561. Year over year, Austin has experienced a 7.5 percent decrease in median home prices, while Texas has experienced a 2.4 percent decline.
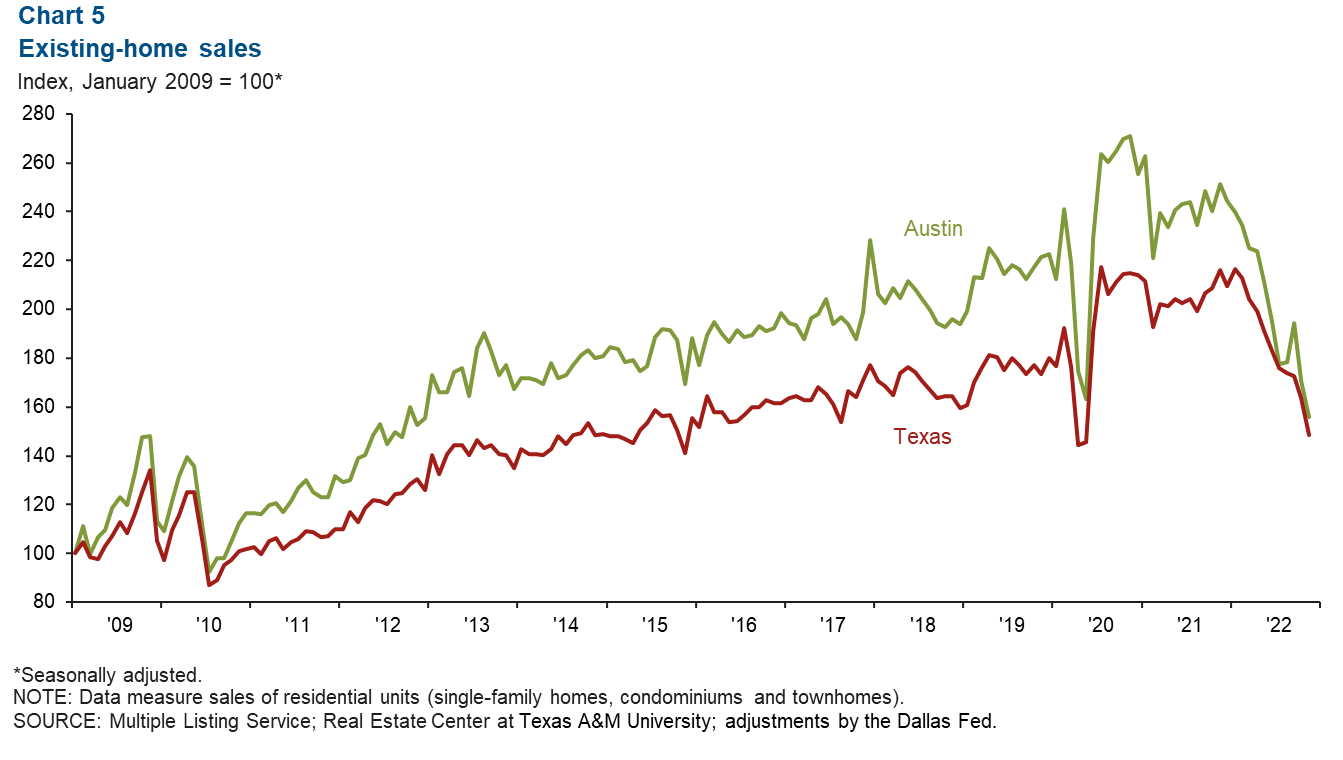
Home sales drop to pandemic levels
Austin home sales continued to decrease in November, falling 8.6 percent, on par with Texas’ decline of 9.3 percent (Chart 5). While month over month Texas experienced a greater decline than Austin, year over year, Austin saw a larger drop in home sales (38.0 percent) than Texas (31.3 percent); now both are at or below levels last seen during the beginning of the pandemic in 2020.
NOTE: Data may not match previously published numbers due to revisions.
About Austin Economic Indicators
Questions or suggestions can be addressed to Vee Kalkunte at Prithvi.Kalkunte@dal.frb.org.
Austin Economic Indicators is released on the first Thursday of every month.