Austin Economic Indicators

May 4, 2023
| Austin economy dashboard (March 2023) | |||
| Job growth (annualized) Dec. '22–March '23 |
Unemployment rate |
Avg. hourly earnings |
Avg. hourly earnings growth y/y |
| 2.4% | 3.0% | $33.80 | 5.1% |
In March, Austin’s economy experienced strong growth. Employment rebounded from the prior month’s decline, and the business-cycle index increased. Unemployment did not change as the labor force continued to expand. In the housing market, existing-home sales increased, but median prices continued to fall.
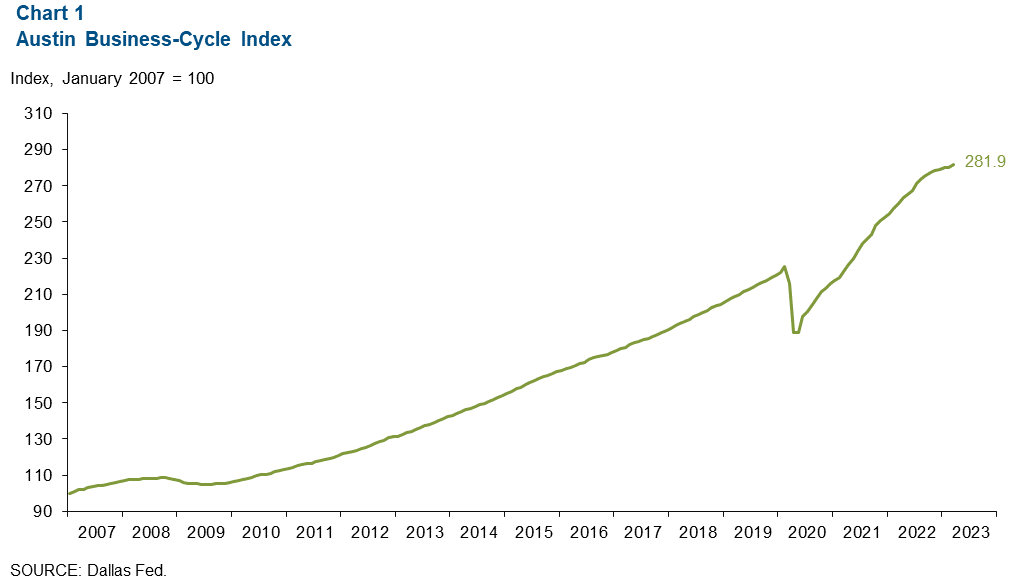
Business-cycle index
The Austin Business-Cycle Index rose 8.1 percent from February to March, greater than the 1.1 percent increase from January to February (Chart 1).
Labor market
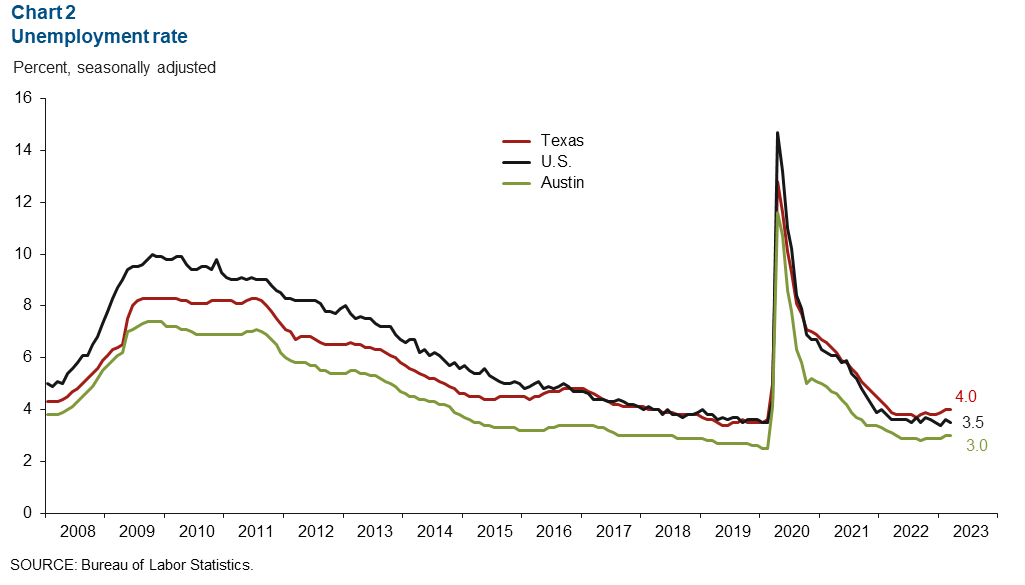
Unemployment rate stays steady
In March, Austin’s unemployment rate remained at 3.0 percent, lower than the state’s jobless rate of 4.0 percent and the nation’s rate of 3.5 percent (Chart 2). The metro’s labor force grew 4.6 percent in March and is up 6.7 percent year to date.
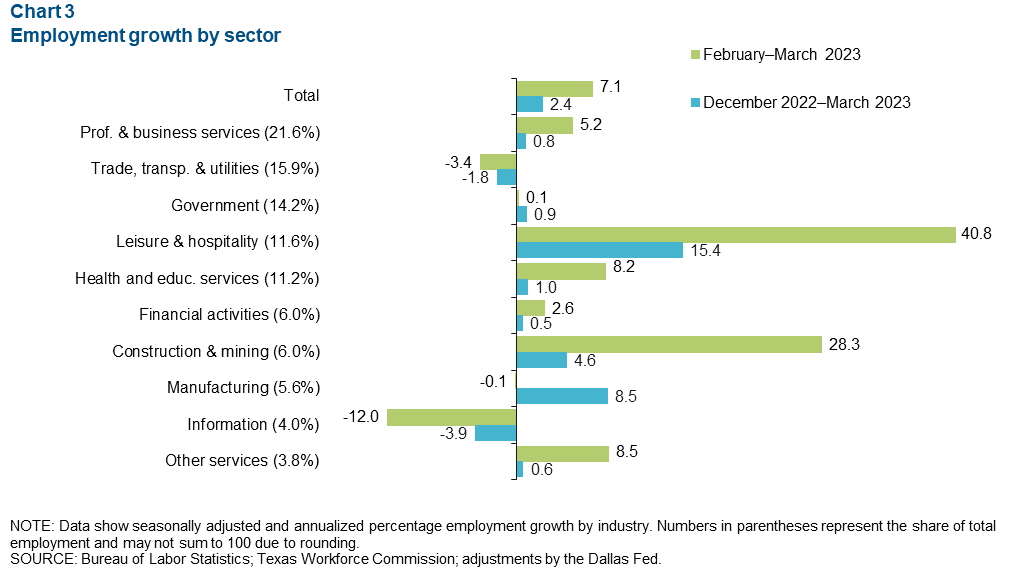
Employment expands
Austin employment increased 7.1 percent in March as most sectors grew (Chart 3). Leisure and hospitality led the growth (4,269 jobs, or 40.8 percent), followed by construction and mining (1,628 jobs, or 28.3 percent). Information was down 566 jobs, or 12.0 percent, and trade, transportation and utilities was down 592 jobs, or 3.4 percent.
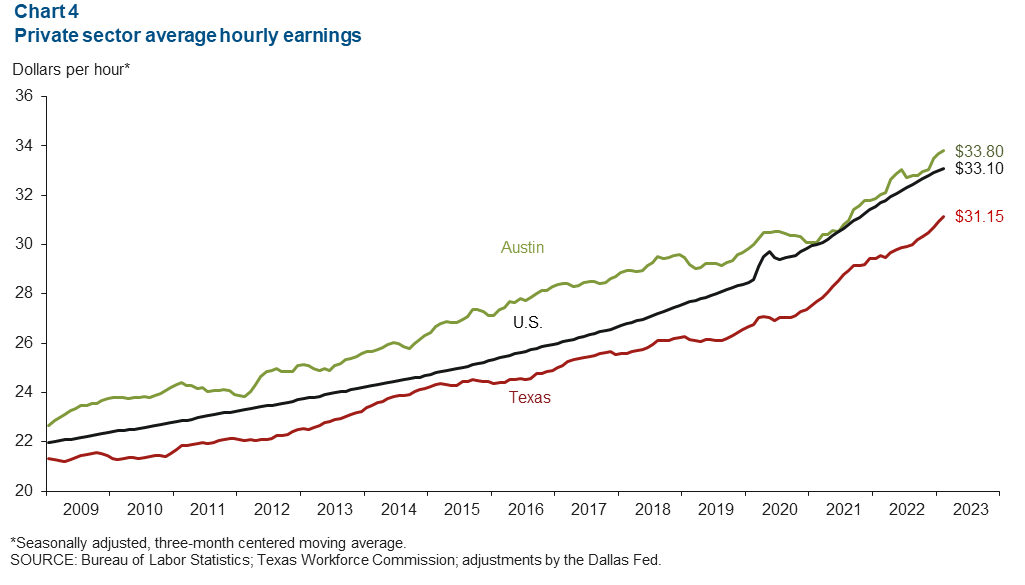
Hourly earnings move up
Austin private hourly earnings increased 3.5 percent in March (Chart 4). The three-month moving average of wages was $33.80, remaining above the state average of $31.15 and the national average of $33.10. Year-over-year wages increased 5.1 percent in Austin, above the nation’s 4.2 percent growth but below the state’s 6.0 percent gain.
Housing market
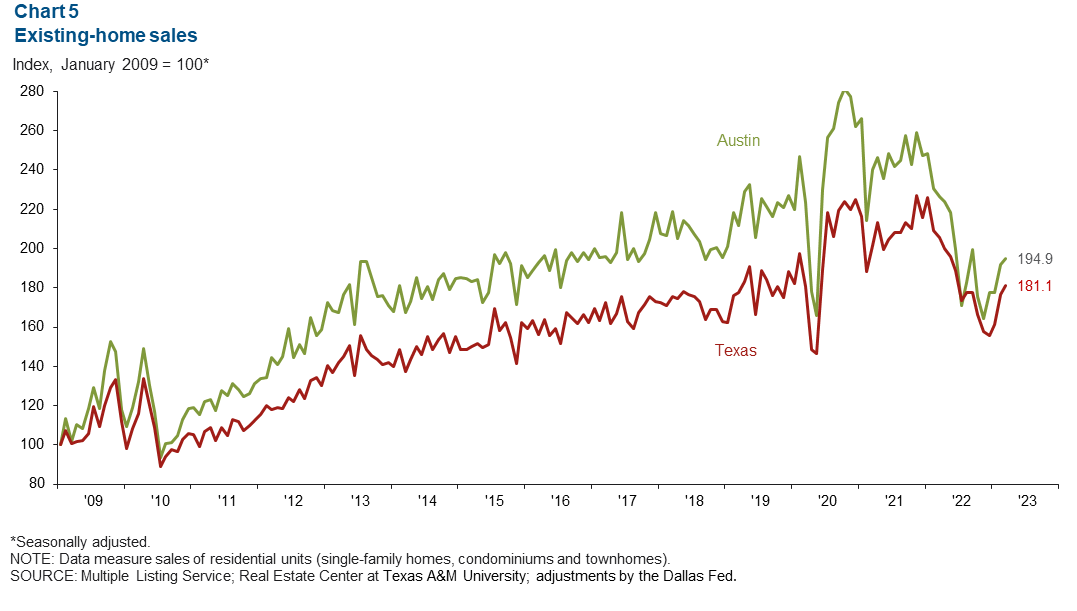
Existing-home sales rise
In March, Austin’s existing-home sales rose 1.4 percent, less than the state’s 2.6 percent increase (Chart 5). Year over year, however, the metro’s sales have grown 14.0 percent, compared with 11.9 percent in the state.
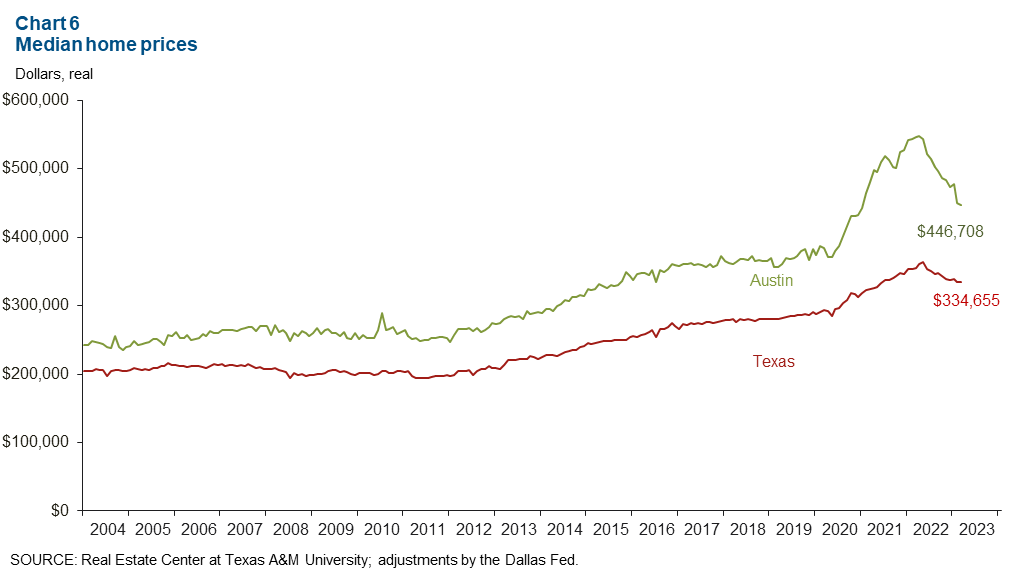
Median home prices continue to fall
Although home sales have risen the past four months, median home prices have trended down the past 11 months. Austin home prices fell an annualized 7.6 percent in March to $446,708 (Chart 6). In contrast, Texas prices increased 1.3 percent to $334,655. Year over year, Austin’s median home prices have fallen 18.1 percent, more than the state’s 5.9 percent decline.
NOTE: Data may not match previously published numbers due to revisions.
About Austin Economic Indicators
Questions or suggestions can be addressed to Vee Kalkunte at Prithvi.Kalkunte@dal.frb.org.
Austin Economic Indicators is released on the first Thursday of every month.