Austin Economic Indicators

July 6, 2023
| Austin economy dashboard (May 2023) | |||
| Job growth (annualized) Dec. '22–May '23 |
Unemployment rate |
Avg. hourly earnings |
Avg. hourly earnings growth y/y |
| 2.8% | 3.5% | $33.46 | -0.3% |
Austin’s job growth slowed in May. In addition, unemployment ticked up and wages declined slightly, suggesting further weakening in the labor market. Austin’s music scene continued to mature, with the average performer's age shifting upward, and the metro population grew in 2022.
Business-cycle index
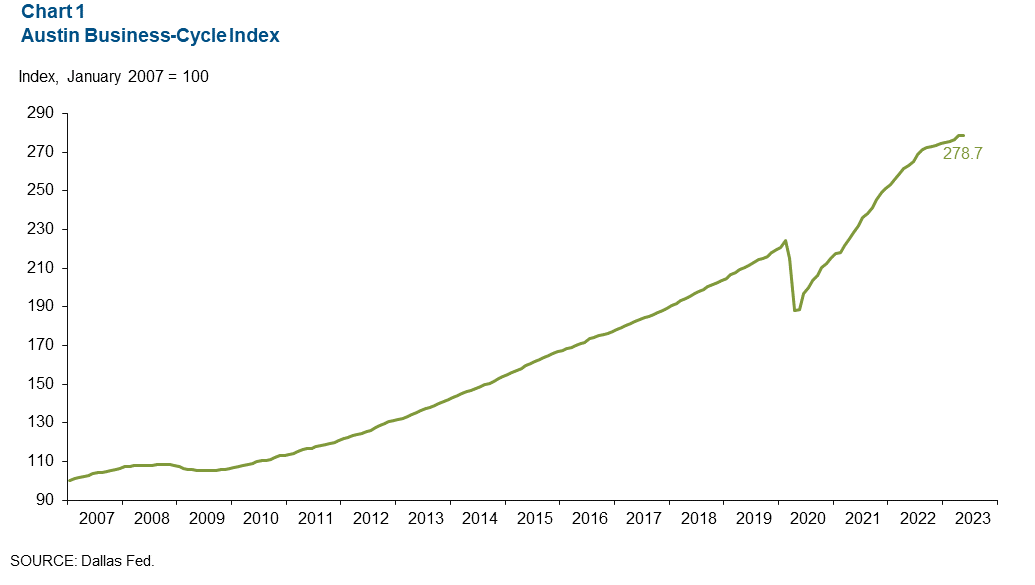
The Austin Business-Cycle Index—a broad measure of economic activity—grew at an annualized 1.9 percent rate in May, slower than the 9.4 percent rate in April (Chart 1).
Labor market
Unemployment rate rises
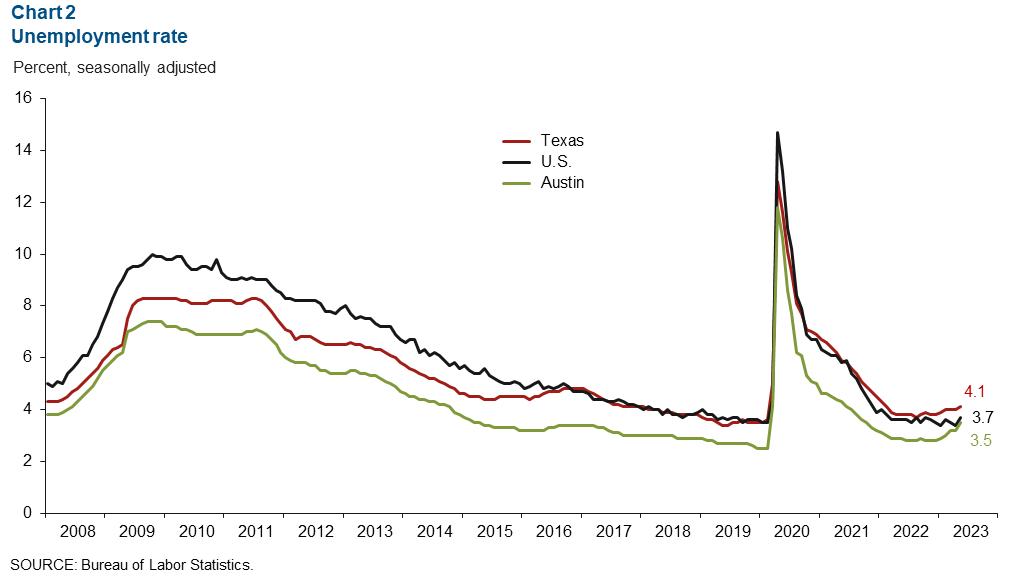
Austin’s unemployment rate increased to 3.5 percent in May but remained below the state’s rate of 4.1 percent and the nation’s rate of 3.7 percent (Chart 2). In April, the local labor force declined an annualized 2.1 percent.
Employment slows
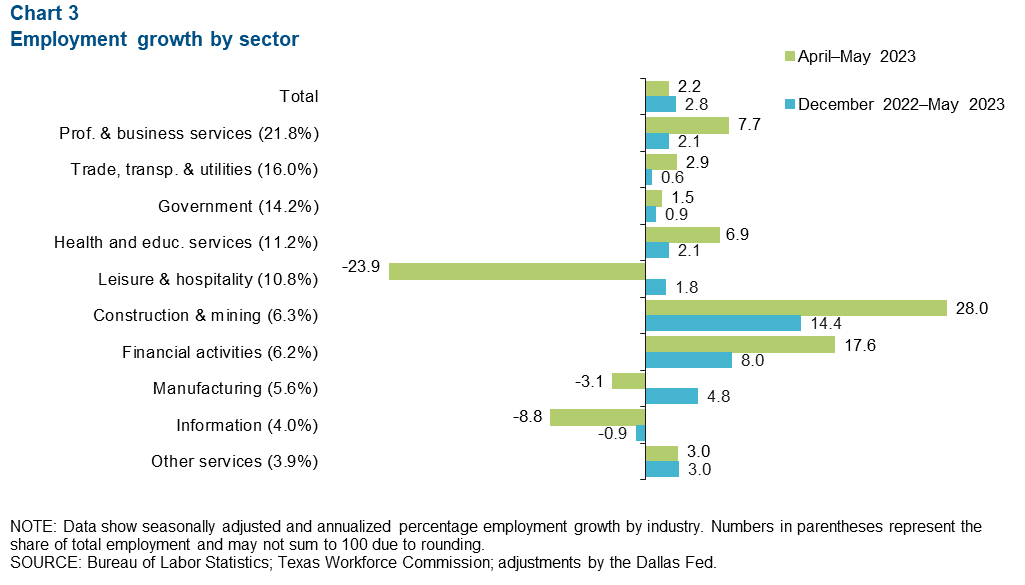
Austin employment increased 2.2 percent in May, slower than April’s 5.6 percent annualized gain (Chart 3). Sectors with the greatest improvement for the second month in a row were construction and mining (28.0 percent, or 1,670 jobs), and financial services (17.6 percent, or 1,091 jobs). Sectors with declines were leisure and hospitality (23.9 percent, or 3,266 jobs), and information (8.8 percent, or 411 jobs). Year to date, Austin’s payroll employment has grown 2.8 percent, less than Texas’ 3.6 percent increase but more than the nation’s 2.5 percent rise.
Average wage down in May
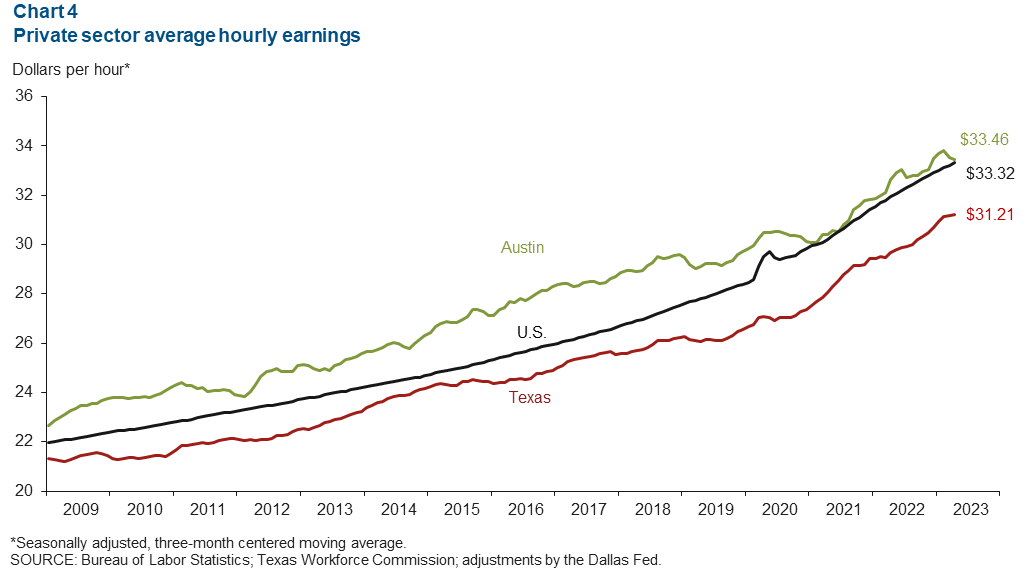
The three-month moving average of Austin wages declined 2.1 percent in May (Chart 4). Austin’s hourly earnings of $33.46 were still above the state average of $31.21 and the national average of $33.32. In the past year, Austin wages declined 0.3 percent, compared with growth of 4.2 percent for the nation and 4.3 percent for the state.
Music industry
From 2013 to 2021, the average age of Austin musicians began to shift from 25–39 to 40–54 (Chart 5). Furthermore, the size of venues in Austin are becoming concentrated at the ends: Most venues are small, but large venues are increasing their presence, with fewer serving medium-sized audiences.
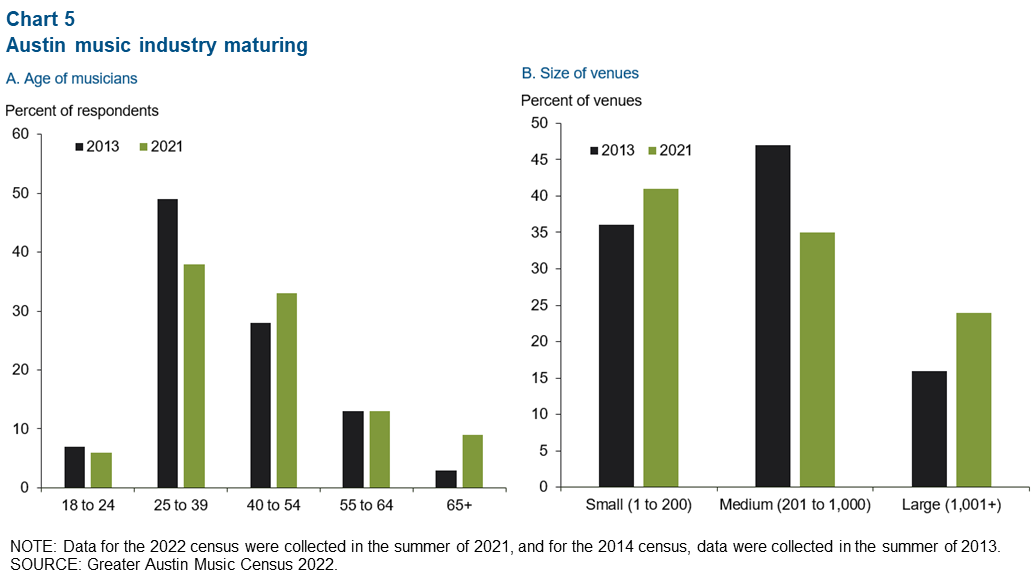
According to the 2022 Greater Austin Music Census, some changes in the music scene can be attributed to the sharp increase in housing costs in Austin proper, the expansion of the industry past Austin’s city limits and the growing recognition of Austin as a music capital, making the industry relatively self-contained.
Population growth
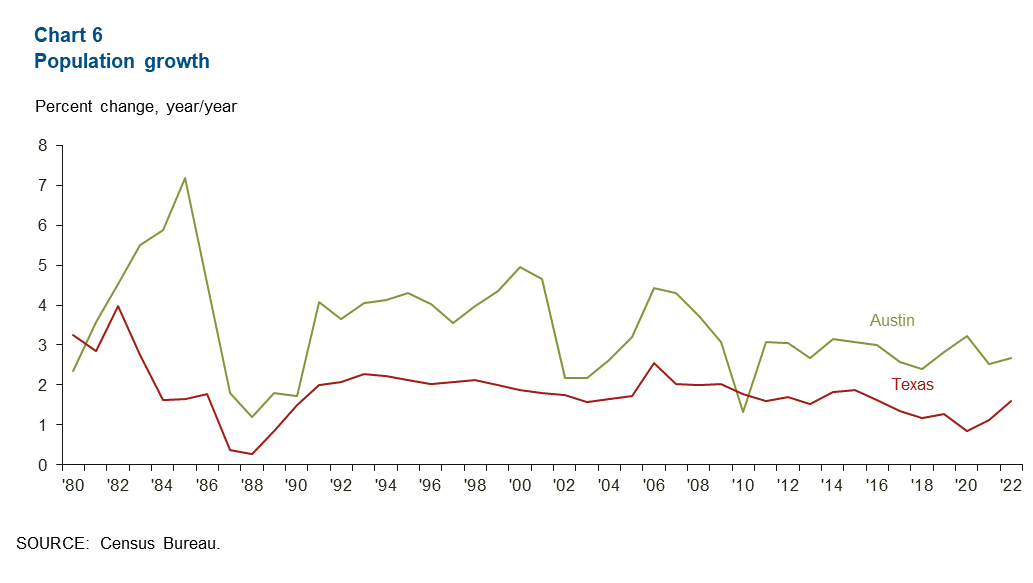
Census data show that Austin’s population increased 2.7 percent in 2022, reversing a trend from the year prior and outpacing the state’s 1.6 percent growth (Chart 6). According to the Austin Chamber of Commerce, growth in the past few years has largely been driven by domestic migration. Over half of migrants have come from other parts of Texas, followed by 8.7 percent from California.
NOTE: Data may not match previously published numbers due to revisions.
About Austin Economic Indicators
Questions or suggestions can be addressed to Vee Kalkunte at Prithvi.Kalkunte@dal.frb.org.
Austin Economic Indicators is released on the first Thursday of every month.