Austin Economic Indicators

| Austin economy dashboard (November 2023) | |||
| Job growth (annualized) Aug.–Nov. '23 |
Unemployment rate |
Avg. hourly earnings |
Avg. hourly earnings growth y/y |
| 3.1% | 3.4% | $33.58 | 1.2% |
In November, Austin experienced solid job growth, accompanied by a decline in the unemployment rate and a slight fall in wage growth. Employer notices to the federal government of upcoming layoffs under the Worker Adjustment and Retraining Notification Act (WARN) increased significantly in 2023, and layoff announcements were concentrated in transportation and warehousing followed by professional business services.
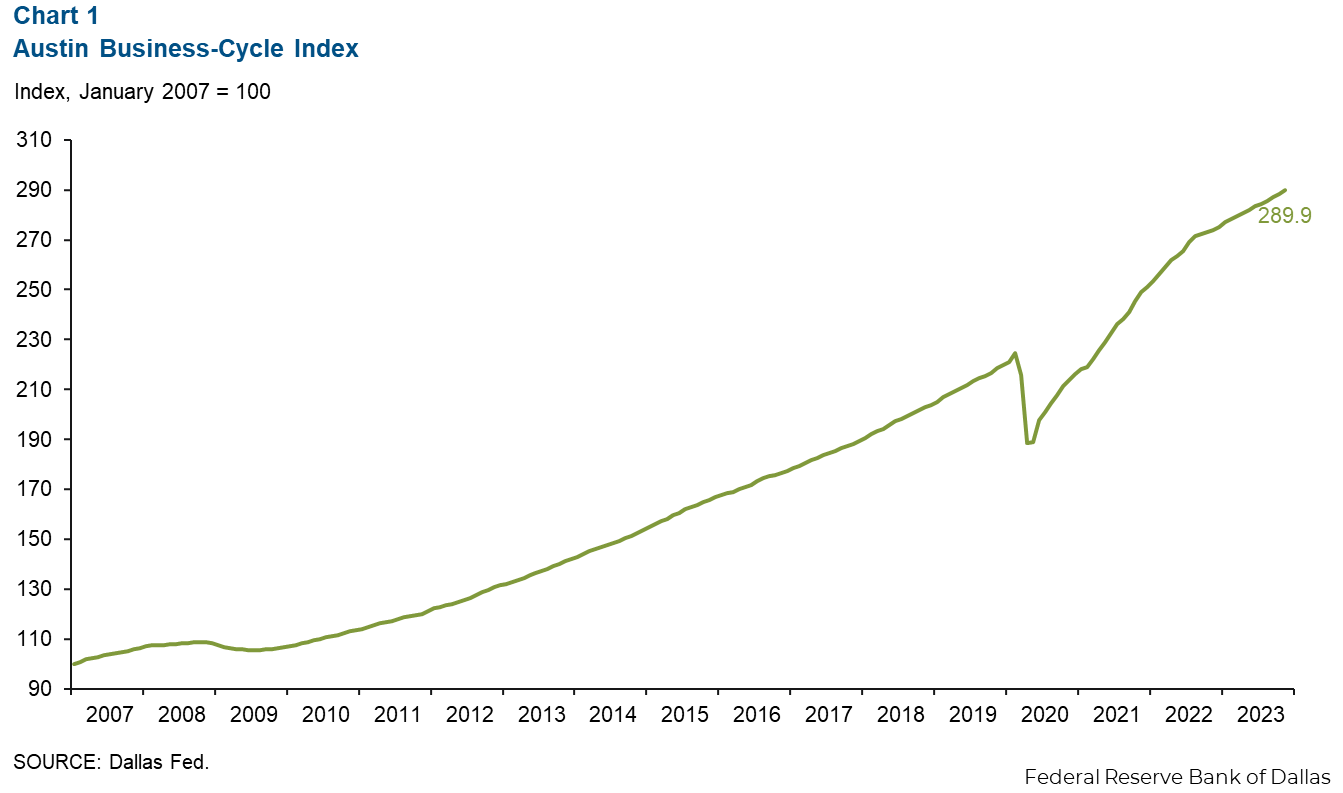
Business-cycle index
The Austin Business-Cycle Index, a broad measure of economic activity, grew an annualized 7.7 percent in November, faster than the 4.0 percent gain in October (Chart 1).
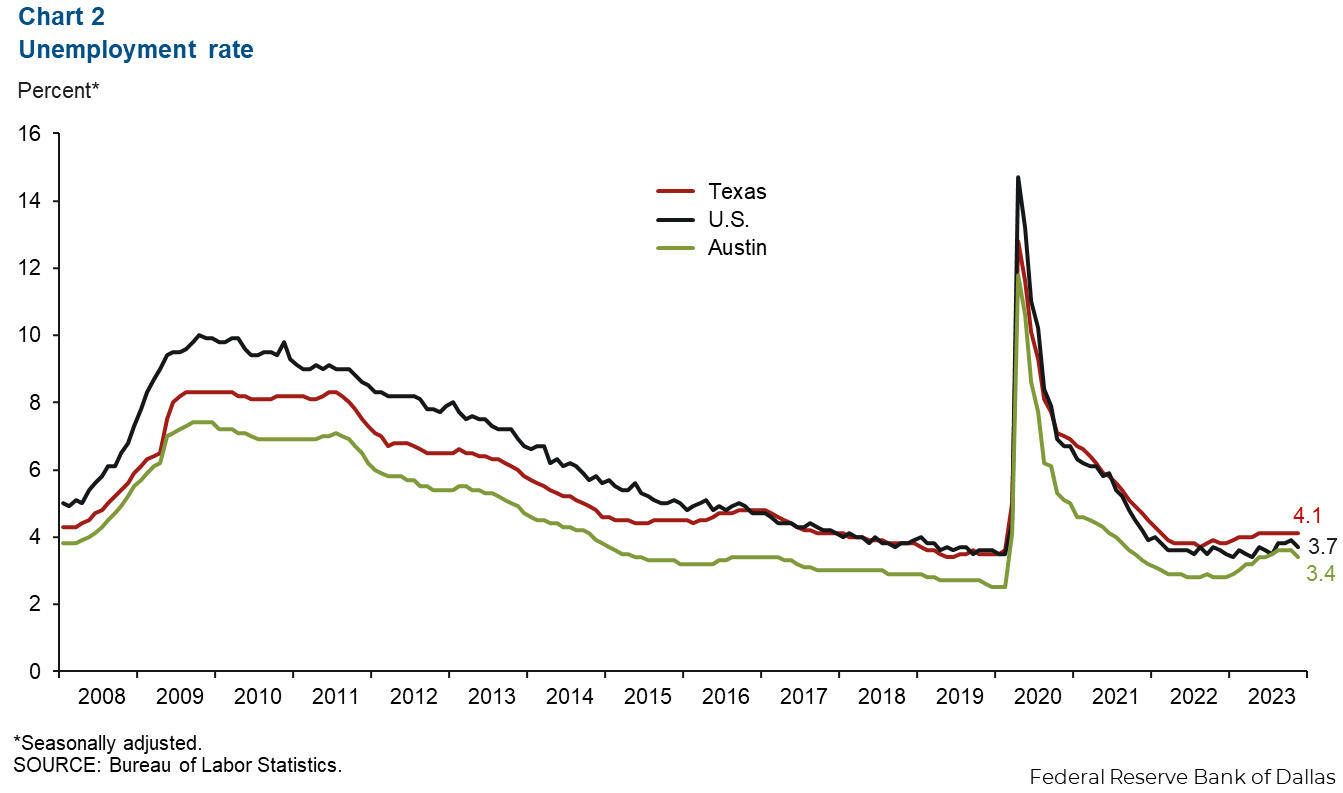
Labor market
Unemployment rate declines
Austin’s unemployment rate declined to 3.4 percent, remaining below the state rate of 4.1 percent and the national rate of 3.7 percent (Chart 2). In November, the local labor force increased an annualized 6.3 percent.
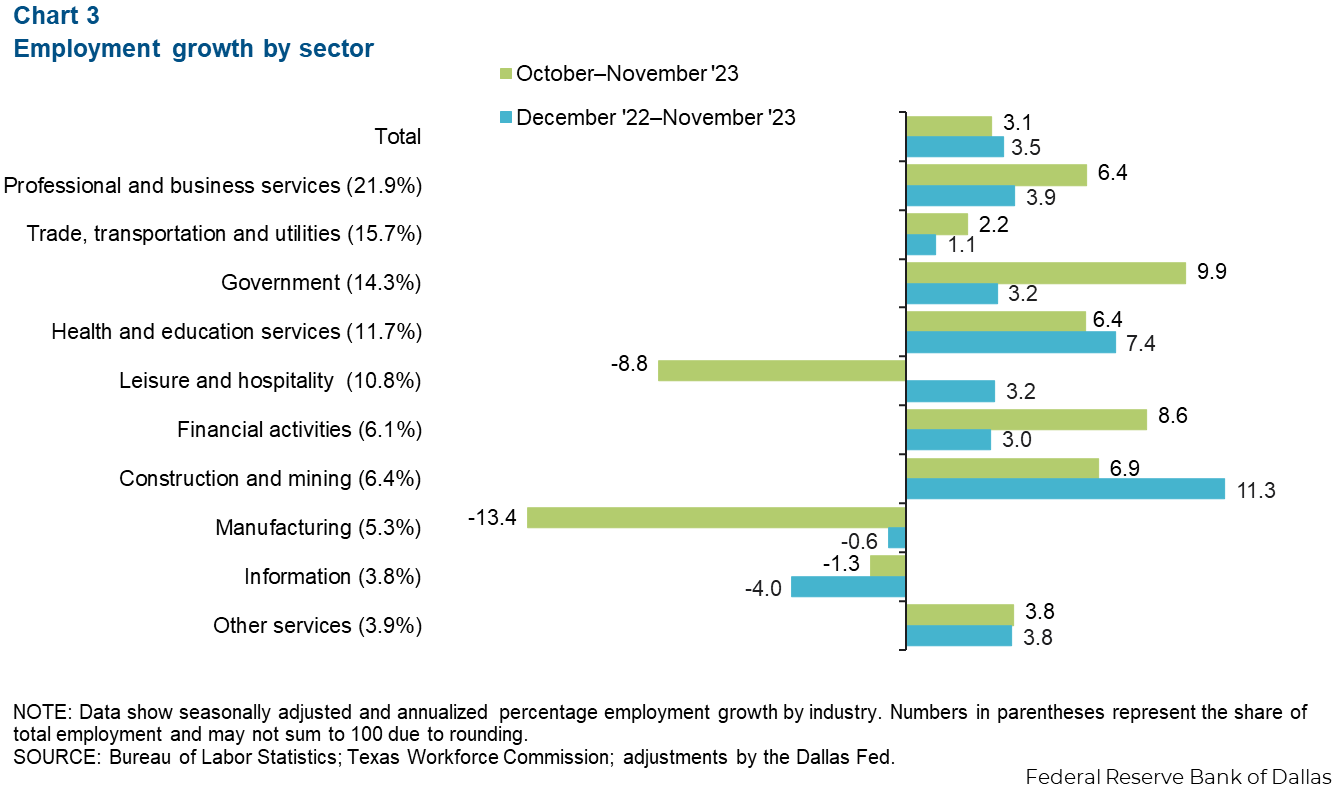
Employment grows in most sectors
Austin employment increased 3.1 percent in November, greater than October’s 0.5 percent gain (Chart 3). Sectors with the most growth are government (1,517 jobs or 9.9 percent) and financial activities (552 jobs or 8.6 percent). Sectors that saw a decline included manufacturing (down 863 jobs or 13.4 percent), and leisure and hospitality (down 1,118 jobs or 8.8 percent). Year to date, Austin’s payrolls expanded 3.5 percent, outpacing the state’s 3.3 percent growth and the nation’s 1.8 percent growth.
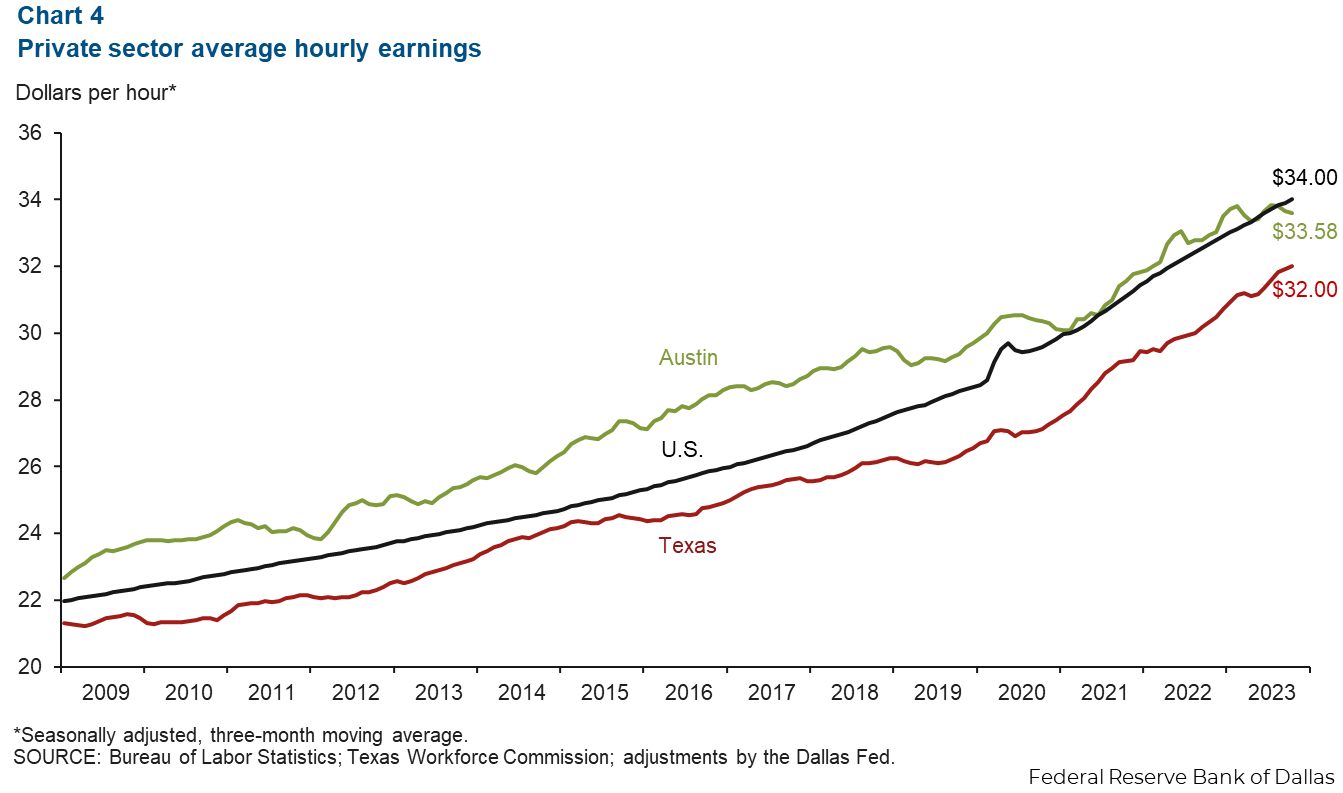
Austin wages continue to contract
The three-month moving average of wages in Austin declined 2.7 percent in November (Chart 4). The average was $33.58 in November. For the third month in a row, Austin was below the nation’s average, which was $34.00 in November, but Austin remained above the state’s rate of $32.00. Year over year, Austin wage growth of 1.2 percent was slower than U.S. gains of 4.0 percent and Texas growth of 4.8 percent.
Mass layoffs (WARN)
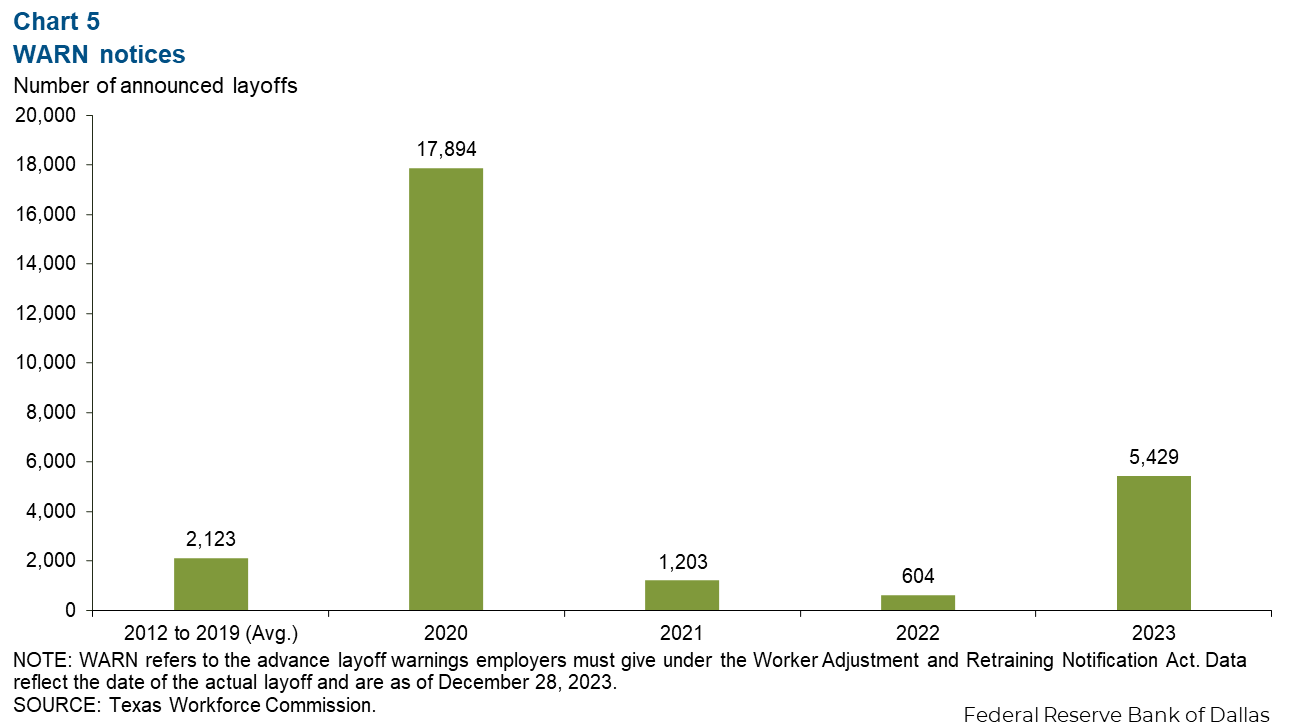
Mass layoff notices (WARN notices) went to 5,429 employees in the Austin metropolitan statistical area in 2023, double the annual average from 2021 to 2019 and triple the number of layoff notices for 2021 and 2022 combined (Chart 5). Much of this loss was concentrated in the first half of the year, driven by the cooldown in the labor market, with a spike in December as companies rearranged for the year ahead.
Transportation layoffs overtake professional and business services
In 2023, the transportation and warehousing sector saw the most mass layoffs, followed by professional services and administrative services (Chart 6). Mass layoffs continue to be concentrated among interest-rate-sensitive white collar services (professional services, administrative services, information).

NOTE: Data may not match previously published numbers due to revisions.
About Austin Economic Indicators
Questions or suggestions can be addressed to Vee Kalkunte at Prithvi.Kalkunte@dal.frb.org.
Austin Economic Indicators is released on the first Thursday of every month.