Austin Economic Indicators

| Austin economy dashboard (February 2024) | |||
| Job growth (annualized) Nov. '23–Feb. '24 |
Unemployment rate |
Avg. hourly earnings |
Avg. hourly earnings growth y/y |
| 4.1% | 3.5% | $34.45 | 3.5% |
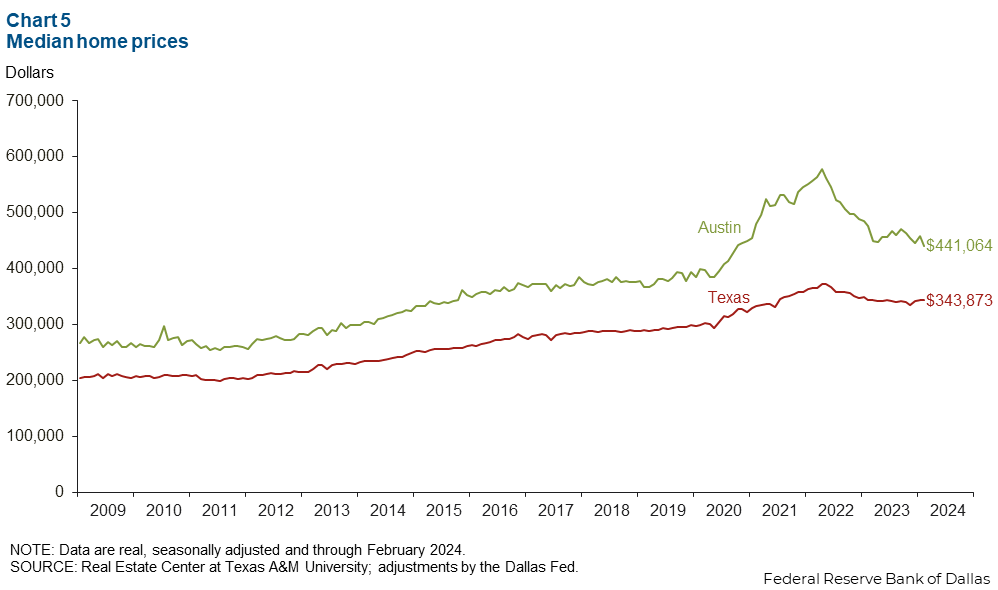
In February, Austin job growth accelerated and was accompanied by solid wage growth. In contrast, the unemployment rate increased, and median home prices fell.
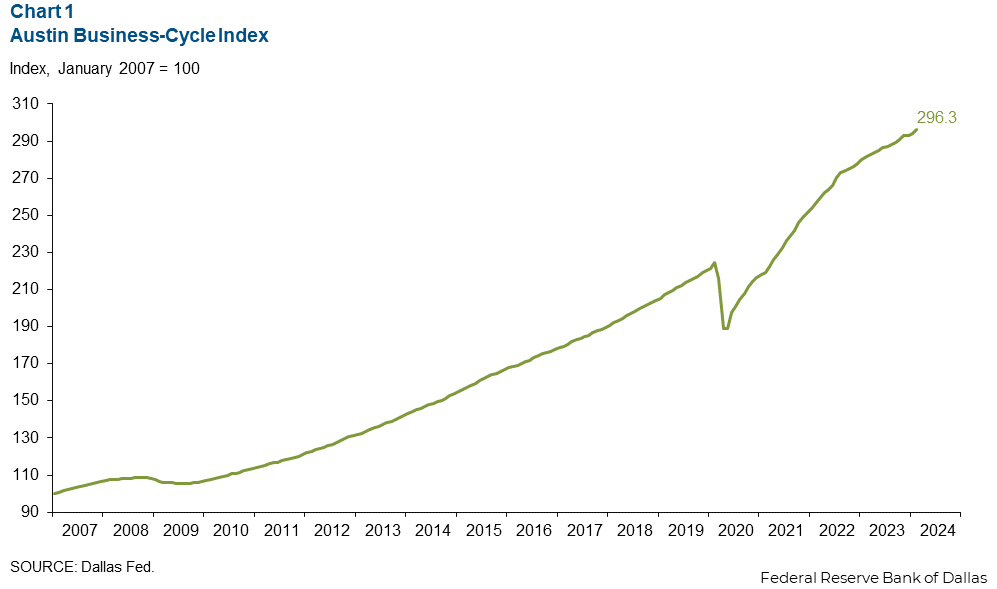
Business-cycle index
The Austin Business-Cycle Index, a broad measure of economic activity, grew an annualized 10.1 percent in February, faster than the 2.6 percent gain in January (Chart 1).
Labor market
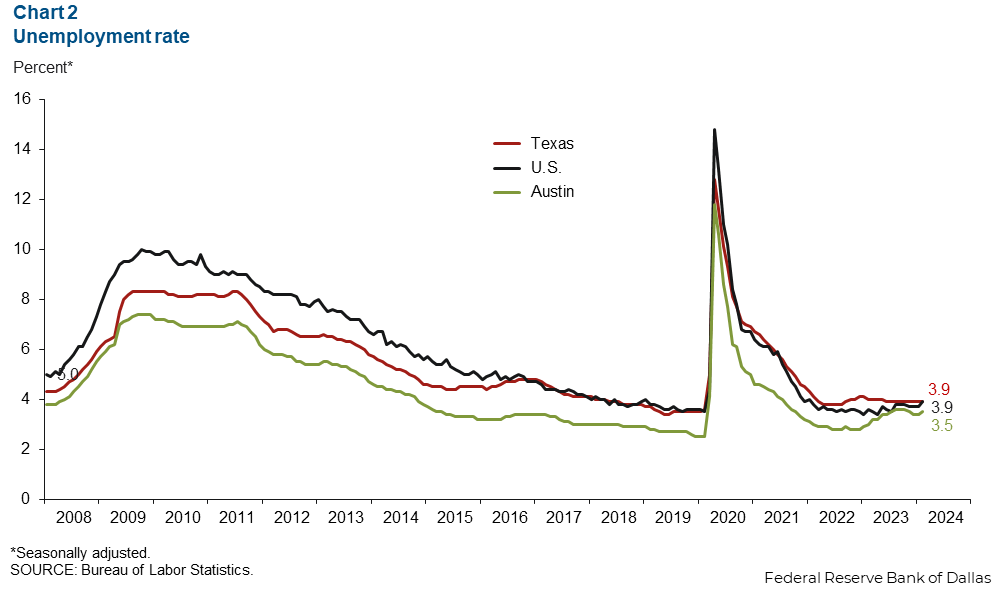
Unemployment rate increases
Austin’s unemployment rate rose to 3.5 percent, remaining below the state’s and the nation’s rate of 3.9 percent (Chart 2). In February, the local labor force increased an annualized 8.8 percent, while the state’s increased 2.1 percent and the nation’s fell 0.1 percent.
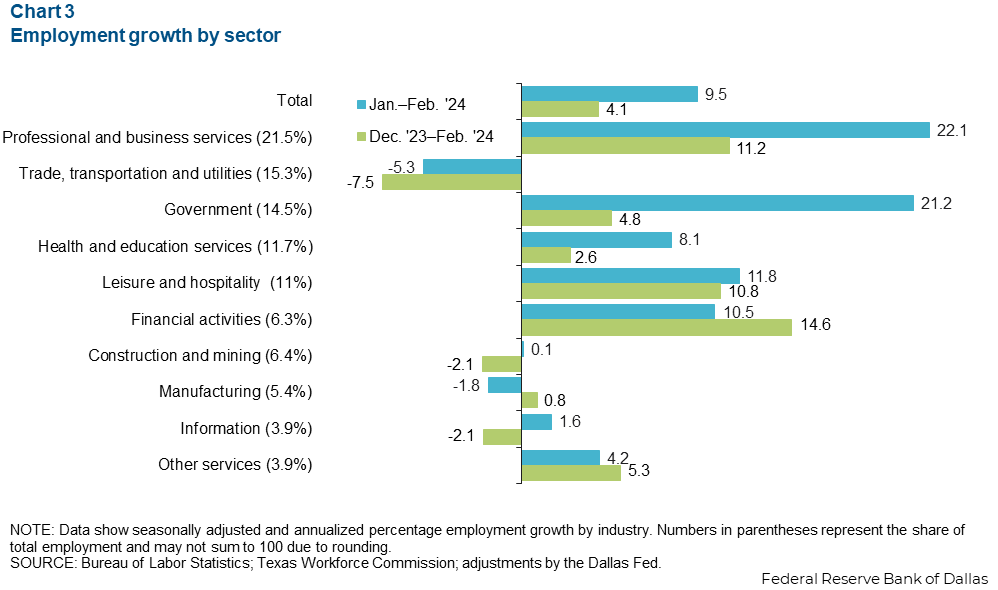
Employment expands
Austin employment increased 9.5 percent in February after decreasing 1.0 percent in January (Chart 3). Sectors with the most growth were professional and business services (4,811 jobs), government (3,119 jobs), and leisure and hospitality (1,382 jobs). Sectors that saw a decline included trade, transportation and utilities (-952 jobs) and manufacturing (-112 jobs). Year to date, Austin has seen 4.1 percent employment growth, below the state’s 4.3 percent but above the nation’s 2.1 percent.
Wage growth trails the national average
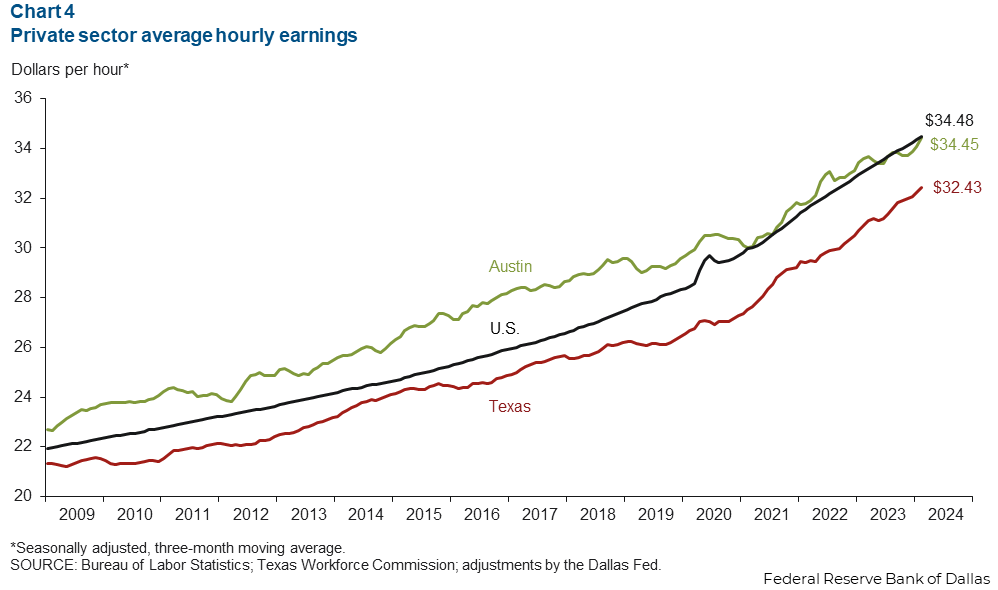
Austin’s three-month moving average of wages increased an annualized 4.0 percent in February (Chart 4). The average hourly wage was $34.45—about the same as the nation’s average but higher than the state’s rate of $32.43. Year over year, Austin wage growth of 3.5 percent was slower than U.S. gains of 4.3 percent and Texas growth of 4.6 percent.
Housing
Austin’s median home prices declined 3.7 percent in February (Chart 5). Texas home prices were also slightly down—0.01 percent. Median home prices in February were $441,064 in Austin and $343,873 in Texas. Year over year, home prices trended down—falling 7.2 percent in the metro and 0.2 percent in the state.
NOTE: Data may not match previously published numbers due to revisions.
About Austin Economic Indicators
Questions or suggestions can be addressed to Isabel Dhillon at Isabel.Dhillon@dal.frb.org.
Austin Economic Indicators is released on the first Thursday of every month.