Dallas-Fort Worth Economic Indicators

The Dallas–Fort Worth economy continues to expand. The June jobs report indicated employment growth moderated, with DFW adding jobs at the slowest pace so far this year. Overall, the DFW economy remains strong, with 3.2 percent annualized job growth year to date. The unemployment rate ticked up in Fort Worth but remained flat in Dallas. Business-cycle indexes for both metros pointed to continued expansion. Home sales growth has been essentially flat in the first half of 2018, and inventory has ticked up but remains tight.
Labor Market
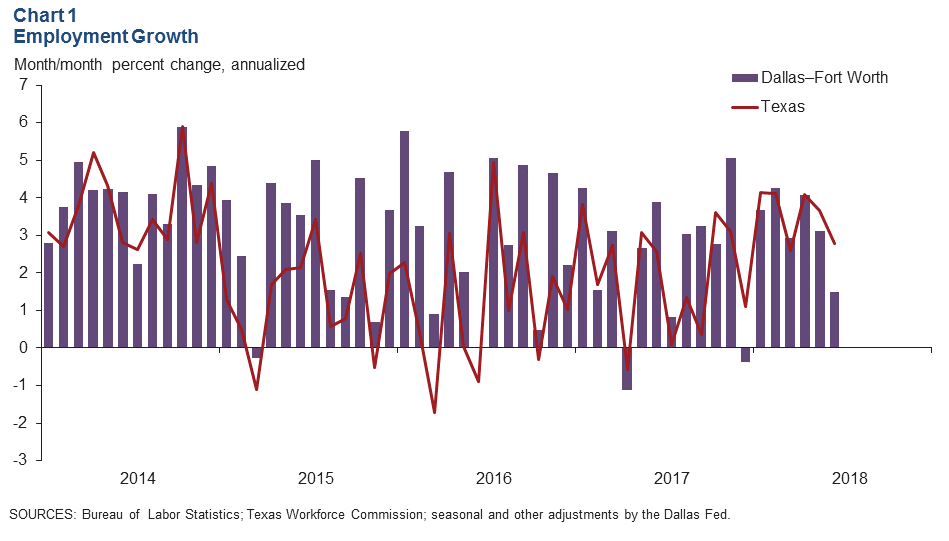
Payroll Expansion Continues but at a Slower Pace
DFW employment growth slowed in June, rising by 4,520 jobs, or an annualized 1.5 percent (Chart 1). However, year-to-date annualized job growth remains robust and above the metro’s long-term average. The unemployment rate held steady at 3.5 percent in Dallas but rose slightly to 3.6 percent in Fort Worth. The readings remained below the Texas and U.S. jobless rates of 4.0 percent.
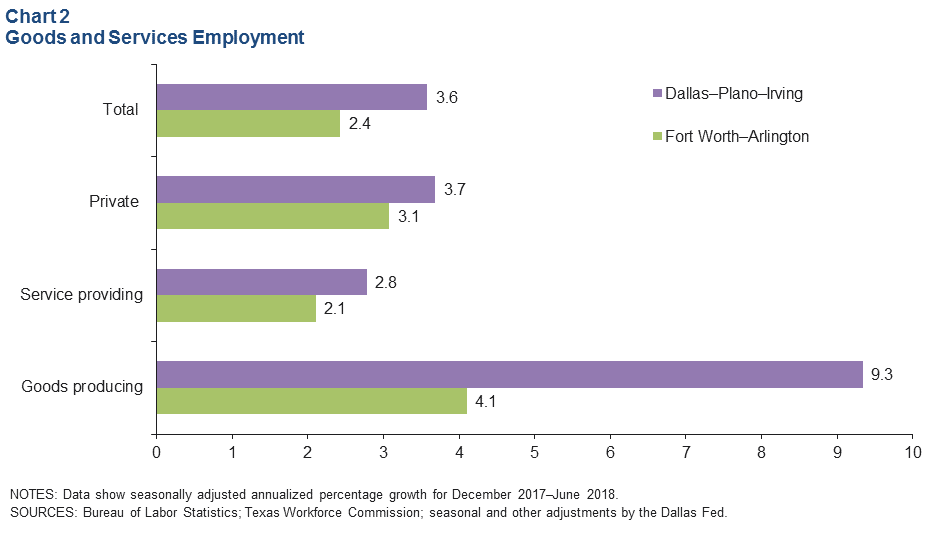
Job Growth in Goods-Producing Sector Remains Strong
Employment growth in Dallas and Fort Worth continued to be widespread across sectors; however, payrolls in the goods-producing sector (manufacturing, construction and mining) expanded at a faster clip than service-related employment (Chart 2). Growth has been particularly strong at an annualized 9.3 percent in Dallas’ goods-producing sector, which comprises 12.7 percent of Dallas employment. This compares with a 2.8 percent increase in Dallas’ service sector payrolls. Job growth in Fort Worth’s goods-producing sector (4.1 percent) has also outpaced its services sector growth rate (2.1 percent). Through June, Dallas has seen slightly higher growth than Fort Worth at an annualized 3.6 percent.
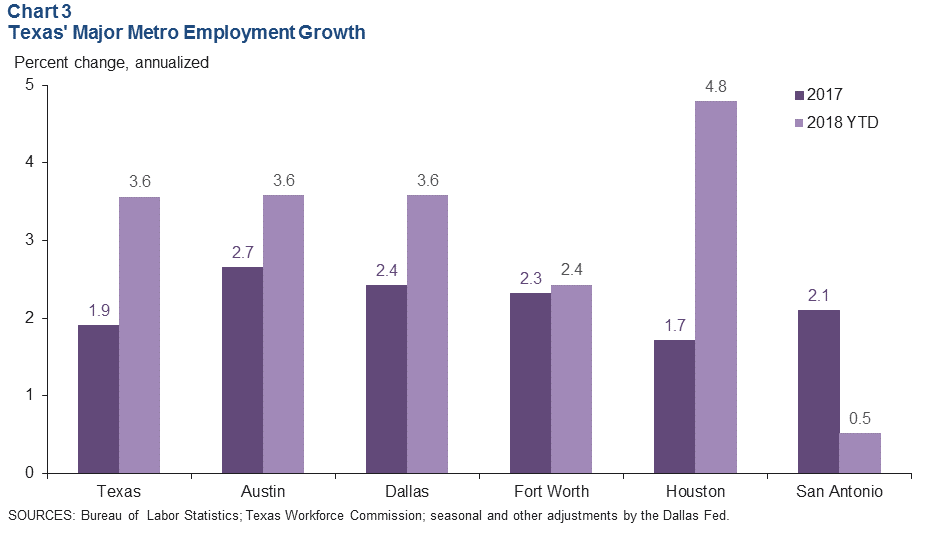
Year-to-Date Employment Growth Outpacing 2017
DFW employment gains were strong in the first half of the year (Chart 3). Payroll growth in Dallas accelerated to 3.6 percent from last year’s 2.4 percent pace, while growth in Fort Worth was roughly on par with last year. Employment growth has picked up in most major Texas metros relative to last year’s pace, with Houston seeing the largest increase. Job gains in San Antonio have been modest this year at 0.5 percent.
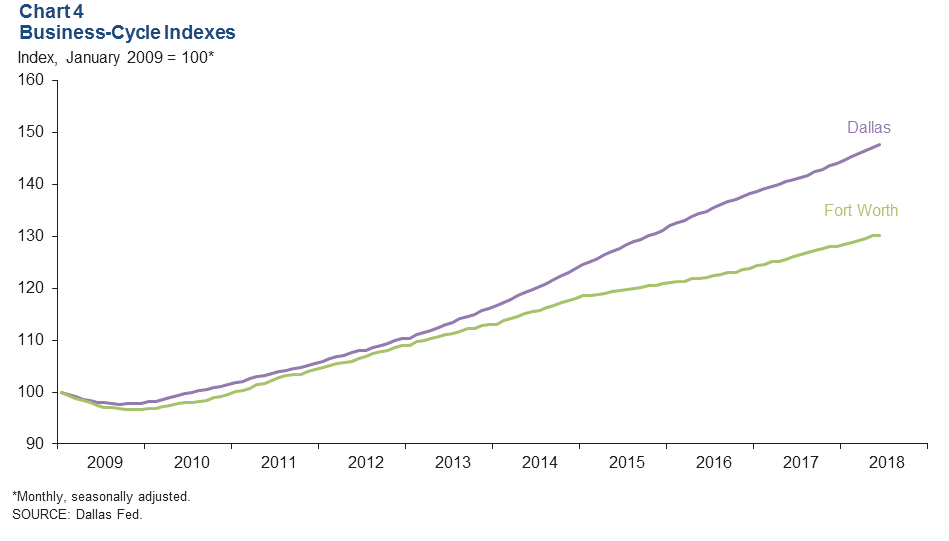
Business-Cycle Indexes
The Dallas and Fort Worth business-cycle indexes continue to indicate strong expansion in the metroplex (Chart 4). Year-over-year growth was 4.8 percent for Dallas and 3.2 percent for Fort Worth. Growth in the Fort Worth index slowed to an annualized 1.3 percent in June, compared with May’s 5.4 increase.
Housing Market
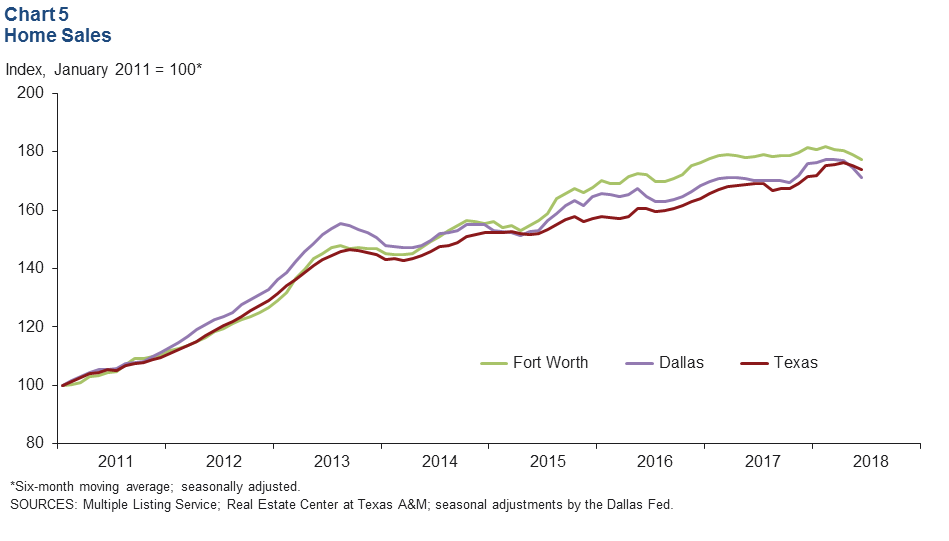
Home Sales Slow
Existing-home sales rose modestly in the metroplex last month. Sales growth has nearly stalled this year, and the six-month moving averages show a slight decline in Dallas and Fort Worth in recent months (Chart 5). The six-month moving average for Texas dipped 0.8 percent in June. In the first half of the year, total existing-home sales were up a modest 0.5 percent in Dallas but down 0.6 percent in Fort Worth compared with the same period last year.
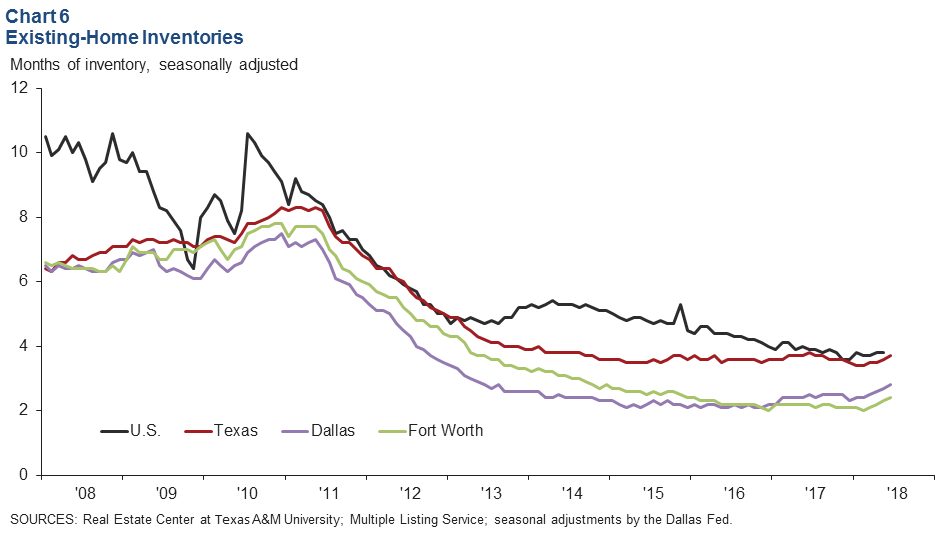
Inventories Remain Tight
DFW existing-home inventories remain very tight despite an uptick in recent months. Inventories in both metros were less than three months in June, well below the six-month supply considered balanced (Chart 6). The Fort Worth market is experiencing a tighter market than Dallas at 2.4 months of inventory, although its median home sales price in June ($233,000) remained well below that of Dallas ($282,000).
NOTE: Data may not match previously published numbers due to revisions.
About Dallas–Fort Worth Economic Indicators
Questions can be addressed to Benjamin Meier at benjamin.meier@dal.frb.org. Dallas–Fort Worth Economic Indicators is published every month on the Tuesday after state and metro employment data are released.