Dallas-Fort Worth Economic Indicators

Economic expansion in Dallas–Fort Worth (DFW) remained broad based and swift, with the July jobs report showing the metro area growing at a 3.0 percent annualized rate—well above its long-run average. Unemployment dipped in the month, and the Dallas and Fort Worth business-cycle indexes posted above-trend growth. Home price appreciation has moderated compared with last year. Net absorption of office space rebounded in the second quarter, and activity in the industrial market continued to be robust.
Labor Market
Payroll Expansion Ongoing
DFW payrolls grew 3.0 percent annualized (nearly 9,000 jobs) in July following gains of just over 7,600 jobs in June (Chart 1). Employment in Dallas rose by more than 6,500 jobs, and Fort Worth saw a gain of 2,400 jobs last month. Year-to-date employment growth of an annualized 3.4 percent is nearly a full percentage point ahead of last year’s pace and second only to Houston among the major Texas metros.
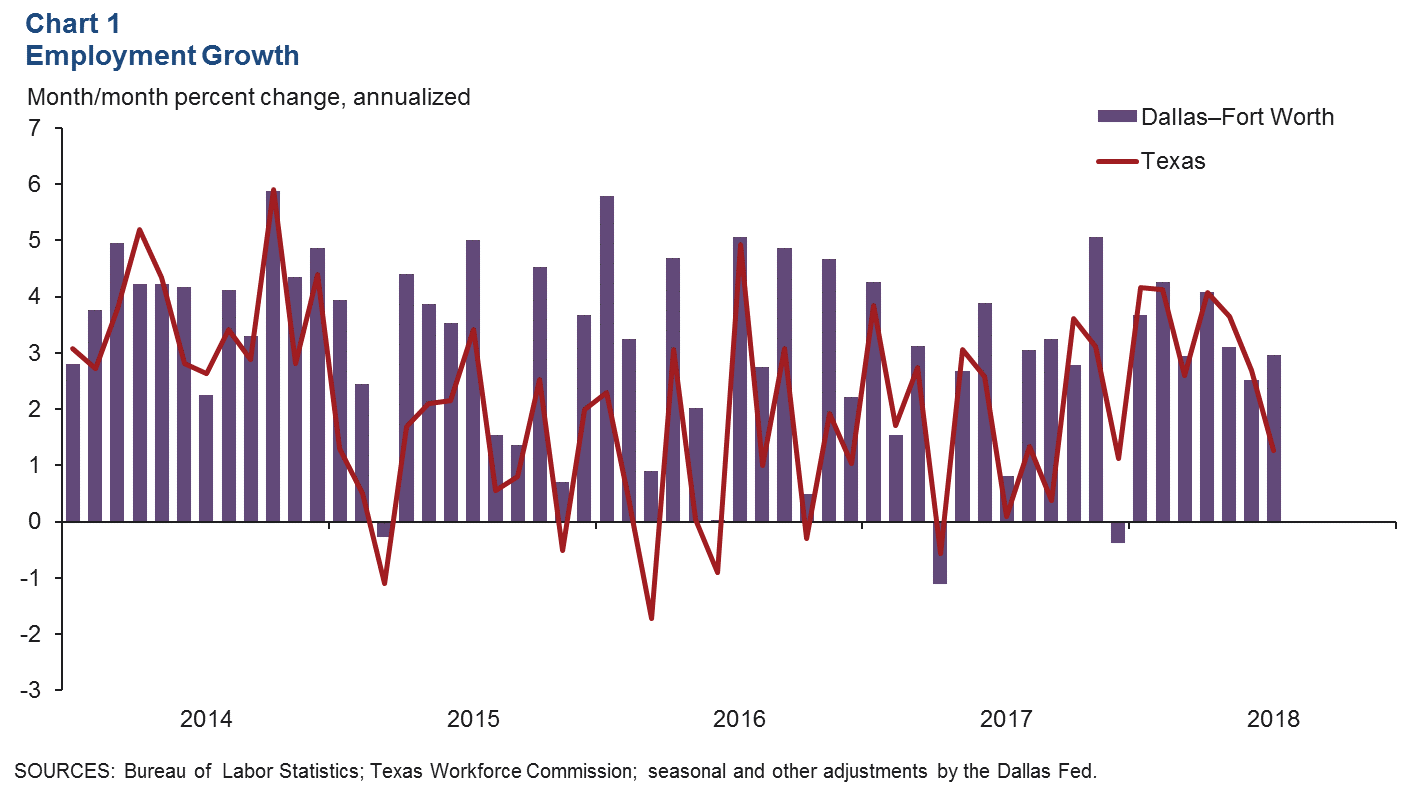
The jobless rate in Dallas and Fort Worth dipped to 3.4 percent in July, lows not seen consistently since the high-tech boom. Unemployment in both metros remains below the state and U.S. rates.
Expansion Is Broad Based
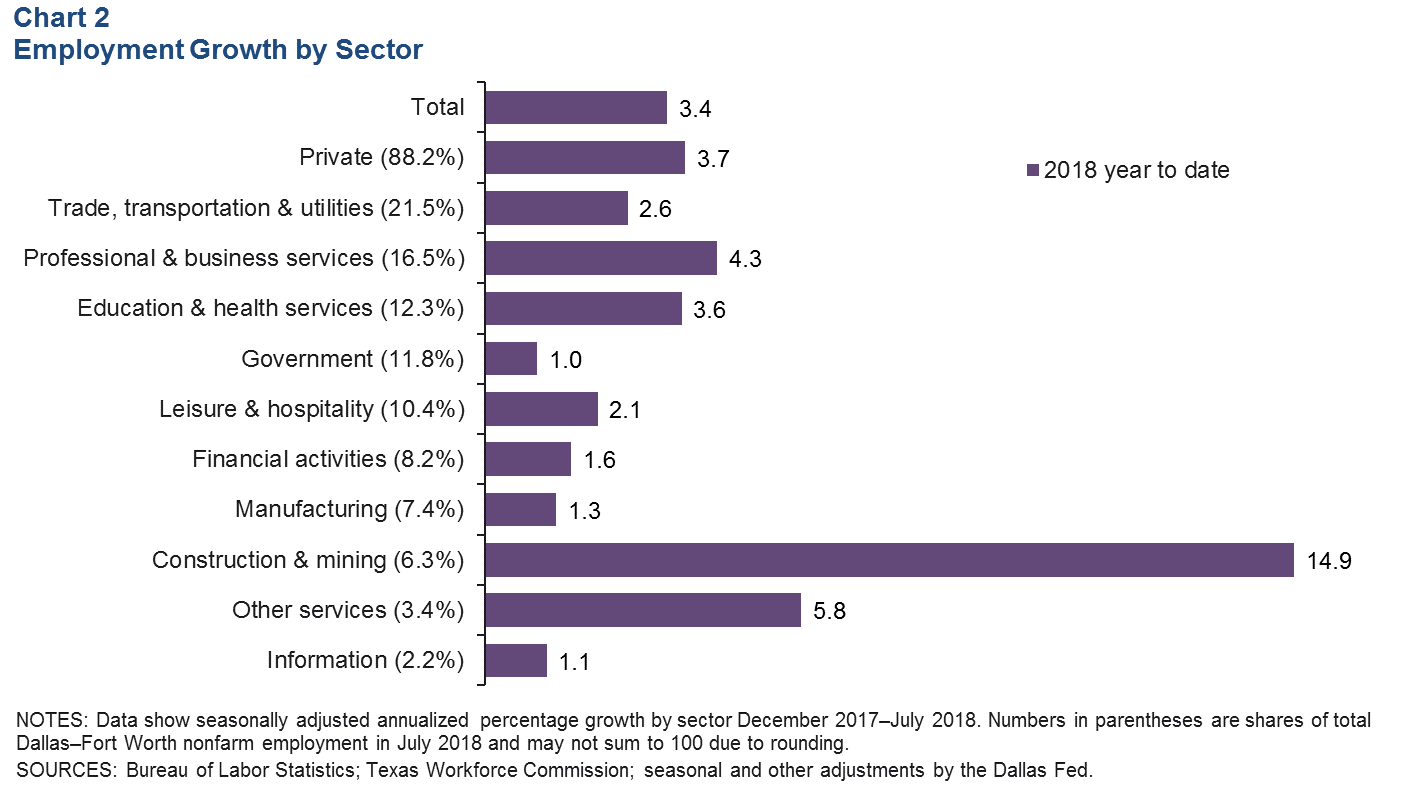
Employment gains have been widespread across sectors in 2018, with payrolls in construction and mining leading growth (Chart 2). Dallas serves as the business and financial services hub of the state, and professional and business services has seen the third-fastest rate of growth among the major sectors so far this year. Gains are also significant in the trade, transportation and utilities sector at about 12,000 jobs. All sectors have expanded their payrolls year to date; however, growth has softened noticeably in financial activities, leisure and hospitality, manufacturing and government compared with last year’s pace.
Business-Cycle Indexes
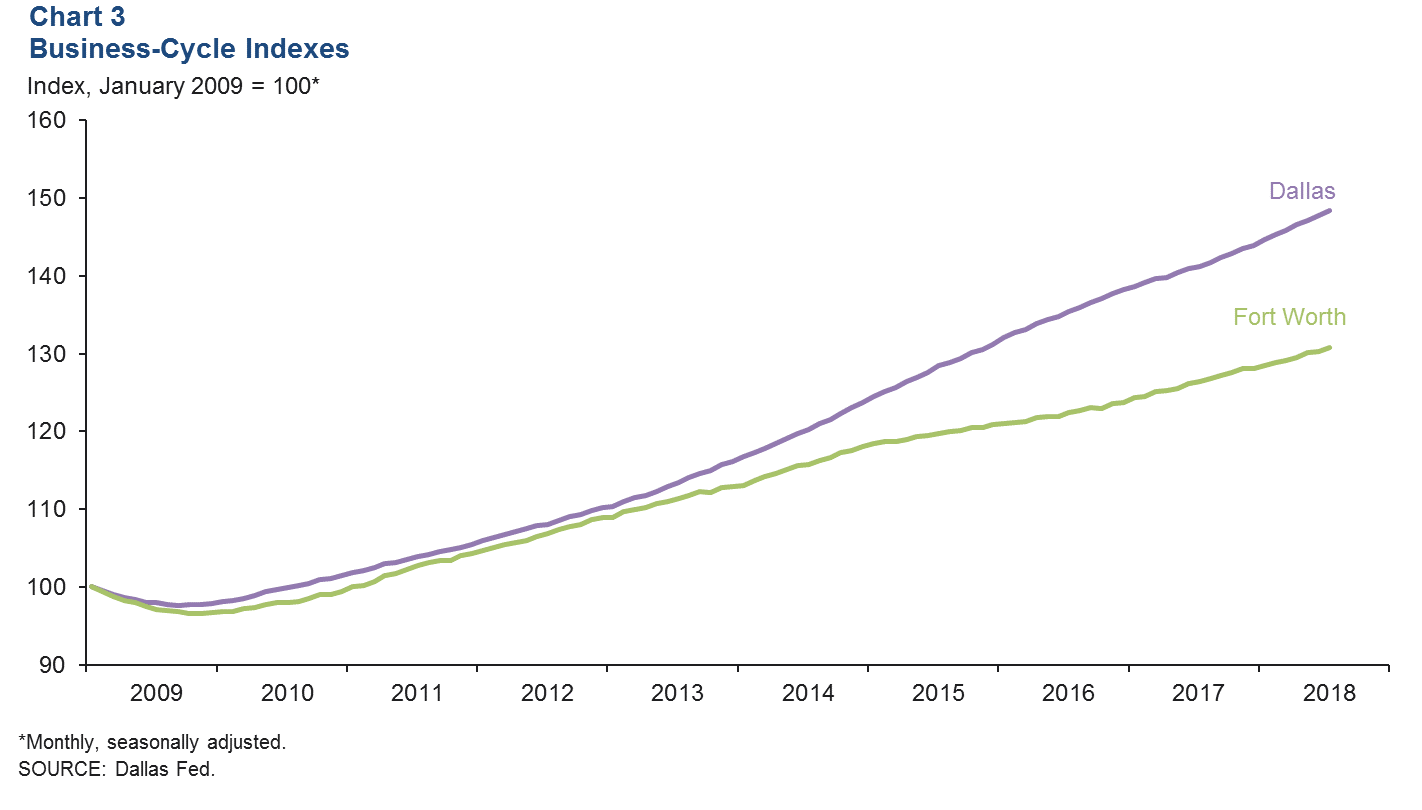
Growth in the Dallas and Fort Worth business-cycle indexes was strong in July, supported by solid job growth and low unemployment in the metroplex (Chart 3). The Dallas index expanded an annualized 5.2 percent in July, similar to June’s red-hot rate. Growth in the Fort Worth index accelerated to 4.3 percent in July from 1.8 percent in June. Expansion in both indexes was well above their long-term averages. Year over year in July, the Dallas index has risen 5.1 percent—the fastest growth among the major Texas metros—and the Fort Worth index was up 3.4 percent.
Construction and Real Estate
Home Price Increases Moderate
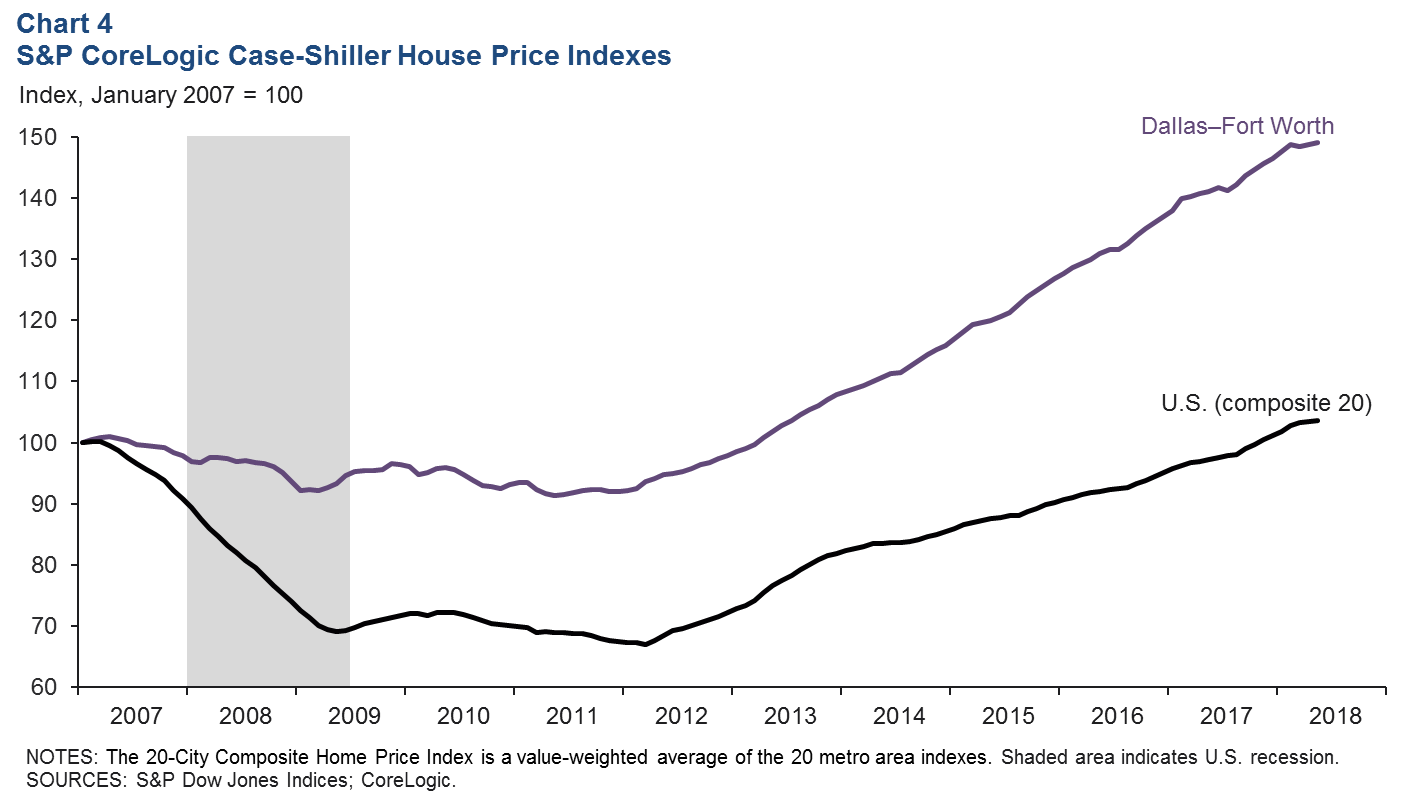
The pace of home price appreciation appears to be slowing in the metroplex. The S&P CoreLogic Case-Shiller Home Price Index for DFW ticked up an annualized 2.4 percent in May, just a hair below the 2.5 percent increase in the U.S. composite index, which covers 20 major metros (Chart 4). Year to date through May, prices in DFW are up an annualized 4.1 percent, slower than the nation’s 6.2 percent increase. In 2017, home prices jumped more rapidly in DFW at 6.9 percent than in the nation at 6.3 percent.
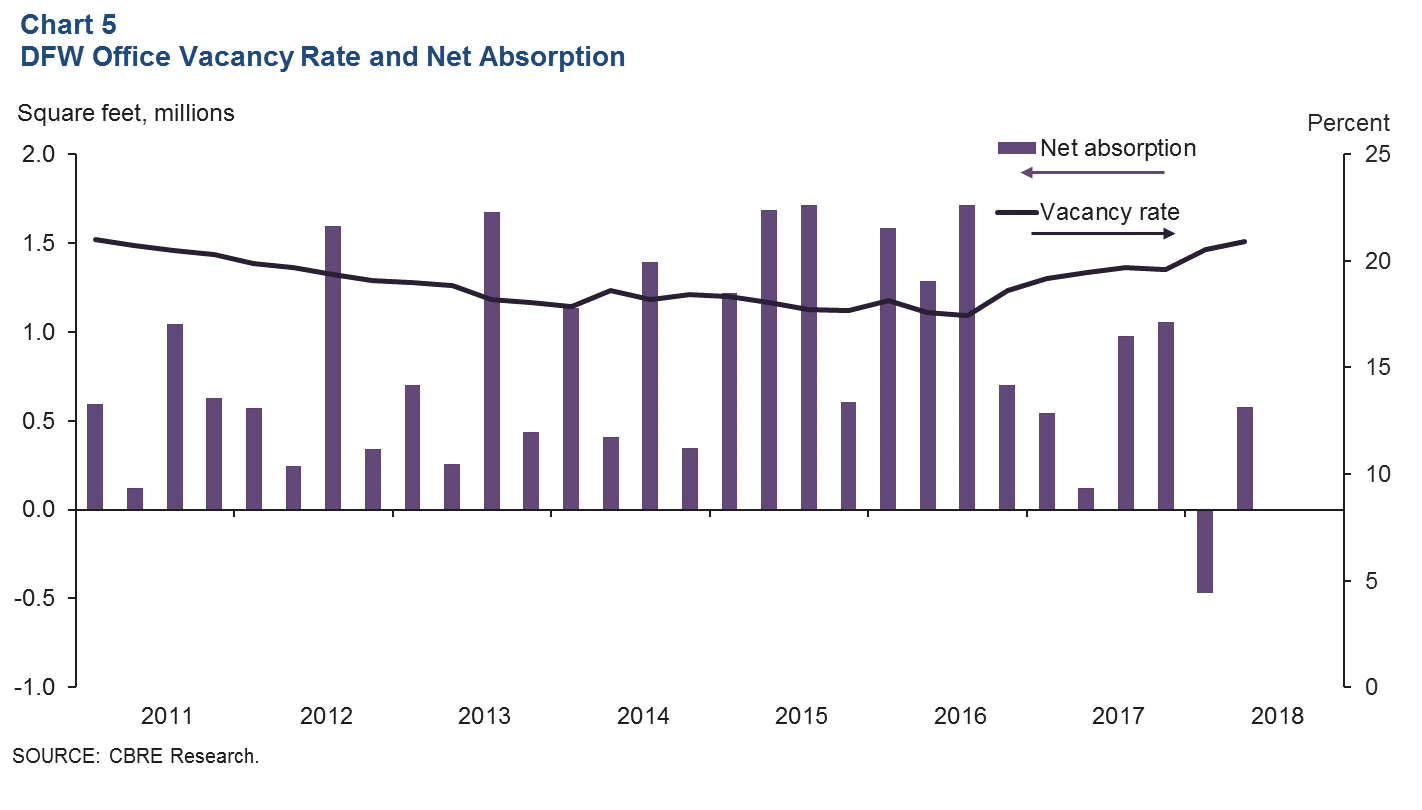
Office Demand Bounces Back
Demand for office space picked up in the second quarter, with net absorption totaling nearly 580,000 square feet after a decline in the first quarter, according to data from CBRE (Chart 5). Even with positive net absorption, vacancy ticked up to 20.9 percent due to new-speculative-space deliveries. Average asking rents edged up, and the construction pipeline remained full at 5.1 million square feet, with a large share of the space under construction being speculative.
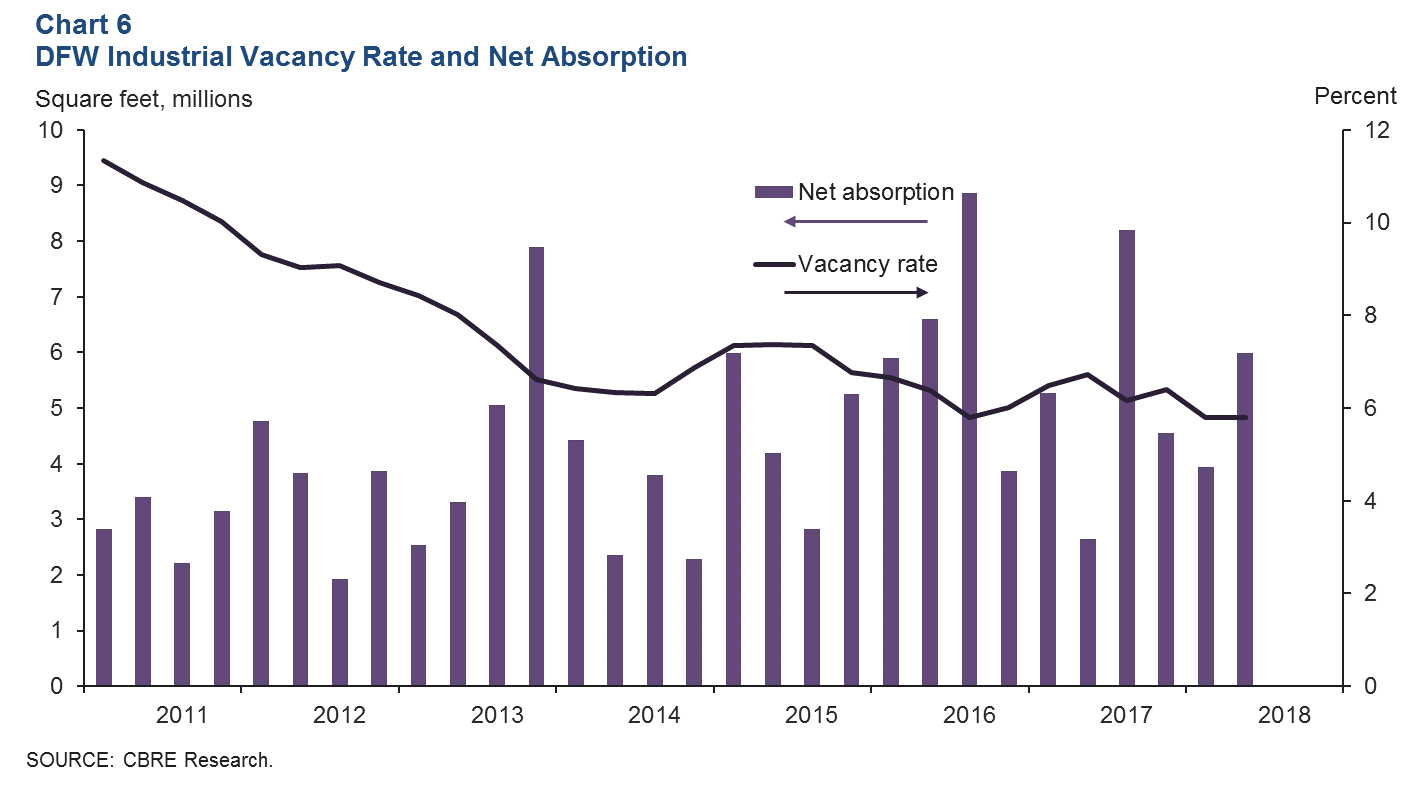
Industrial Demand Remains Healthy
Industrial leasing activity continued to be strong, with positive absorption and a tight vacancy, according to data from CBRE (Chart 6). Net absorption was nearly 6 million square feet in the second quarter, pushing up the first-half-of-the-year total close to 10 million square feet. The vacancy rate held steady at 5.8 percent—well below its postrecession average. Construction remained elevated, with the pipeline expanding to 22.3 million square feet in the second quarter. Since 2013, the metroplex has added over 100 million square feet of industrial space, according to CBRE.
NOTE: Data may not match previously published numbers due to revisions.
About Dallas–Fort Worth Economic Indicators
Questions can be addressed to Laila Assanie at laila.assanie@dal.frb.org. Dallas–Fort Worth Economic Indicators is published every month on the Tuesday after state and metro employment data are released.