Dallas-Fort Worth Economic Indicators

Dallas–Fort Worth economic growth moderated in September. Payroll employment expanded at a slower pace in the third quarter than the second. Unemployment held steady near record lows, and the Dallas and Fort Worth business-cycle indexes expanded further. Housing market indicators suggest a cooling in home price appreciation and sales; however, inventory still remains tight, particularly at the lower price points.
Labor Market
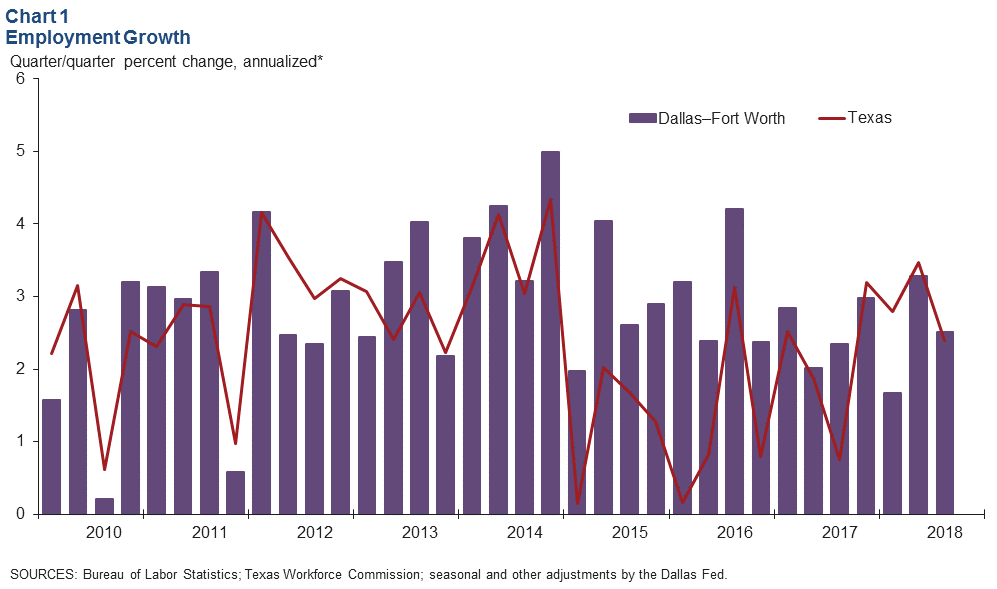
DFW payrolls grew an annualized 1.6 percent in September, with employment rising 1.9 percent in Dallas and 0.7 percent in Fort Worth. DFW jobs moderated to an annualized 2.5 percent pace in the third quarter following 3.3 percent growth in the second (Chart 1). Payrolls expanded by nearly 23,000 jobs in the third quarter, led by gains in professional and business services, which added about 7,600. Job growth accelerated in the financial activities, leisure and hospitality, and manufacturing sectors, while employment fell in the information services, education and health services, and other services sectors. Construction and mining employment was flat after expanding robustly in the first quarter.
The labor market remained tight, with the unemployment rate unchanged at 3.4 percent in September, below the U.S. and Texas rates.
Business-Cycle Indexes
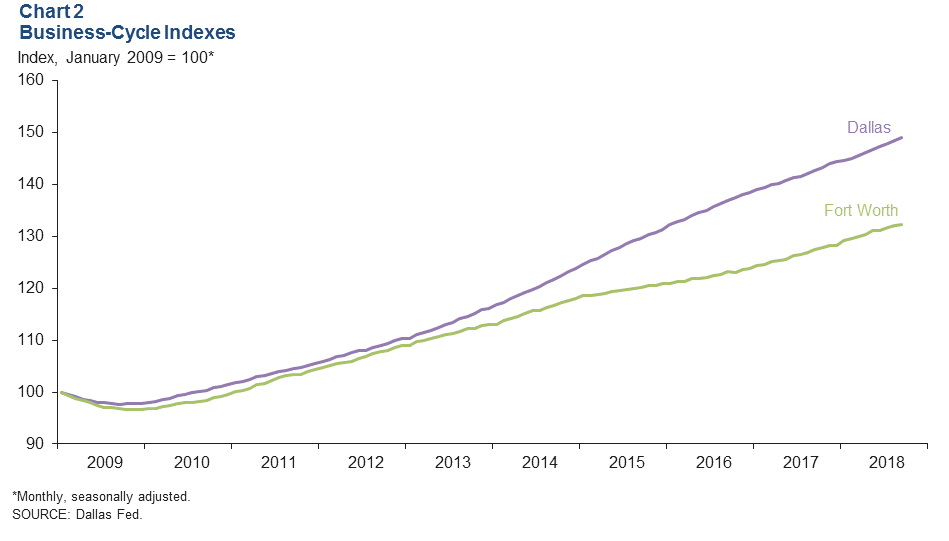
Growth in the Dallas and Fort Worth business-cycle indexes continued in September, supported by steady job growth and low unemployment (Chart 2). The Dallas index expanded an annualized 4.2 percent, close to August’s 4.8 percent red-hot rate. Growth in the Fort Worth index was 2.4 percent, slightly below its long-run average of 3 percent. Year over year in September, the Dallas index rose 4.4 percent and the Fort Worth index was up 3.9 percent.
Office Market
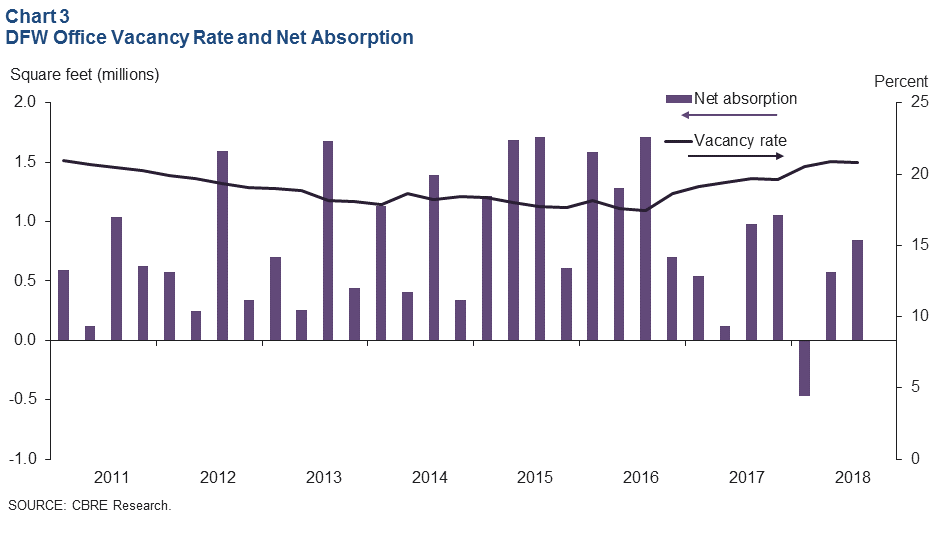
Demand for office space in the metroplex was steady in the third quarter, with net absorption of nearly 847,000 square feet, according to data from CBRE Research (Chart 3). Year-to-date net absorption totals of approximately 955,000 square feet are running below the average absorption seen over the past five years. Vacancy rates were essentially flat, and average asking rents edged up. The construction pipeline shrunk to 4 million square feet from 5.1 million in the second quarter.
Housing
Home Prices Decelerate
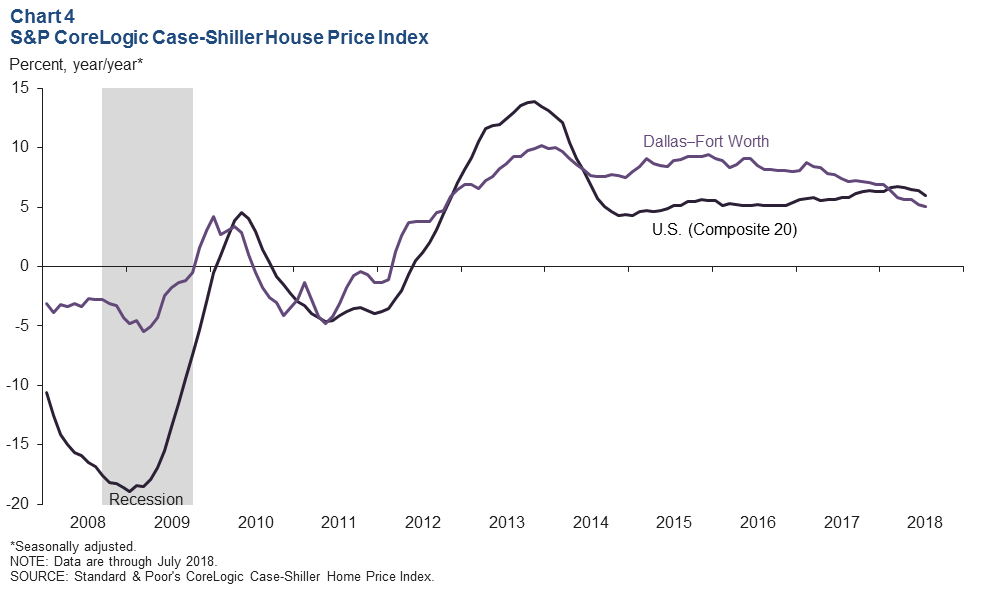
The pace of home price appreciation has cooled in the metroplex. The S&P CoreLogic Case-Shiller House Price Index, which tracks repeat sales, shows growth in DFW slipping below the U.S. rate (Chart 4). Year over year in July (the most recent data available), prices in DFW were up 5.1 percent, less than the nation’s 6 percent increase. In 2017, home prices jumped more in DFW at 6.9 percent than in the nation at 6.3 percent. Multiple Listing Service data also show deceleration in median home prices in the metroplex.
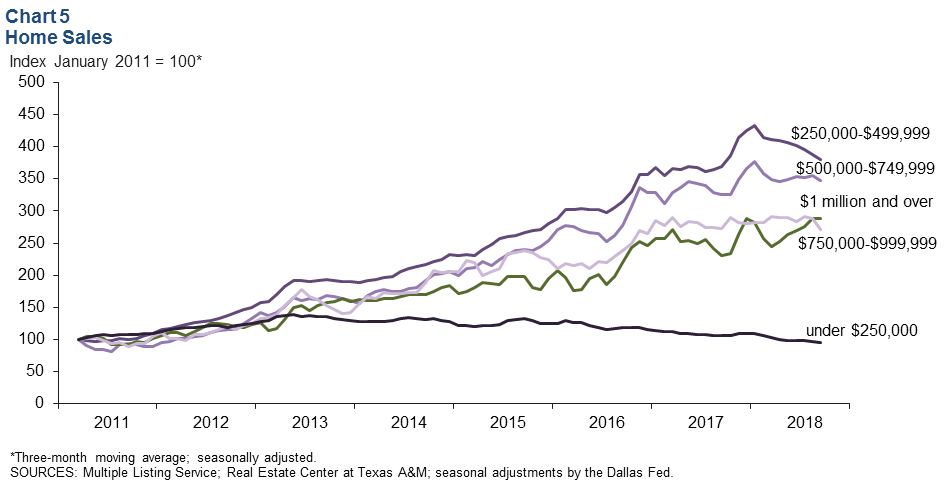
Home Sales Soften
DFW existing-home sales (seasonally adjusted) ticked up in September following declines in the previous two months. The three-month moving averages show broad-based declines in sales across various price categories (Chart 5). Through September, total home sales are trailing sales made over the same period in 2017. Sales of homes priced between $250,000 and $749,999 have softened in recent months after posting double-digit growth in 2012–17. Rising prices and higher interest rates are likely affecting affordability, and hence, sales activity. Sales of entry-level homes (those priced below $250,000) have been sliding since mid-2013 due to lack of inventory. Though starter homes still make up the bulk of DFW sales, the share has declined from 77 percent in 2011 to 45 percent year to date.
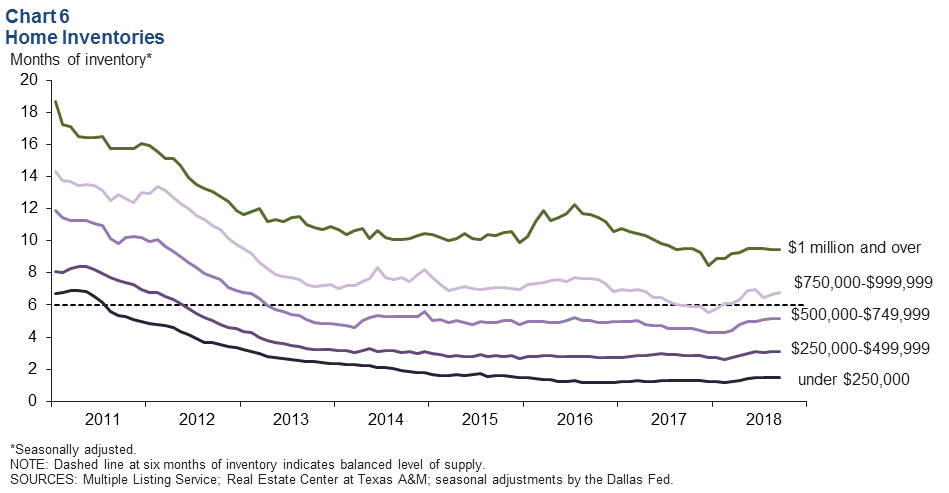
Inventories Tight at Lower End
DFW existing-home inventories remained tight and well below the six months’ supply typically associated with a balanced market. In September, overall inventories were at 2.8 months in Dallas and 2.3 months in Fort Worth. Inventories of entry-level homes were the tightest at 1.5 months of supply, a level that has changed little the past three years (Chart 6). Inventories of mid-priced homes ($250,000–$499,999) have been close to or under three months since late 2013.
NOTE: Data may not match previously published numbers due to revisions.
About Dallas–Fort Worth Economic Indicators
Questions can be addressed to Laila Assanie at laila.assanie@dal.frb.org. Dallas–Fort Worth Economic Indicators is published every month on the Tuesday after state and metro employment data are released.