Dallas-Fort Worth Economic Indicators

Growth in Dallas–Fort Worth remained widespread and brisk, with the metro area adding 9,500 jobs in October. Unemployment fell, and the Dallas and Fort Worth business-cycle indexes posted solid and above-trend growth. Housing affordability remained near record lows for Dallas and dipped in Fort Worth in the third quarter. Through September, growth in DFW housing permits was trailing the state's pace.
Labor Market
Solid Payroll Expansion Ongoing
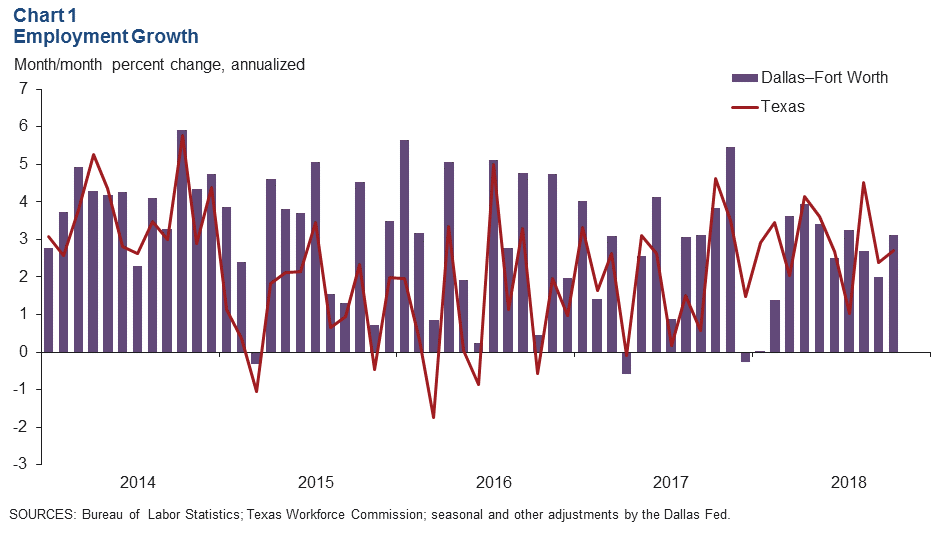
DFW payrolls grew by an annualized 3.1 percent (9,500 jobs) in October following gains of about 2 percent (6,100) in September (Chart 1). Expansion was generally broad based across sectors, with leisure and hospitality services leading growth and professional and business services seeing the largest gains. Employment in Dallas rose 2.9 percent (6,400 jobs), and Fort Worth saw 3.5 percent growth (3,100 jobs). DFW year-to-date employment growth of 2.6 percent (annualized) is similar to last year's 2.5 percent pace.
Unemployment Dips
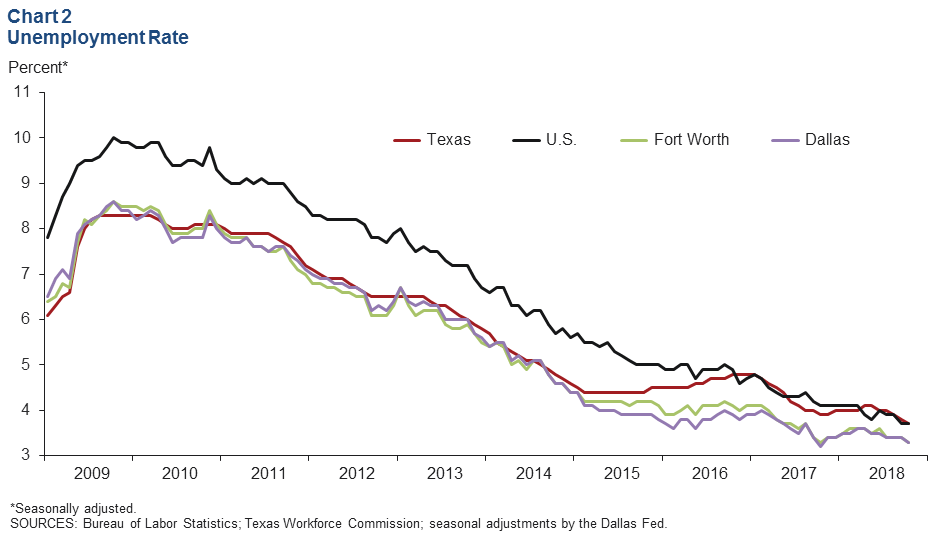
The DFW labor market remains extremely tight. The jobless rate for both Dallas and Fort Worth edged down to 3.3 percent in October, and business contacts continued to note labor shortages (Chart 2). Unemployment in both metros remains lower than the state and U.S. rates. Unemployment hit a new record low of 3.7 percent in Texas and held steady at a nearly five-decade low of 3.7 percent in the U.S.
Business-Cycle Indexes
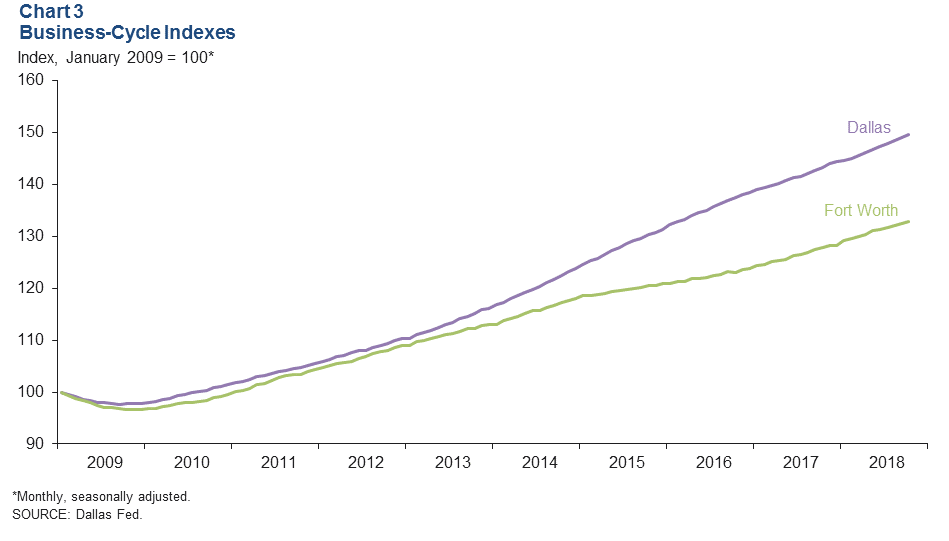
Growth in the Dallas and Fort Worth business-cycle indexes was above trend in October, supported by healthy job gains and low unemployment (Chart 3). The Dallas index expanded an annualized 5 percent, similar to September's 4.7 percent red-hot rate and faster than its trend growth of 3.7 percent. Growth in the Fort Worth index strengthened to 4.7 percent from 2.4 percent in September. Year over year in October, the Dallas index rose 4.4 percent, and the Fort Worth index was up 4 percent.
Housing and Construction
Single-Family Construction Rises
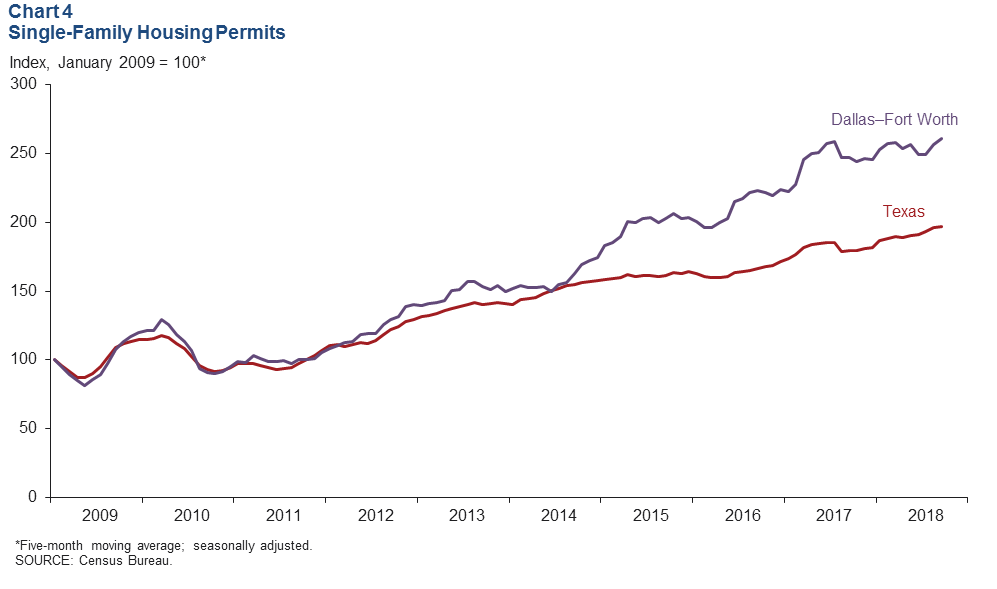
Homebuilding continues to expand in the metroplex, buoyed by housing demand. DFW single-family housing permits rose in September, and the five-month moving average also shows continued growth (Chart 4). Through September, total DFW single-family permits were up 3.8 percent compared with the same period last year, trailing Texas' 6.4 percent growth. Increases in DFW single-family permit issuance outpaced the state for three consecutive years from 2015 to 2017.
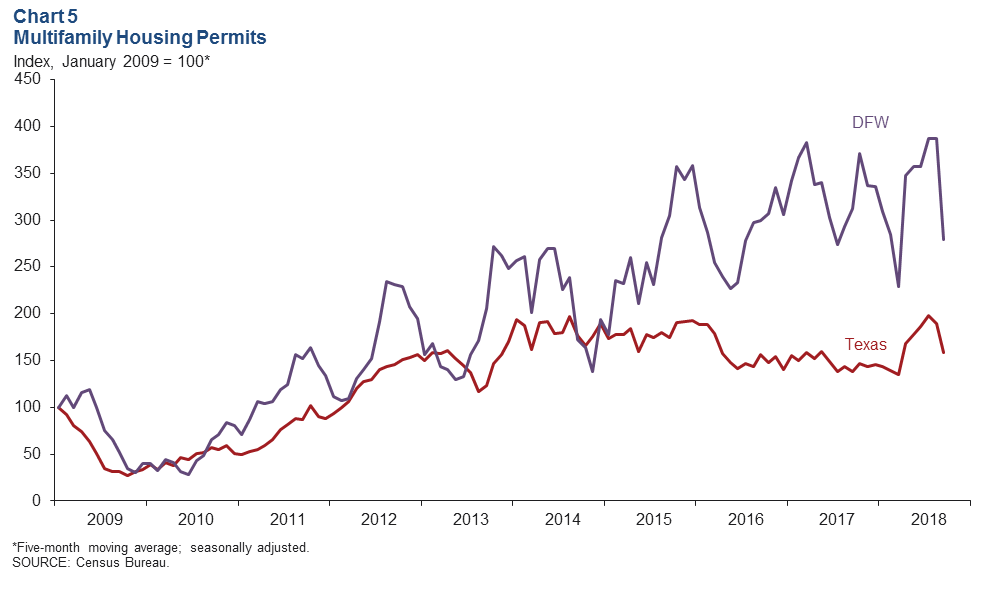
Multifamily Permit Issuance Falls
DFW multifamily permit issuance plunged in September following notable declines in the previous two months. The five-month moving average also shows permits plummeting in September from elevated levels (Chart 5). Total DFW multifamily housing permits issued through September were nearly on par (-0.9 percent) with the same period last year but markedly lagged the 13.7 percent increase for the state. Apartment construction has been active in this expansion cycle, and since 2010, DFW has added more than 100,000 units, according to data from RealPage Inc. While demand remains good, rent growth in Dallas has slowed and is below its long-run average.
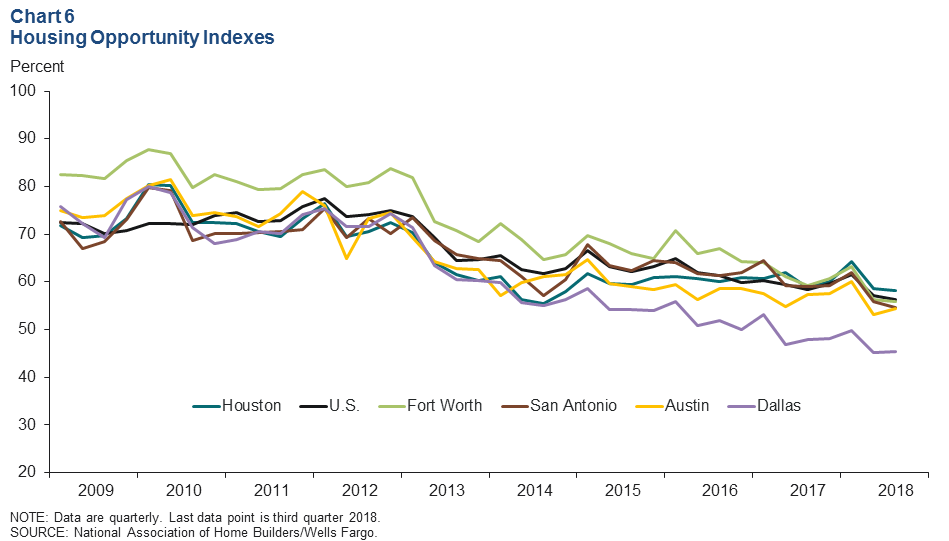
Housing Affordability in Dallas Stays Near Record Low
Housing affordability in Dallas remained close to historic lows in the third quarter, according to the National Association of Home Builders/Wells Fargo Housing Opportunity indexes. Only 45.5 percent of the homes (new and existing) sold in Dallas in the third quarter were affordable for a median-income family—little changed from 45.2 percent in the second quarter (Chart 6). This is well below the national figure of 56.4 percent. Housing affordability in Dallas is the lowest among major Texas metros, including Austin, which has a slightly higher median sales price; affordability in Dallas was 9 percentage points lower than Austin. Affordability in Fort Worth slipped to 55.8 percent in the third quarter but was similar to that of Austin at 54.5 percent and San Antonio at 54.7 percent.
NOTE: Data may not match previously published numbers due to revisions.
About Dallas–Fort Worth Economic Indicators
Questions can be addressed to Laila Assanie at laila.assanie@dal.frb.org. Dallas–Fort Worth Economic Indicators is published every month on the Tuesday after state and metro employment data are released.