Dallas-Fort Worth Economic Indicators

The Dallas–Fort Worth economy ended 2018 on a solid note. Employment growth was robust in December, with DFW adding jobs at its fastest pace in 13 months, and unemployment remained near multiyear lows. The Dallas and Fort Worth business-cycle indexes strengthened at year end, providing some momentum for continued growth in 2019. The DFW apartment market saw healthy absorption in 2018, but rent growth and construction activity moderated.
Labor Market
Job Growth Accelerates
DFW employment expanded an annualized 4.8 percent in December, and growth for November was revised up to 2 percent (Chart 1). Payrolls rose 3.6 percent (7,800 jobs) in Dallas and 8.1 percent (6,900 jobs) in Fort Worth.
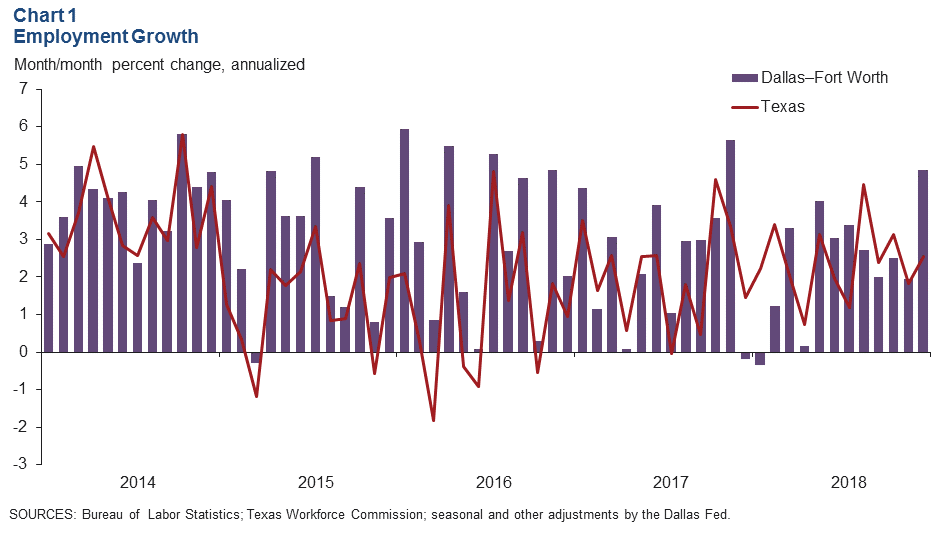
The labor market remained tight, with unemployment remaining close to multiyear lows. Unemployment in Dallas and Fort Worth edged up to 3.5 percent in December. The jobless rate was little changed last year and remained below the state and national figures.
Payroll Gains Broad Based
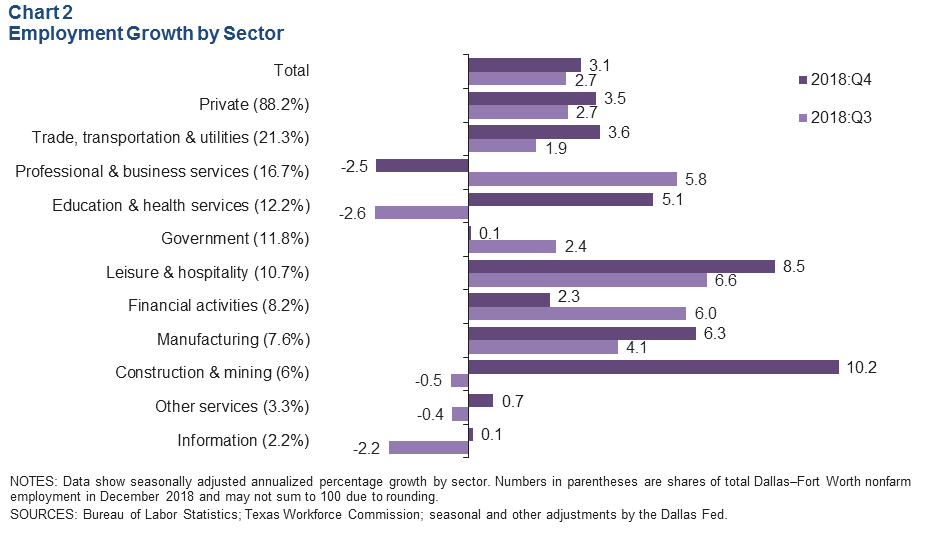
DFW employment growth was broad based and accelerated in the fourth quarter, with payrolls in a few sectors rebounding strongly after shedding jobs in the third quarter (Chart 2). Construction and mining payrolls posted the fastest growth among the major sectors in the fourth quarter. Job gains strengthened in the leisure and hospitality, manufacturing, and trade, transportation and utilities sectors, while employment in professional and business services, which had been expanding at a rapid clip earlier in the year, fell last quarter. Employment rose 2.4 percent in 2018, in line with the state’s increase.
Fort Worth Outperforms Dallas
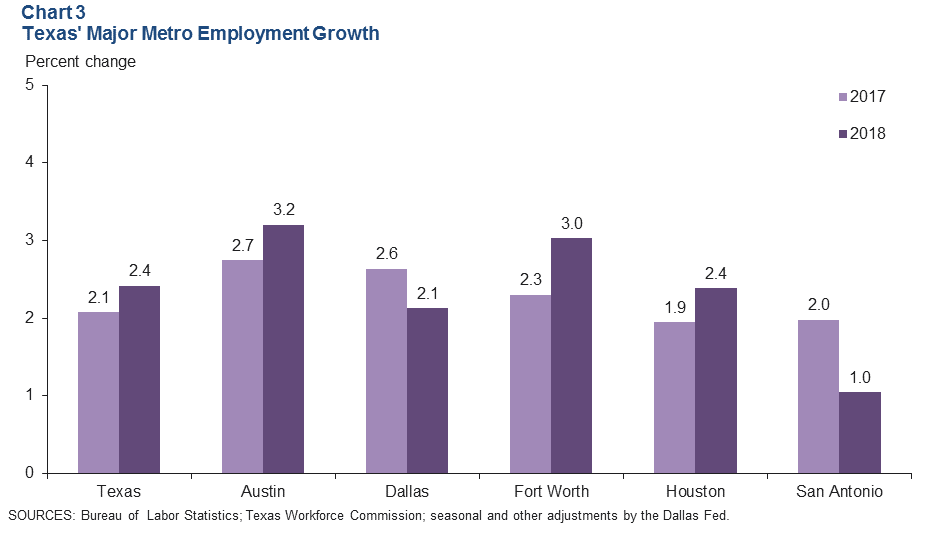
Payrolls in Fort Worth grew 3 percent in 2018, higher than Dallas’ 2.1 percent increase (Chart 3). This is a reversal from the trend seen in the previous five years, when employment expansion in Dallas outperformed that of Fort Worth. Last year’s growth was Dallas’ weakest performance since 2011, although the data are still subject to substantial revisions. Moreover, job growth in Dallas was slower than most other large Texas metros in 2018 and may have been limited by the metro’s tight labor market.
Business-Cycle Indexes
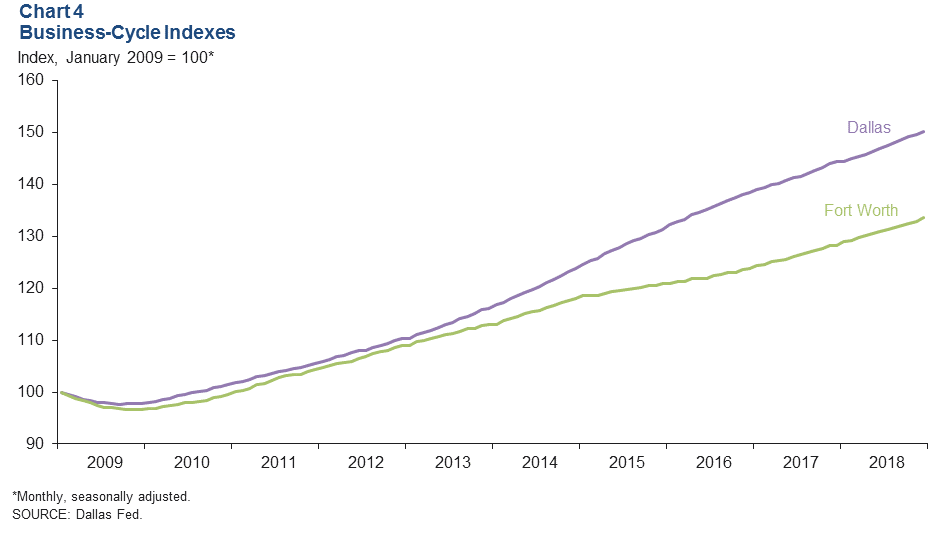
The Dallas and Fort Worth business-cycle indexes strengthened in December as job growth improved and unemployment stayed near multiyear lows (Chart 4). The Dallas index rose an annualized 5 percent in December, quicker than November’s 4.1 percent pace. Growth in the Fort Worth index accelerated to 7.5 percent in December following November’s 2.8 percent increase. In 2018, the Dallas and Fort Worth indexes expanded at a similar pace, 4.1 and 4.2 percent, respectively; growth in both indexes was above their long-run averages.
Multifamily Housing
Apartment Demand Solid in 2018
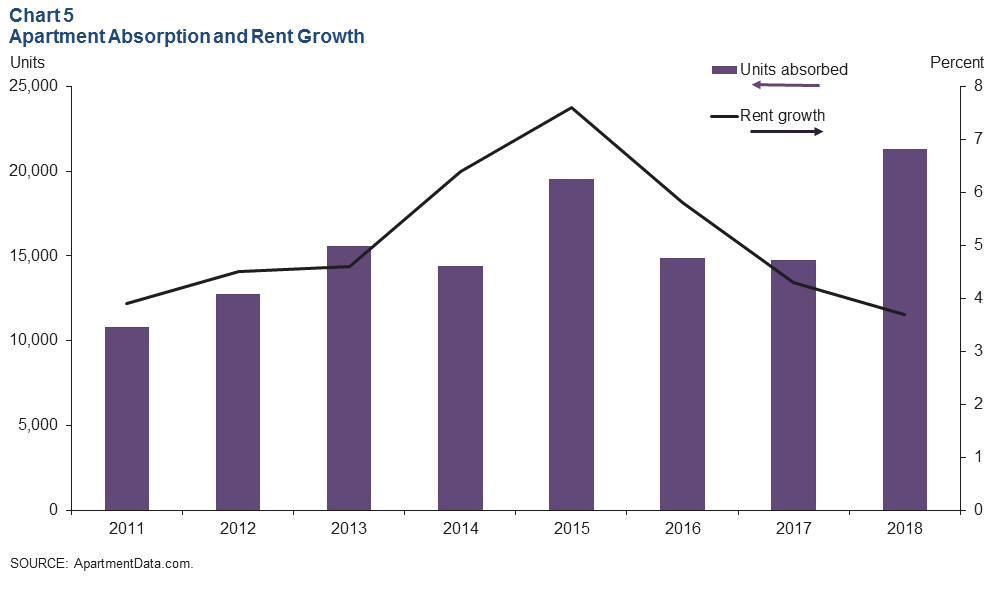
The DFW multifamily housing market expanded in 2018, thanks to the area’s thriving economy. Continued demand kept apartment occupancy healthy at 91.6 percent at year-end 2018, according to ApartmentData.com. DFW apartment absorption was solid last year—about 21,300 units—outpacing annual deliveries of 19,300 (Chart 5). Rent growth of 3.7 percent in 2018 was similar to San Antonio’s 3.8 percent gain but lagged Austin’s 6.7 percent increase. Apartment construction has been active in this expansion cycle, and from 2011 to 2018, DFW has added about 130,000 units, according to data from ApartmentData.com. Apartment construction in the metroplex remains elevated at about 28,000 units.
Multifamily Permit Issuance Remains Soft
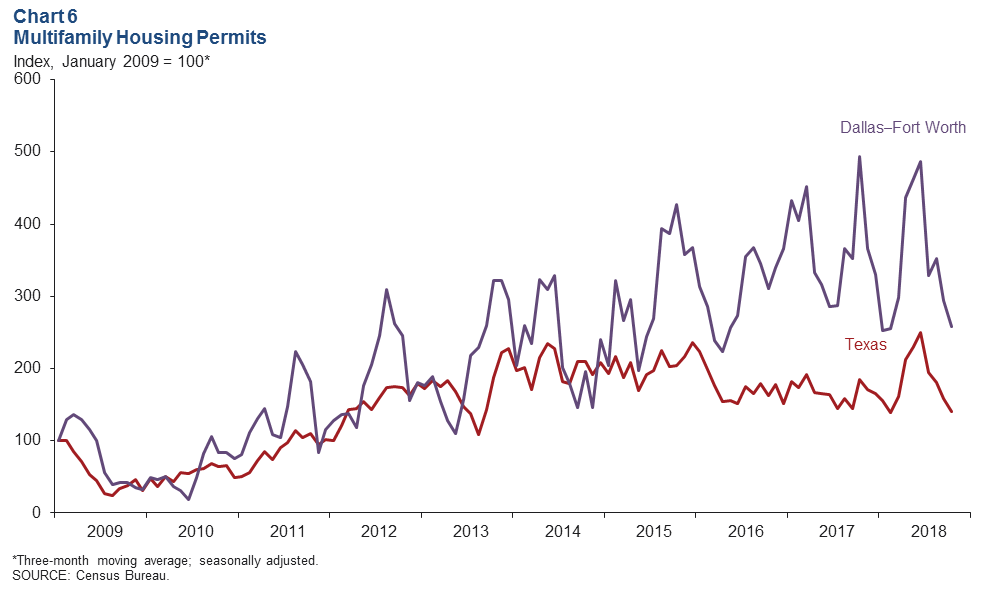
Multifamily permit issuance, which leads apartment construction, ticked up 1 percent in October after steep declines in the previous three months. The three-month moving averages show permits in DFW and Texas falling in the second half of 2018 after a steep climb in the first half (Chart 6). Despite the slowing, total Texas multifamily permits issued from January through October 2018 were up 6.4 percent compared with the same period in 2017, while total DFW multifamily permits were down 11.1 percent.
NOTE: Data may not match previously published numbers due to revisions.
About Dallas–Fort Worth Economic Indicators
Questions can be addressed to Laila Assanie at laila.assanie@dal.frb.org. Dallas–Fort Worth Economic Indicators is published every month on the Tuesday after state and metro employment data are released.