Dallas-Fort Worth Economic Indicators

Dallas–Fort Worth economic growth continued in April. Payroll employment rose in Dallas but contracted in Fort Worth. Unemployment fell to a 20-year low, and the Dallas and Fort Worth business-cycle indexes expanded further. Home sales rose in March, and inventories remained tight. Recently released data from the Census Bureau show that DFW ranked No. 1 among U.S. metros in net population increase in 2018.
Labor Market
Payroll Expansion Continues
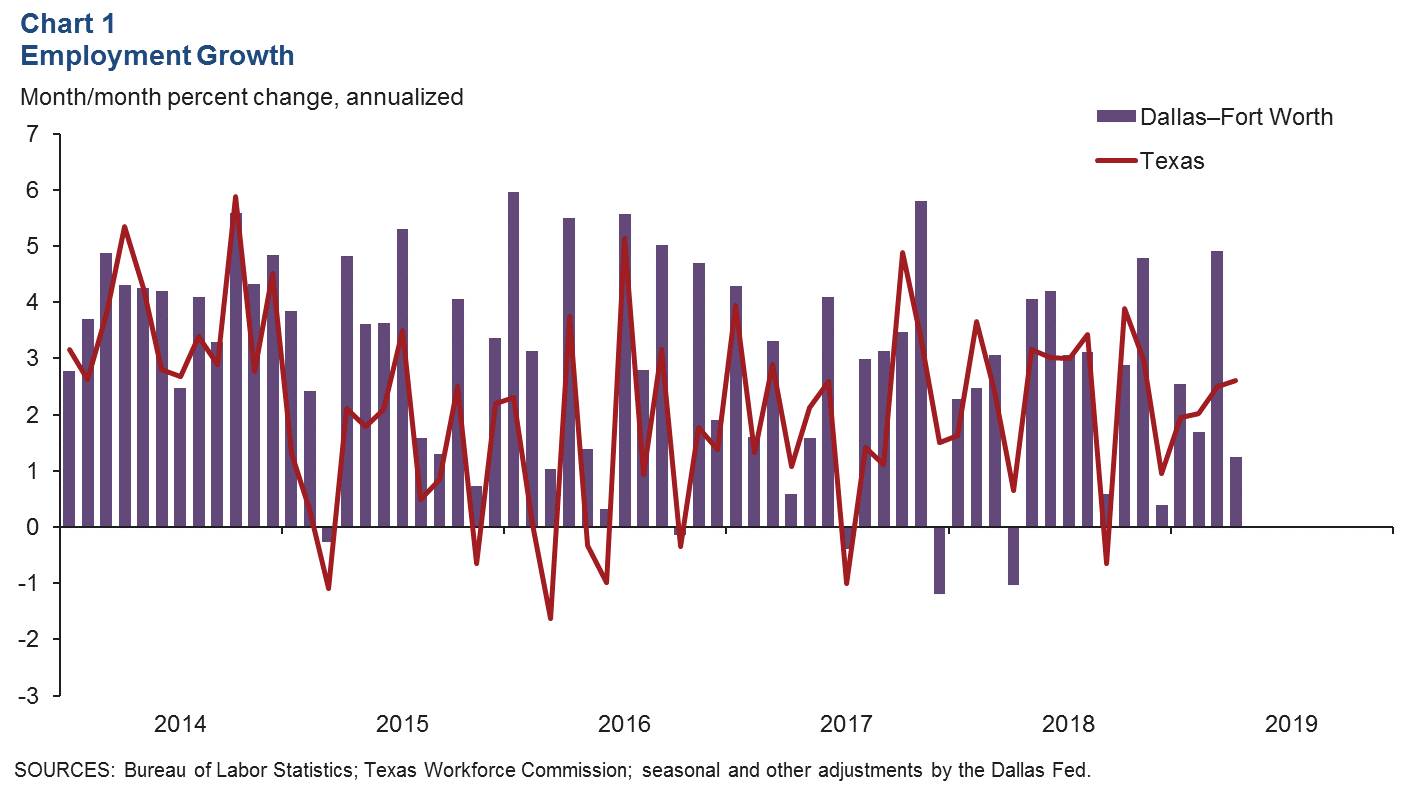
DFW employment rose an annualized 1.2 percent in April, and job growth in March was revised down to 4.9 percent (Chart 1). Payroll expansion remained vibrant in Dallas at 2.5 percent. Employment in Fort Worth contracted 1.8 percent in April, following robust growth in March. In the first four months of this year, Dallas added jobs at a 4.0 percent annual rate (34,600 jobs), while employment in Fort Worth edged down 0.8 percent (-2,800 jobs).
Unemployment Dips to Two-Decade Low
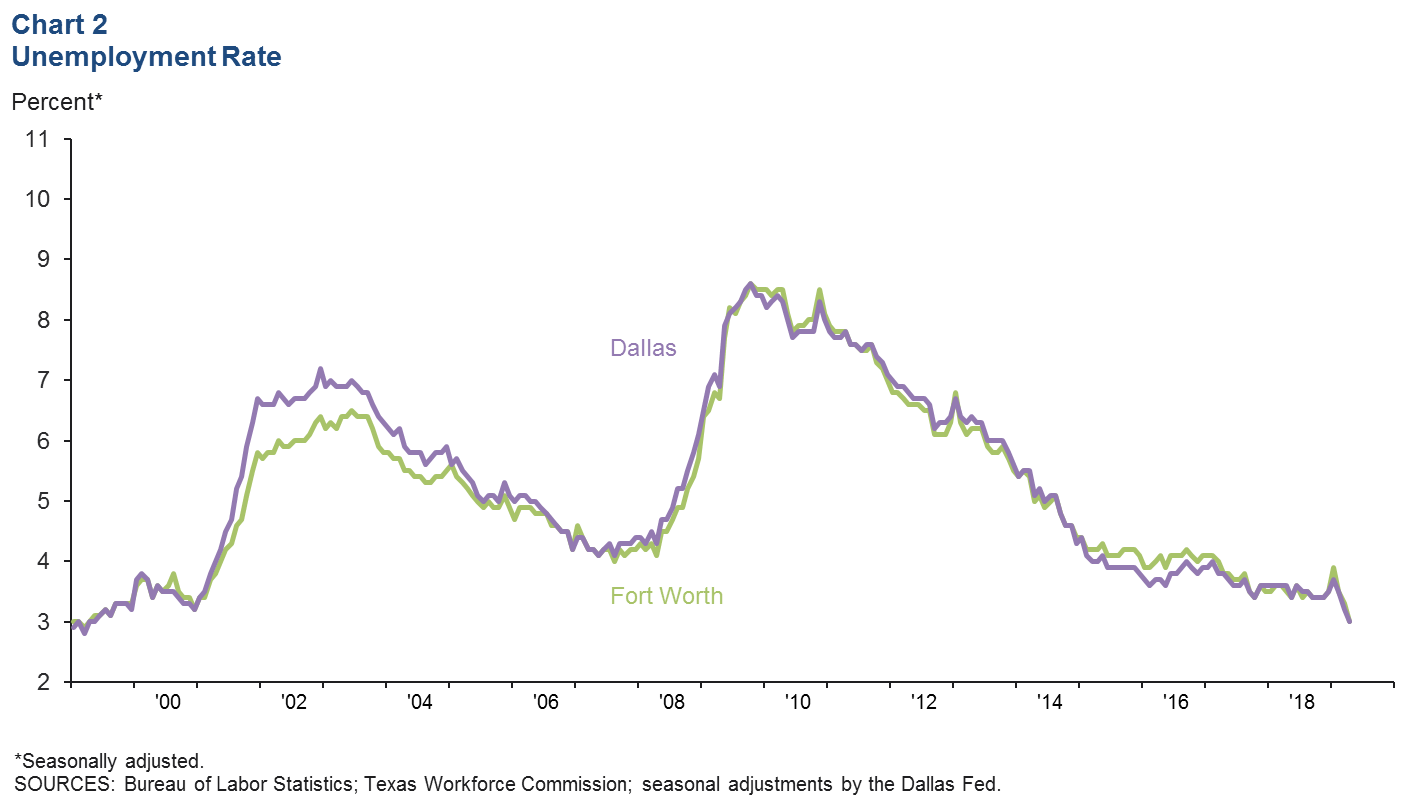
The labor market tightened further, with unemployment in Dallas and Fort Worth dropping to their lowest levels since spring 1999. The unemployment rate dipped to 3.0 percent in Dallas and in Fort Worth (Chart 2). Jobless rates in both metros remained below the state rate, which dropped to a record low of 3.7 percent last month. U.S. unemployment fell to a five-decade low of 3.6 percent.
Business-Cycle Indexes
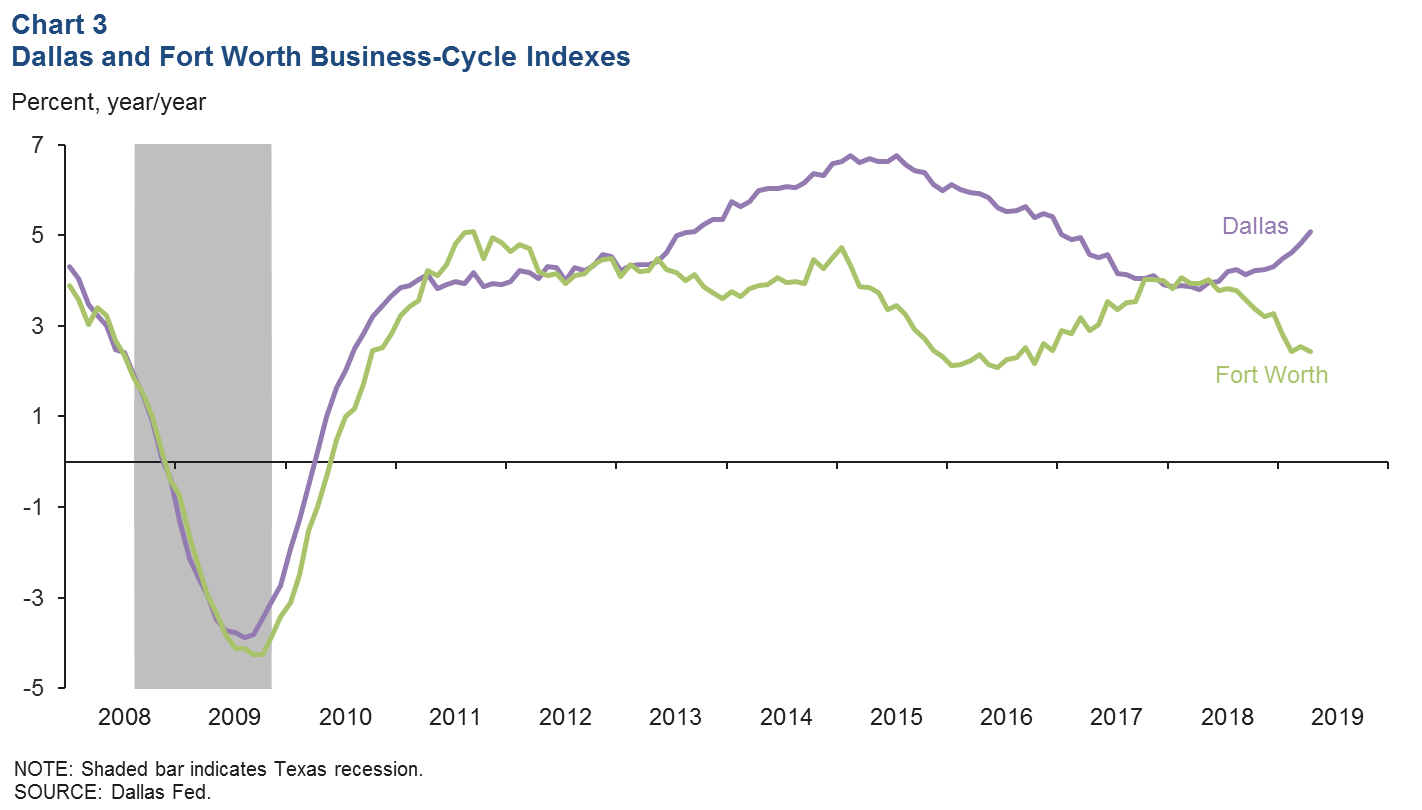
The Dallas and Fort Worth business-cycle indexes expanded in April (Chart 3). The Dallas index rose an annualized 5.2 percent in April, slightly slower than March’s 6.5 percent rate. The Fort Worth index was nearly flat in April at 0.3 percent after increasing strongly in March. After similar growth from late 2017 through mid-2018, growth in the two metropolitan divisions’ indexes has diverged again in part due to stronger job growth in Dallas.
Housing
Home Sales Rise Further
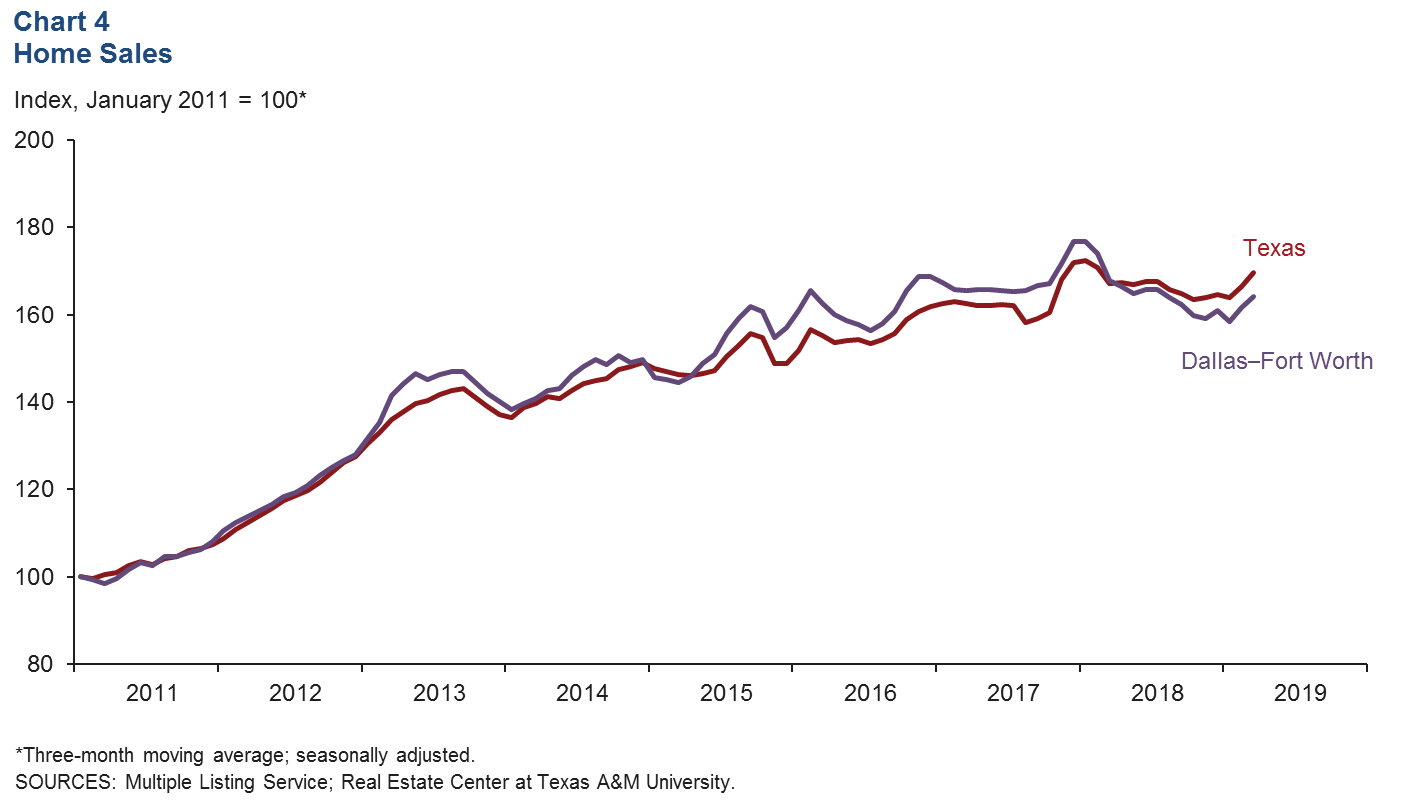
DFW existing-home sales climbed for the second straight month in March following sluggish activity at year-end 2018 (Chart 4). Business contacts responding to the April Dallas Beige Book also noted a pickup in foot traffic and new-home sales since the start of the year, relative to the end of 2018. Lower interest rates are likely boosting sales. Through March, total existing-home sales for the year are trailing sales over the same period in 2018.
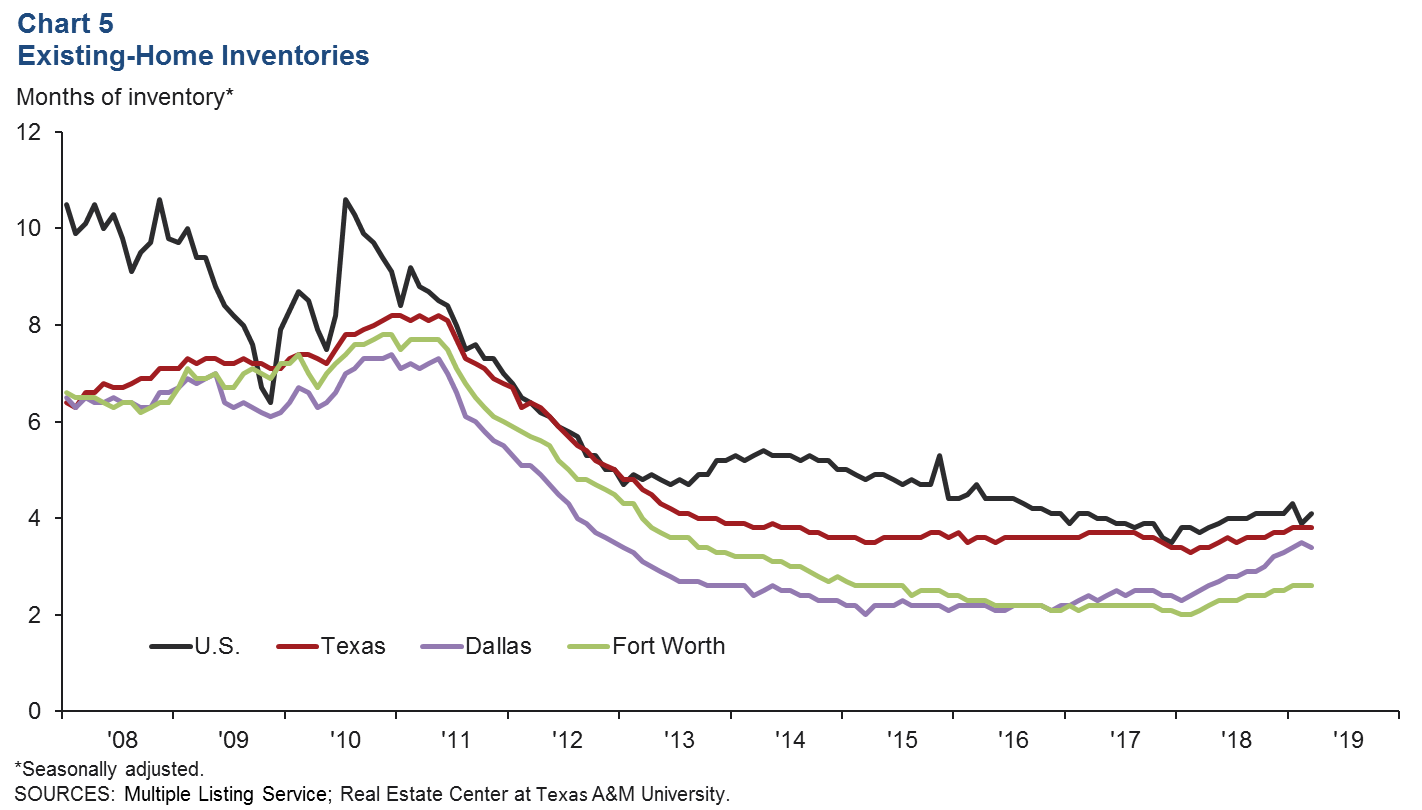
Home Inventories Remain Tight
DFW existing-home inventories remain tight and are well below the six months’ supply typically associated with a balanced market. In March, inventories were at 2.6 months in Fort Worth and 3.4 months in Dallas (Chart 5). Inventories in both Dallas and Fort Worth are lower than most Texas major metros except for Austin.
Population
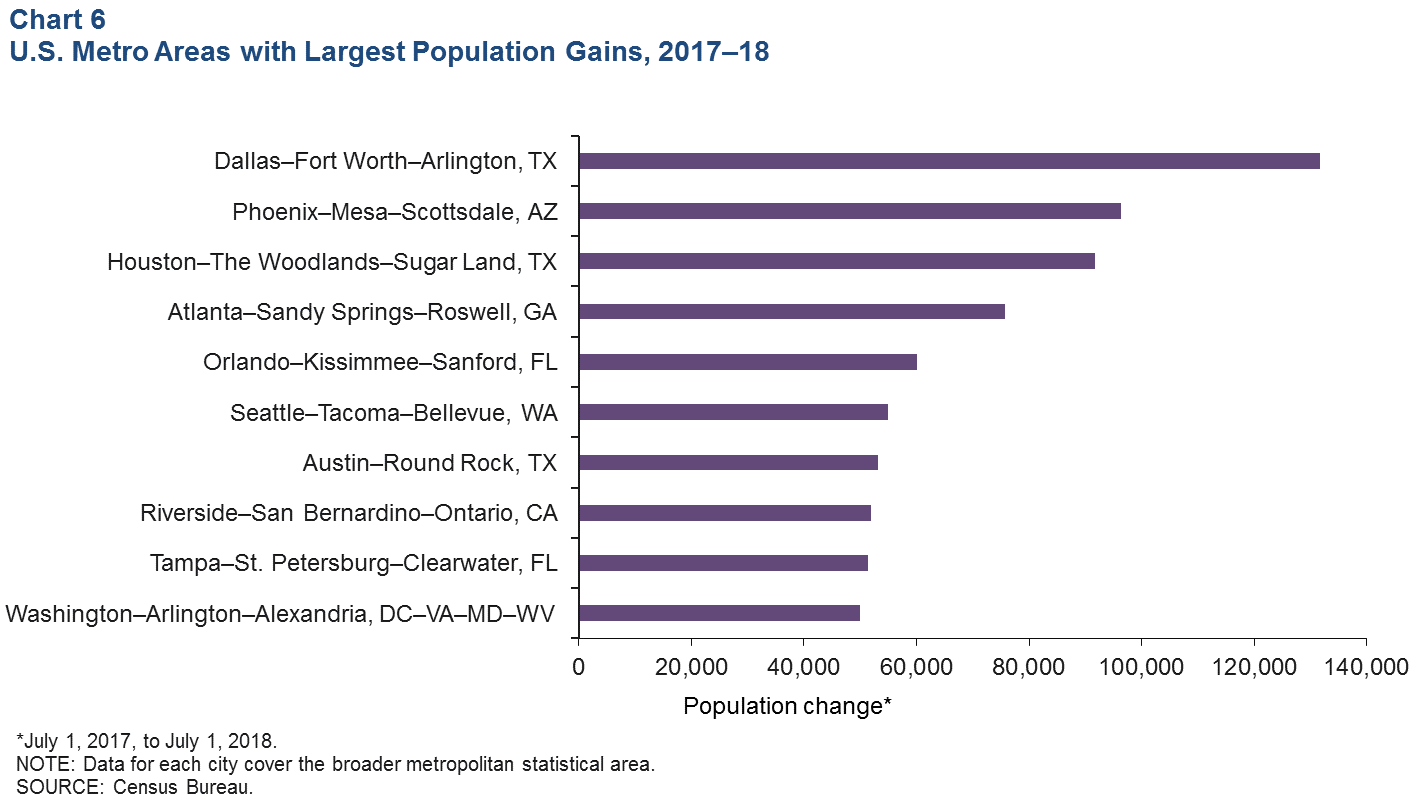
The DFW population continued to climb in 2018. Recently released census data show that from July 2017 to July 2018, the metroplex grew by over 131,000 people—the largest numerical increase among metro areas in the U.S. (Chart 6). DFW’s 1.8 percent gain was ahead of Texas’ 1.3 percent increase last year. Net domestic migration accounted for 34 percent of the growth in DFW’s population, meaning that approximately 205 people moved to DFW every day last year; international migrants made up 24 percent of that growth. Collin and Tarrant counties placed among the nation’s top 10 counties with the largest numerical increase, and Hood and Kaufman counties ranked among the nation’s top 10 fastest growing. DFW is the fourth-largest metropolitan statistical area in the U.S., with a population of 7.5 million in 2018. Since 2010, DFW has added 1.1 million residents—ranking No.1 in the nation in numeric increase.
NOTE: Data may not match previously published numbers due to revisions.
About Dallas–Fort Worth Economic Indicators
Questions can be addressed to Laila Assanie at laila.assanie@dal.frb.org. Dallas–Fort Worth Economic Indicators is published every month on the Tuesday after state and metro employment data are released.