Dallas-Fort Worth Economic Indicators

Dallas–Fort Worth’s economic expansion moderated in September. Payroll gains came in below the metro’s long-term average rate after spiking in the summer. Unemployment dipped, further tightening the labor market. The Dallas and Fort Worth business-cycle indexes expanded. Leasing activity remained solid in the office and industrial markets, with net absorption staying positive and vacancy rates trending downward.
Labor Market
Payroll Expansion Continues
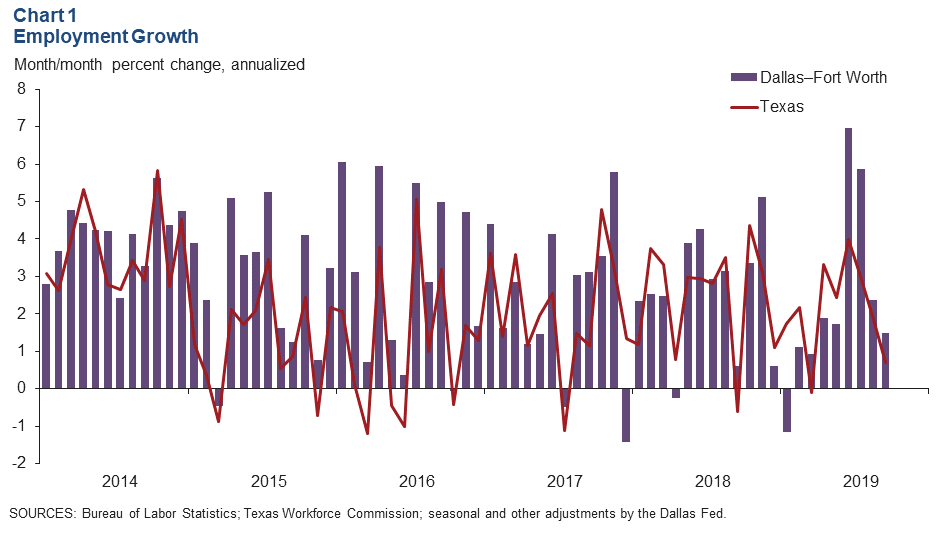
DFW employment rose an annualized 1.5 percent in September, cooling down from the strong growth in summer (Chart 1). Payroll expansion slowed to 1.2 percent in Dallas, while employment grew 2.2 percent in Fort Worth after declining in August. Through September, Dallas has added jobs at a 2.3 percent annual rate, and Fort Worth employment has grown 2.4 percent.
Third-Quarter Job Gains Broad Based
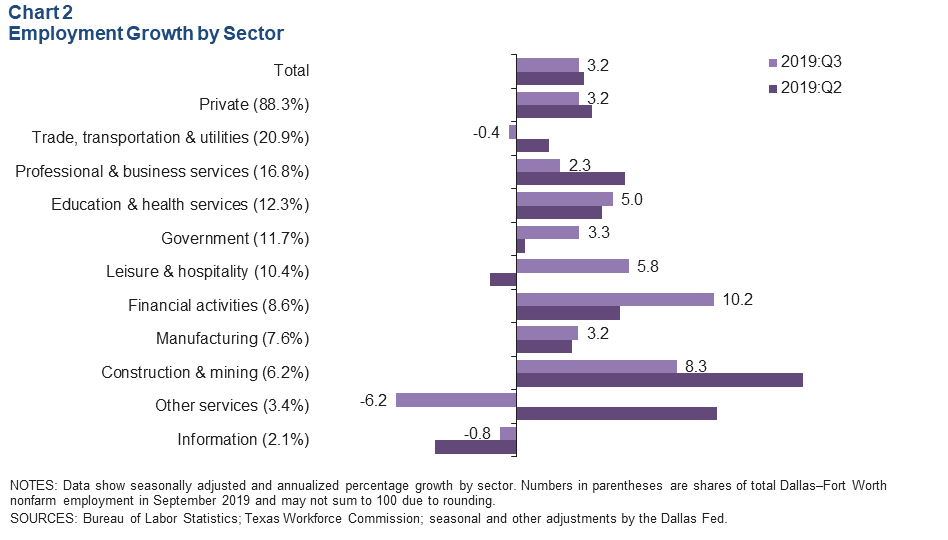
Jobs in DFW grew at a 3.2 percent annualized rate in the third quarter—similar to the second quarter’s 3.5 percent rate (Chart 2). Growth was mixed, with payrolls in the goods-producing sector up an annualized 5.4 percent. Expansion among service-providing industries was led by a surge in financial activities employment. Hiring in leisure and hospitality rebounded, and construction was particularly strong in Dallas. Job growth accelerated in government but held steady in manufacturing and in education and health care. Information and other services employment contracted over the quarter, partly due to large declines in Dallas. Payrolls in the metro’s largest sector—trade, transportation and utilities—dipped in the quarter.
Unemployment Ticks Down
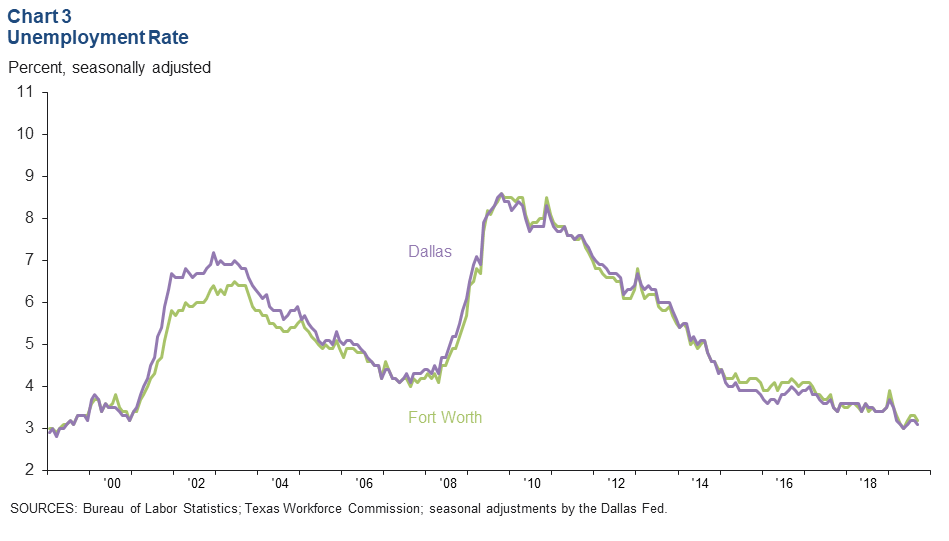
The labor market tightened further, with unemployment in Dallas and Fort Worth close to multiyear lows in September. The unemployment rate fell to 3.1 percent in Dallas and 3.2 percent in Fort Worth (Chart 3). Jobless rates in both metros remained below the state rate, which held steady at 3.4 percent. U.S. unemployment fell to a five-decade low of 3.5 percent.
Business-Cycle Indexes
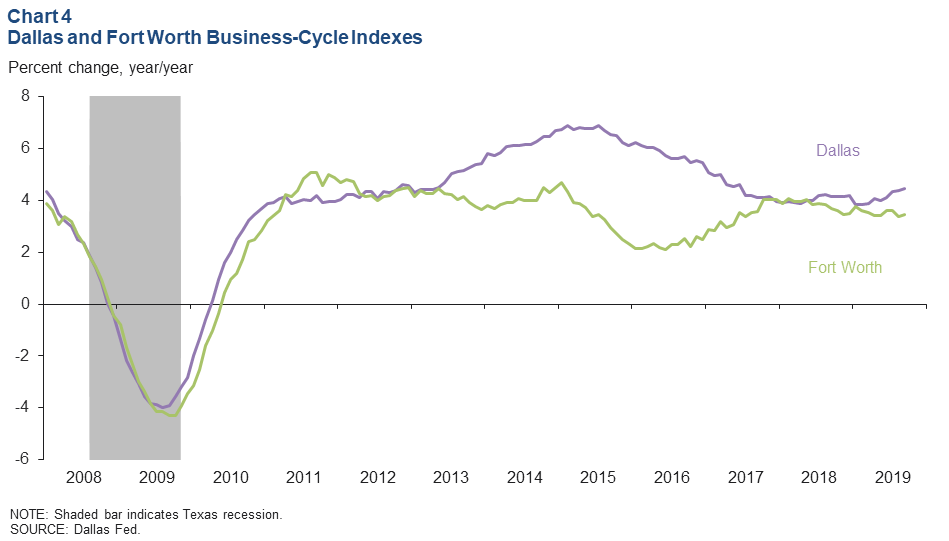
Expansion in the Dallas and Fort Worth business-cycle indexes continued in September, supported by persistent job growth (Chart 4). The Dallas index rose an annualized 4.5 percent, slower than August’s 5.5 percent rate. The Fort Worth index rose 3.9 percent following August growth of 1.3 percent. Year over year in September, both indexes expanded at the above-average pace of 4.5 percent for Dallas and 3.5 percent for Fort Worth.
Commercial Real Estate
Office Demand Steady
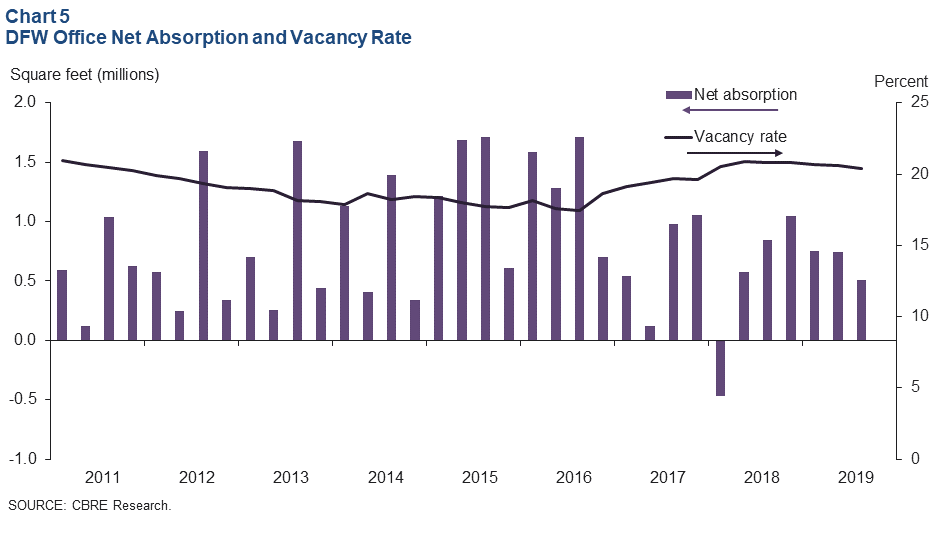
Demand for office space in the DFW market was stable in the third quarter. Net absorption was half a million square feet, slightly less than the average for the first half of the year, and the vacancy rate ticked down to 20.4 percent, according to data from CBRE Research (Chart 5). Demand continued to be driven by Class A space, and average asking rents rose in the quarter. The construction pipeline grew in the third quarter to 5.4 million square feet from 4.4 million in the second.
Industrial Leasing Accelerates
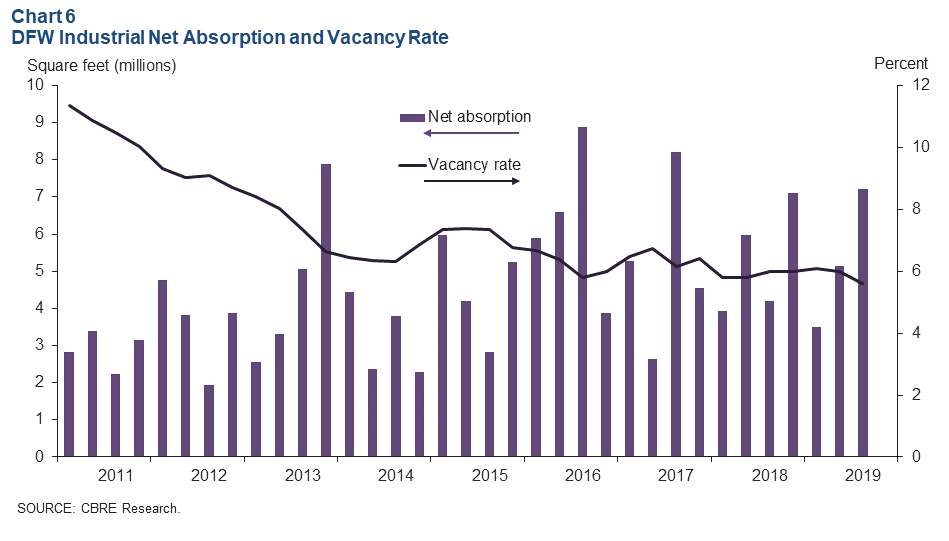
Leasing activity picked up for industrial space in the third quarter, driven by demand from consumer goods, e-commerce and third-party logistics firms, according to CBRE. Net absorption was 7.2 million square feet, pushing the total for the first nine months to 15.9 million square feet (Chart 6). The vacancy rate continued to trend downward to 5.6 percent, remaining well below its historical average. Construction stayed elevated, with the construction pipeline growing to 27.5 million square feet, of which 29 percent was preleased.
NOTE: Data may not match previously published numbers due to revisions.
About Dallas–Fort Worth Economic Indicators
Questions can be addressed to Laila Assanie at laila.assanie@dal.frb.org. Dallas–Fort Worth Economic Indicators is published every month on the Tuesday after state and metro employment data are released.