Dallas-Fort Worth Economic Indicators

January 30, 2020
Dallas–Fort Worth economic growth remained solid in December. Payroll employment grew at a rapid clip, and unemployment stayed low. The Dallas and Fort Worth business-cycle indexes expanded further. Apartment leasing and construction continued to be active. Demand for office and industrial space remained strong, with net absorption accelerating in fourth quarter 2019.
Labor Market
Payrolls Expansion Continues
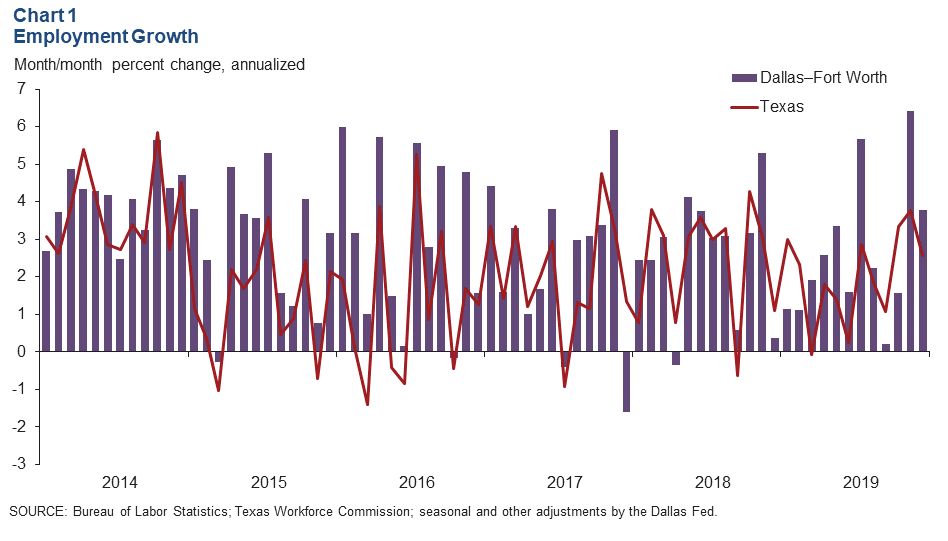
DFW employment rose an annualized 3.8 percent in December, down from 6.4 percent in November (Chart 1). Payroll expansion was 6.2 percent in Dallas, while employment contracted 2.1 percent in Fort Worth. DFW added 97,500 jobs, or a 2.6 percent increase in 2019, outpacing its long-run average. Unemployment in Dallas and Fort Worth dipped to 3.1 percent and 3.2 percent, respectively.
Employment Gains Brisk and Broad Based
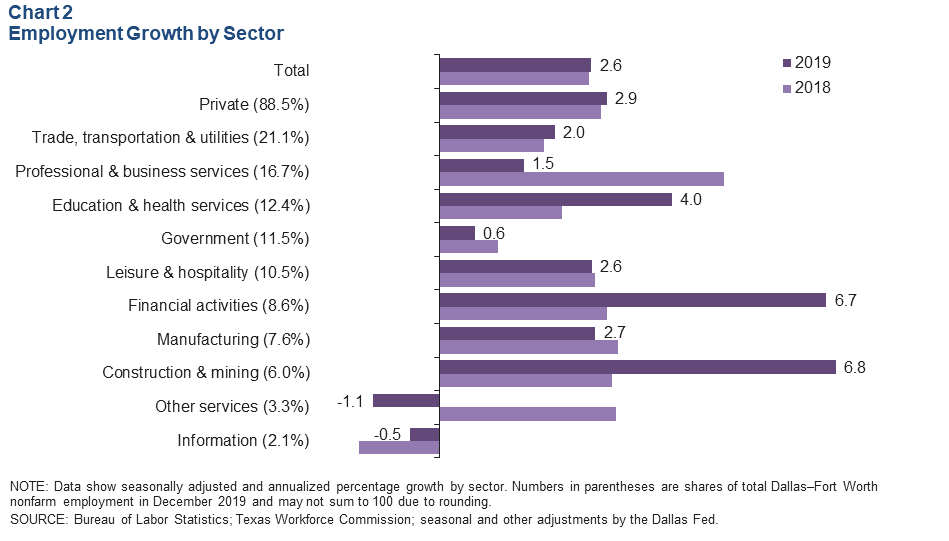
Employment growth was mostly broad based in 2019, with payrolls in the goods-producing sector expanding strongly at 4.5 percent. Expansion among goods-producing industries was led by a surge in construction and mining employment (Chart 2). Among the service-providing industries, job gains strengthened in the financial activities and education and health services sectors. Employment growth was solid in trade, transportation and utilities, and leisure and hospitality, while job growth in professional and business services—the metro’s second-largest sector—was moderate. Only employment in information and other services contracted during the year.
Business-Cycle Indexes
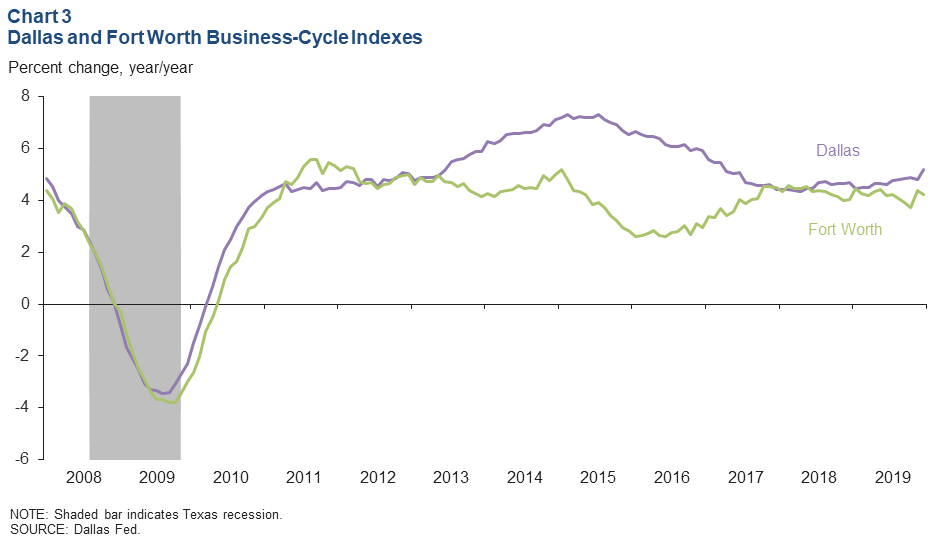
Expansion in the Dallas and Fort Worth business-cycle indexes continued in December, supported in part by strong job growth. The Dallas index rose an annualized 7.2 percent, higher than November’s rate. Growth in the Fort Worth index was weak at 0.6 percent. Year over year in December, the Dallas index rose 5.2 percent, and the Fort Worth index was up 4.2 percent; growth in both indexes was a percentage point higher than its long-term average (Chart 3).
Real Estate
Apartment Demand Stable
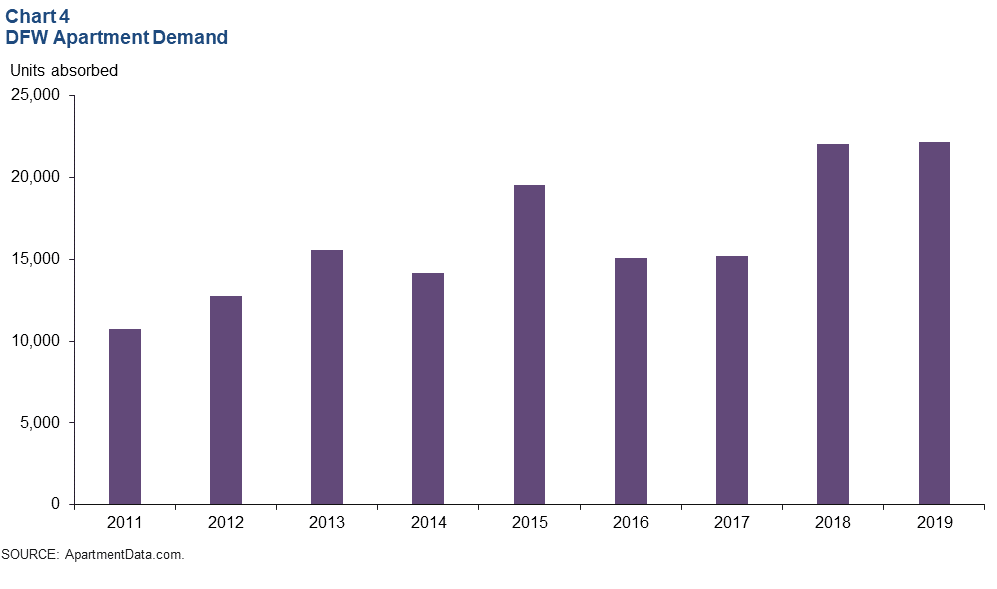
The DFW apartment market remains healthy, thanks to the area’s expanding economy. Apartment absorption was sizable at 22,000 units in 2019, similar to 2018 levels, according to ApartmentData.com (Chart 4). Active demand kept apartment occupancy high and annual rent growth solid last year. Just over 25,000 units were delivered in 2019, and construction remained elevated.
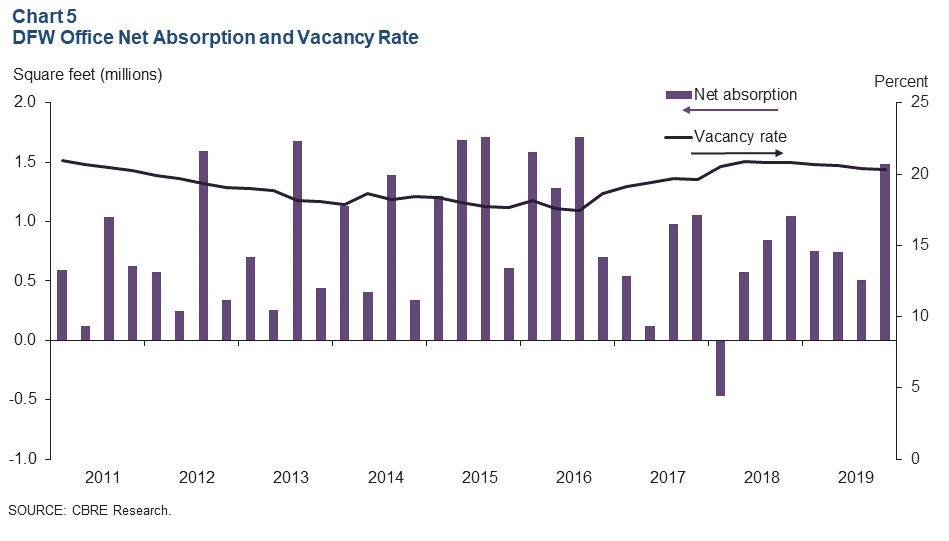
Office Absorption Strengthens
Demand for office space in the DFW market accelerated at year-end. Net absorption was nearly 1.5 million square feet—double the average absorption seen in the first nine months of 2019—according to data from CBRE Research (Chart 5). The vacancy rate ticked down to 20.3 percent, with demand continuing to be driven by Class A space. Construction remained vigorous at 4.6 million square feet at year-end. In 2019, 3.5 million square feet of office space was absorbed, up from 2 million in 2018.
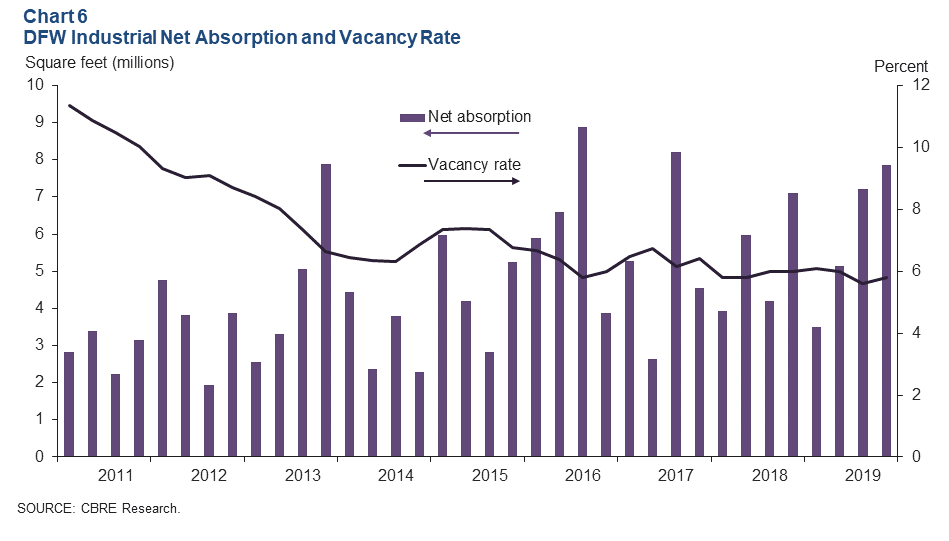
Industrial Leasing Remains Brisk
Leasing activity for industrial space ticked up in the fourth quarter, driven by demand from consumer goods, e-commerce and third-party logistics firms, according to CBRE. Net absorption was nearly 7.9 million square feet, pushing the total for the year to an outsized 23.7 million square feet (Chart 6). The vacancy rate edged up to 5.8 percent, still remaining well below its historical average. Construction stayed elevated at 23.5 million square feet, of which only 15.5 percent was preleased.
NOTE: Data may not match previously published numbers due to revisions.
About Dallas–Fort Worth Economic Indicators
Questions can be addressed to Laila Assanie at laila.assanie@dal.frb.org. Dallas–Fort Worth Economic Indicators is published every month on the Tuesday after state and metro employment data are released.