Dallas-Fort Worth Economic Indicators

February 2, 2021
Dallas–Fort Worth’s economic recovery gained some momentum in December, following softening in the previous month. Job growth accelerated and unemployment dipped, boosting the Dallas and Fort Worth business-cycle indexes. Apartment demand outpaced expectations in the fourth quarter, while absorption of office space remained negative. Strong industrial leasing activity kept vacancy stable and below its historical average, despite elevated supply.
Labor Market
Job Growth Picks Up Pace
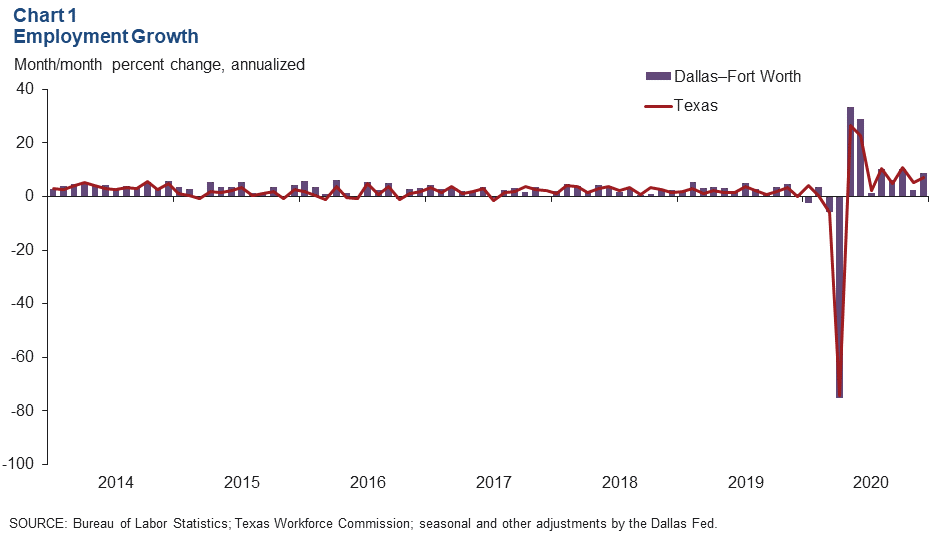
DFW employment strengthened to an annualized 8.6 percent (25,200 jobs nonannualized) in December, marking the eighth straight month of job gains since the slump in spring 2020 (Chart 1). Payrolls in Dallas expanded strongly at an annualized 9.8 percent (20,400 jobs), and employment in Fort Worth rose a healthy 5.7 percent (4,800 jobs). Similarly, job growth accelerated in Texas to 7.1 percent (70,300 jobs), while the U.S. labor market shed jobs in December. The unemployment rate fell to 6.5 percent in Dallas and 7.1 percent in Fort Worth in December, remaining below Texas’ jobless rate of 7.2 percent.
Employment Recovery Uneven
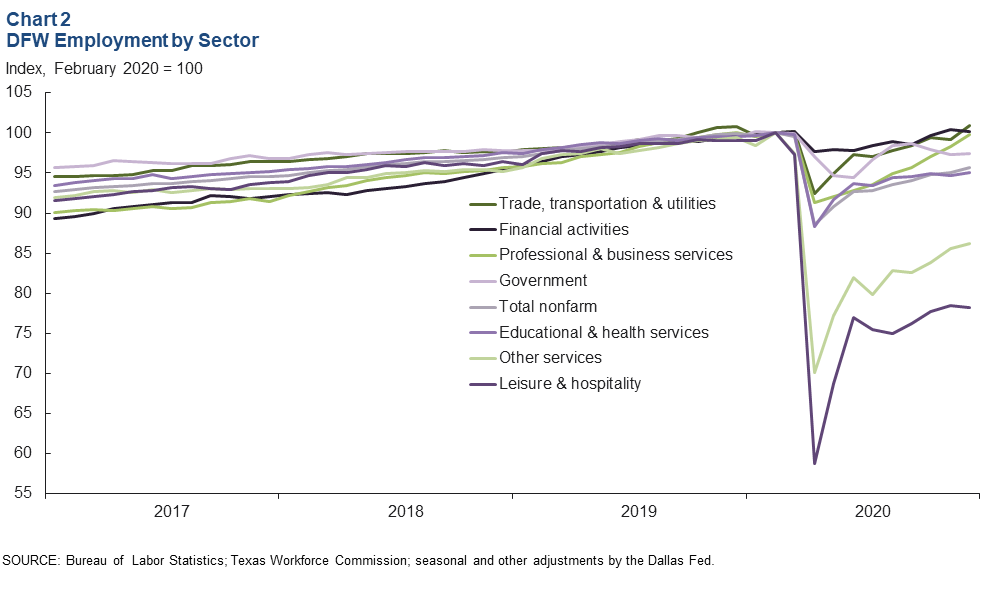
When the pandemic hit and shelter-in-place orders compelled many businesses to temporarily close their doors in early spring, payrolls plunged broadly; however, workers in high person-to-person contact sectors such as leisure and hospitality and other services bore the brunt of the decline (Chart 2). The recovery has been uneven across sectors as well. At year-end 2020, DFW payrolls in financial services, professional and business services, and trade, transportation and utilities were nearly on par with or slightly above their prepandemic February levels. These sectors have benefited from higher demand resulting from the pandemic or have been less impacted because of higher remote-work compatibility. In contrast, head counts in leisure and hospitality and other services remained depressed, down 21.8 percent and 13.7 percent, respectively, from prepandemic levels. For the metroplex, employment remained 4.3 percent lower in December relative to its February 2020 peak, or down 165,300 jobs.
Business-Cycle Indexes
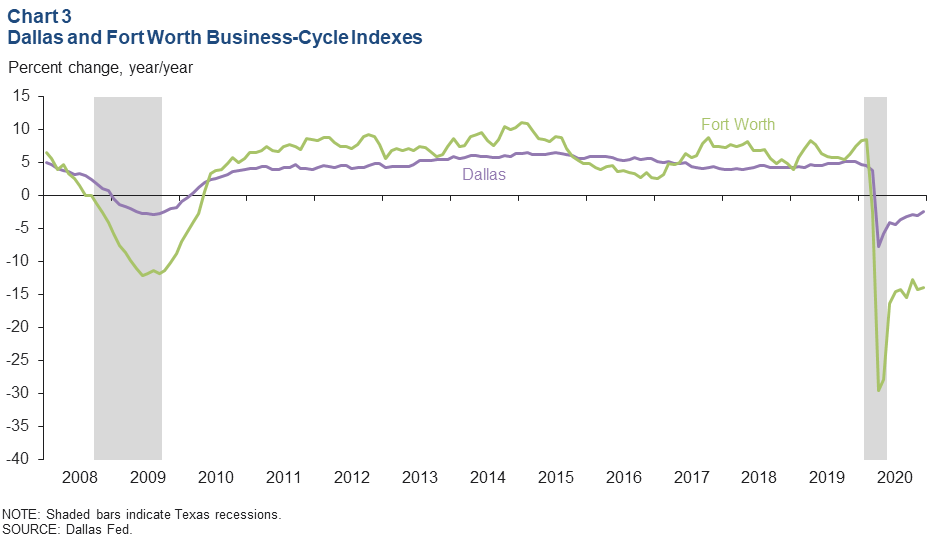
The business-cycle indexes for Dallas and Fort Worth strengthened in December after being flat to down in the previous month. Both indexes rose by more than 11.0 percent annualized in December but ended 2020 down 2.4 percent (Dallas) and 13.9 percent (Fort Worth) (Chart 3). This was due to the COVID-19-related shelter-in-place orders that resulted in a sharp contraction in economic activity last spring.
Real Estate
Apartment Demand Holding Up
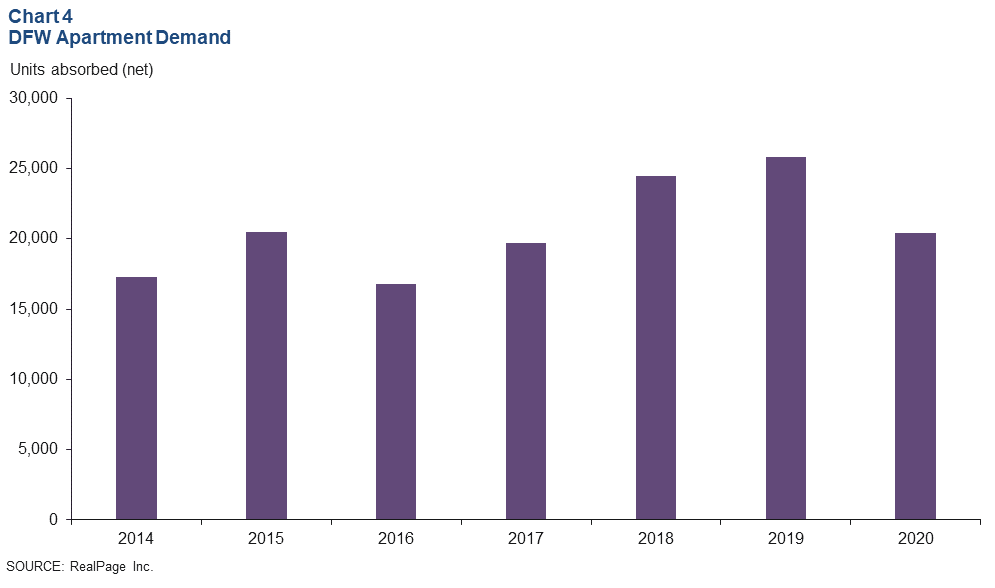
The DFW apartment market saw better-than-expected demand in the fourth quarter. Apartment absorption was a little above 4,000 units, pushing the 2020 total to 20,000 units, according to RealPage Inc. (Chart 4). DFW ranked No. 1 in demand among the major U.S. metros last year, exceeding Atlanta’s absorption of 16,400 apartments. Occupancy dipped by 0.7 percentage points in Dallas and was flat in Fort Worth for the year. New supply was elevated, around 26,000 units in 2020, with Dallas–Fort Worth leading the nation for deliveries. This put downward pressure on rents, which were flat to down last year. Construction remained high at just over 36,000 units—the highest in the country.
Office Absorption Remains Negative
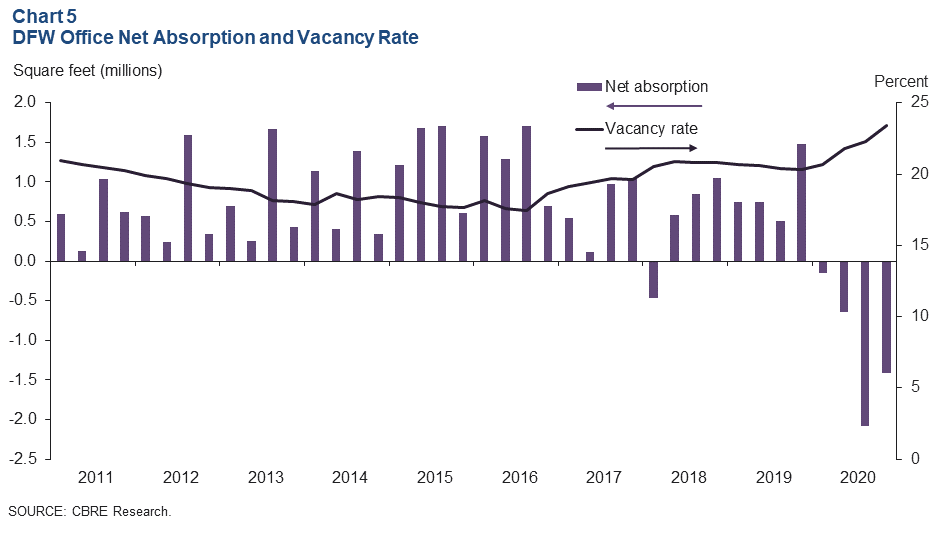
Demand for office space in DFW remained weak in fourth quarter 2020. Net absorption was negative for the fourth quarter in a row at 1.4 million square feet, pushing up the vacancy rate by a percentage point to 23.4 percent, according to data from CBRE Research (Chart 5). In 2020, net absorption totaled -3.9 million square feet, and the vacancy rate climbed 3 percentage points to its highest level in over a decade. This is the first time in recent history that the metro has seen four straight quarters of negative absorption. Sublease space, which has been expanding since last spring, ticked up again in the fourth quarter to 8.8 million square feet, or 13.7 percent of current available space (direct plus sublease).
Industrial Activity Remains Robust
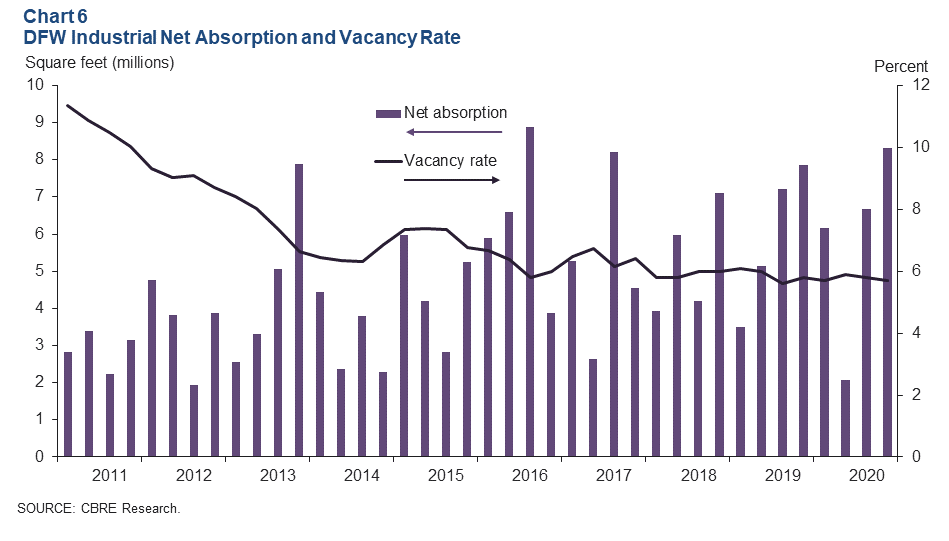
Leasing activity for industrial space continued to be solid in the fourth quarter, driven by demand from consumer goods, e-commerce and logistics firms, according to CBRE. Net absorption was a robust 8.3 million square feet, pushing the 2020 total to 23.2 million square feet, roughly on par with both 2019 absorption as well as 2020 deliveries (Chart 6). The vacancy rate held relatively steady in 2020, buoyed by strong demand despite an elevated level of deliveries, closing the year at 5.7 percent—well below its historical average. Construction stayed high at 19.7 million square feet, of which only 19.7 percent was preleased.
NOTE: Data may not match previously published numbers due to revisions.
About Dallas–Fort Worth Economic Indicators
Questions can be addressed to Laila Assanie at laila.assanie@dal.frb.org. Dallas–Fort Worth Economic Indicators is published every month on the Thursday after state and metro employment data are released.