Dallas-Fort Worth Economic Indicators

April 6, 2021
DFW economic growth waned in February in part due to Winter Storm Uri that brought economic activity to nearly a standstill for about a week. Employment dipped, and the unemployment rate rose, and movement in the business-cycle indexes was mixed. Low-wage workers were the hardest hit by the pandemic, and employment among this group has been the slowest to recover. Single-family construction remained robust and near record highs. Apartment building continued to moderate, and tenants were paying rent later in the month than usual.
Labor Market
Job Growth Weakens in February
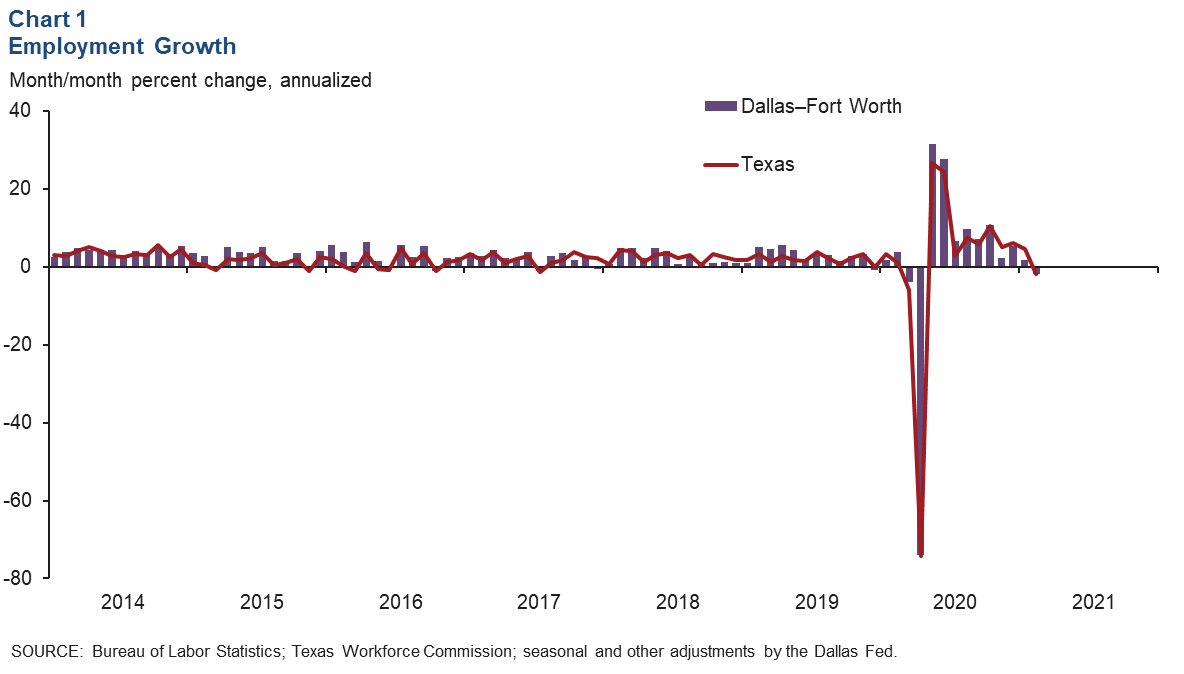
DFW employment contracted at an annualized rate of 1.8 percent (-5,500 jobs nonannualized) in February, marking the first month of job losses since the slump in spring 2020 (Chart 1). Payrolls in Dallas dipped at an annualized rate of 1.7 percent (-3,800), and employment in Fort Worth likewise fell 1.9 percent (-1,700). Texas job growth also decreased 1.8 percent (-19,000) in February after growing 4.5 percent (45,700) in the prior month. The unemployment rate increased to 6.3 percent in Dallas and 6.6 percent in Fort Worth, though both still remain below Texas’ jobless rate of 6.9 percent.
Employment Recovery Uneven
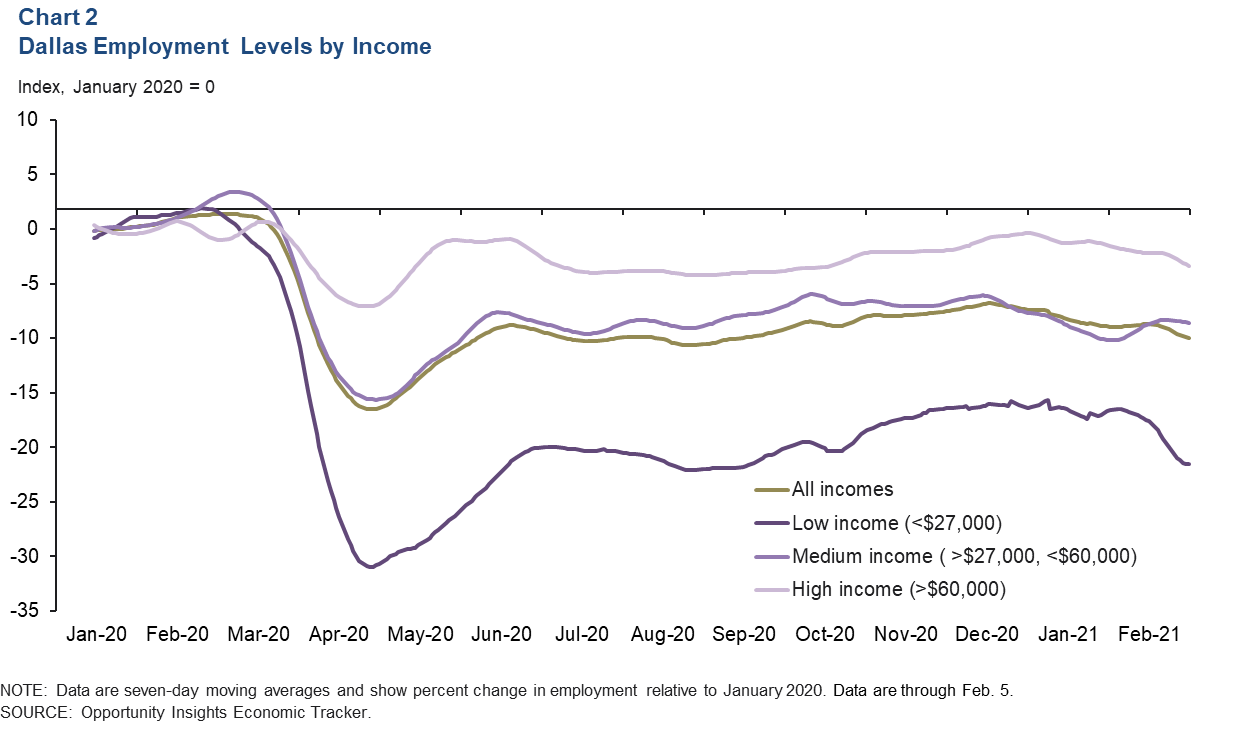
The COVID-19 pandemic has disproportionately affected low-income workers. Data from the Opportunity Insights Economic Tracker illustrate that medium-to-high-income workers (those earning above $27,000) in Dallas have been less impacted than their low-income counterparts (Chart 2). In early spring 2020 when shelter-in-place orders were implemented, job losses were steepest amid those earning less than $27,000. The recovery has been uneven as well, with employment in the upper-wage group slightly trailing January 2020 levels. Employment among middle-wage workers was down by 8.6 percent over the same period. By contrast, employment among low-wage earners in Dallas remained 21.5 percent below January 2020 levels. Fort Worth’s employment has seen similar trends, with low-wage workers seeing much lower levels of employment relative to prepandemic figures.
Business-Cycle Indexes
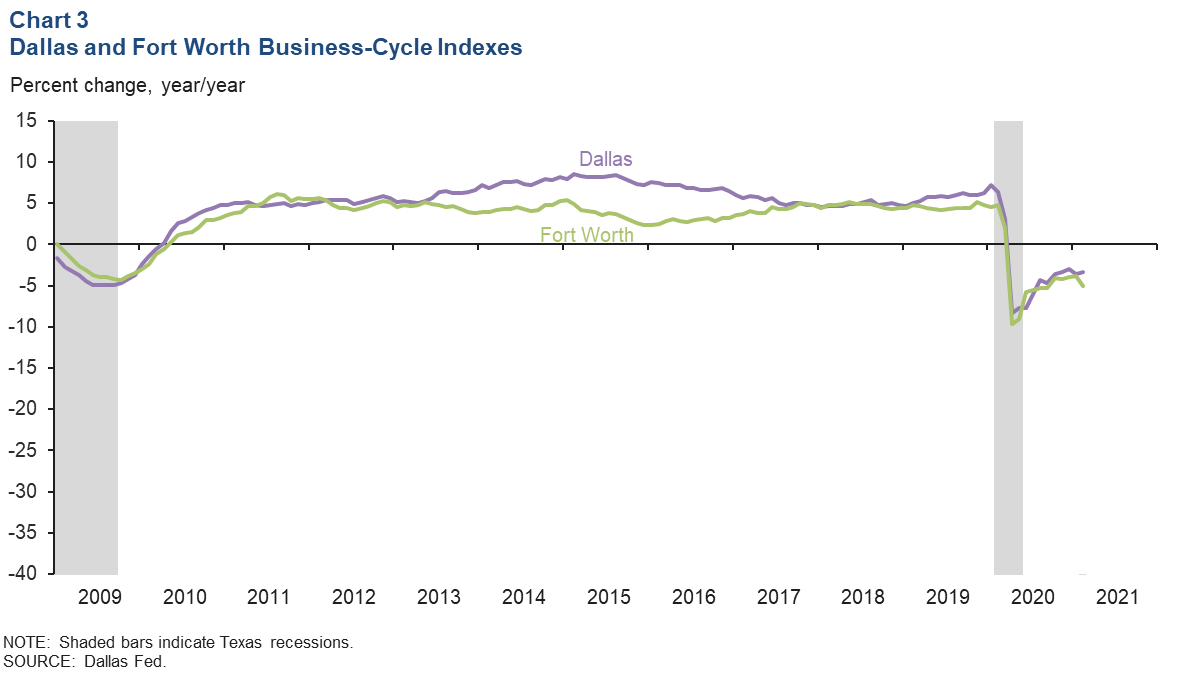
Growth in the business-cycle indexes for Dallas and Fort Worth was mixed in February. The Dallas index rose an annualized 2.3 percent in February after a strong increase in January. Meanwhile, the Fort Worth index dipped an annualized 1.0 percent in February following fairly similar growth the previous month. Year over year in February, the Dallas index was down 3.3 percent, while the Fort Worth index was down 5.0 percent (Chart 3). This is due to the COVID-19-related shelter-in-place orders that resulted in a sharp contraction in economic activity last spring.
Construction and Real Estate
Homebuilding Stays Strong
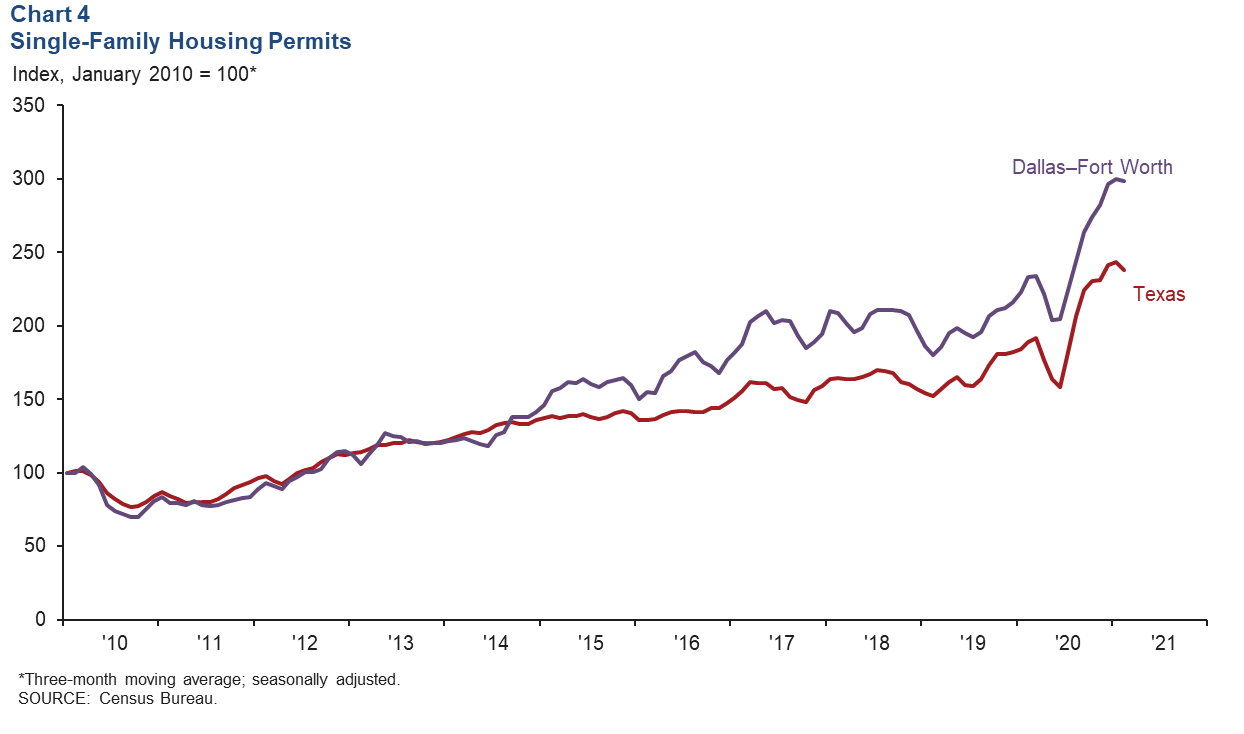
DFW single-family housing permits fell in the first two months of the year, but activity remained elevated; through February, it was up 19.0 percent year over year. The three-month moving average flattened out in part due to permitting and production delays and also because of constrained supply for lots, materials and labor (Chart 4). Single-family permit issuance fell sharply in spring 2020 as uncertainty regarding the COVID-19 pandemic weighed on outlooks. After a temporary pause, development activity rebounded strongly, setting a record high in December. In 2020, total single-family permits issued were up from 2019 by 24.3 percent in DFW and 21.5 percent in Texas.
Multifamily Construction Moderates
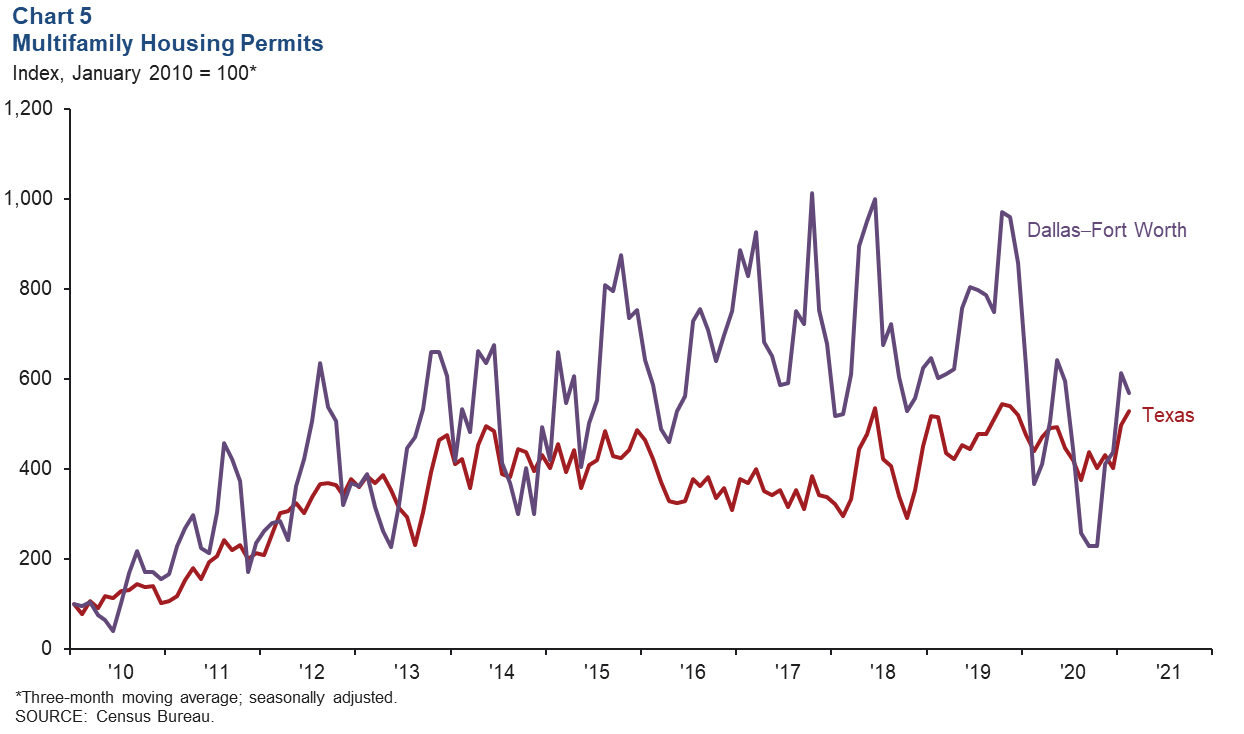
Multifamily permit issuance, which leads apartment construction, fell in February following strong growth in the previous month, and the three-month moving average dipped as well (Chart 5). In 2020, DFW multifamily permits issuance was just over half that of 2019. By comparison, Texas multifamily permits fell 8.0 percent. DFW multifamily permit issuance peaked in 2019 and has been moderating since; however, construction in the metroplex is currently elevated at approximately 35,000 units, with DFW remaining the busiest market in apartment building among large U.S. metros.
Most Apartment Tenants Paying Rent but Later than Normal
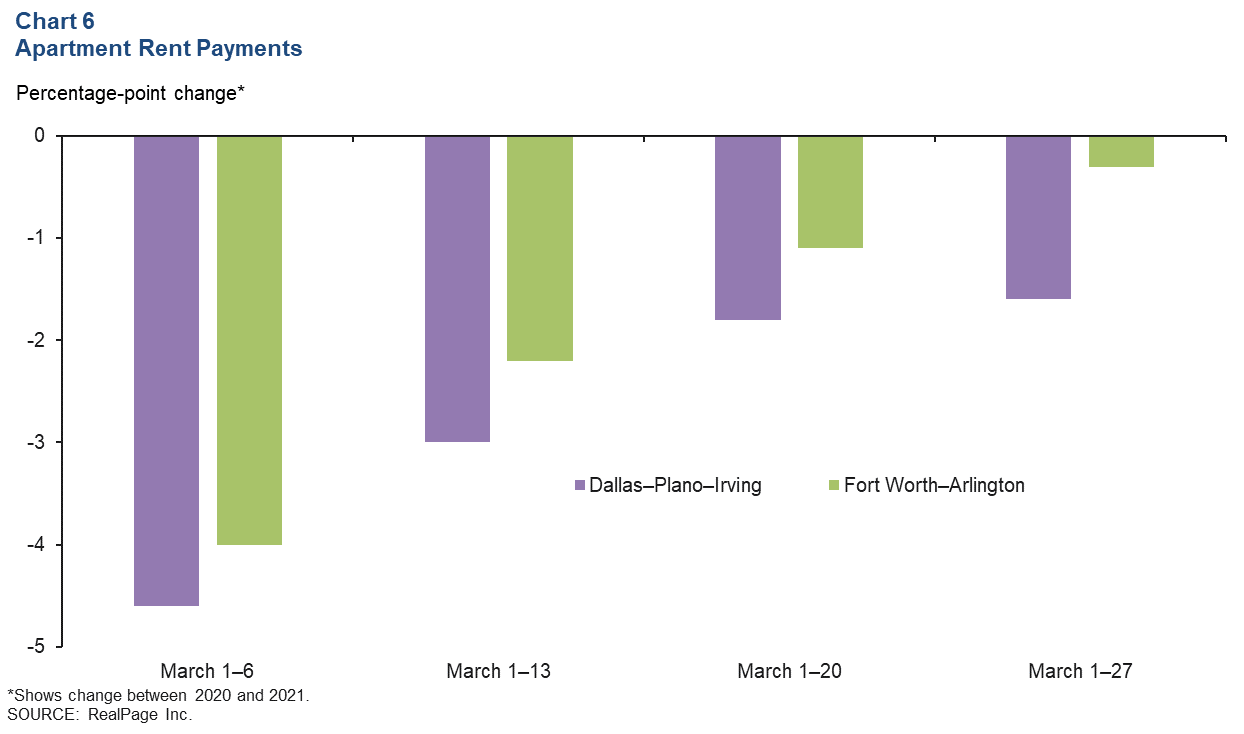
In DFW, most apartment tenants continue to pay rent each month, though payments are being sent in later than usual. In the first week of March, collections in professionally managed market-rate apartments trailed 2020 levels by 4.6 percentage points in Dallas and 4.0 percentage points in Fort Worth (Chart 6). By the end of the month, collections were down by 1.6 percentage points in Dallas and 0.3 percentage points in Fort Worth. The pattern in Texas was similar, with shares trailing those in the same period in 2020 by 3.9 percentage points during March 1–6 and 1.3 percentage points by the end of March.
NOTE: Data may not match previously published numbers due to revisions.
About Dallas–Fort Worth Economic Indicators
Questions can be addressed to Laila Assanie at laila.assanie@dal.frb.org. Dallas–Fort Worth Economic Indicators is published every month after state and metro employment data are released.