Dallas-Fort Worth Economic Indicators

April 23, 2021
The DFW economic recovery gained momentum in March as payrolls grew robustly, the unemployment rate dipped, and the Dallas and Fort Worth business-cycle indexes climbed. Apartment demand was solid in the first quarter, pushing up rents and occupancy. Activity in the office market was still finding its footing, while industrial leasing remained remarkably strong.
Labor Market
Payroll Expansion Accelerates
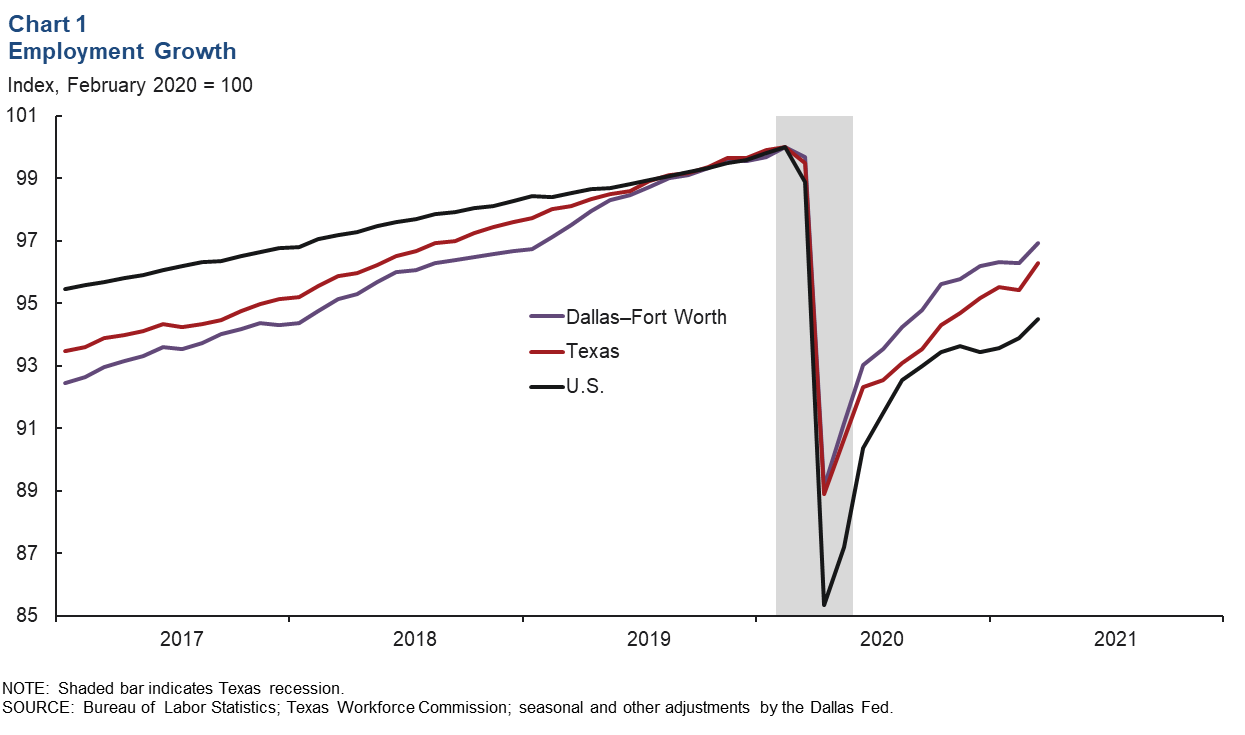
DFW employment grew an annualized 8.4 percent (25,100 jobs, nonannualized) in March after being relatively flat in February. Payrolls expanded strongly at 8.7 percent (18,400) in Dallas and 7.9 percent (6,700) in Fort Worth. Similarly, Texas job growth strengthened to 11.3 percent (110,800) following a 1.4 percent drop in February—a result of Winter Storm Uri. The DFW labor market began recovering in May 2020, and through March, payrolls remained 3.1 percent lower than February 2020 levels; Texas was 3.7 percent below those levels in March, and the U.S. was 5.5 percent lower (Chart 1). The unemployment rate fell to 6.2 percent in Dallas and 6.5 percent in Fort Worth in March, remaining below Texas’ jobless rate of 6.9 percent.
First-Quarter Job Gains Broad Based
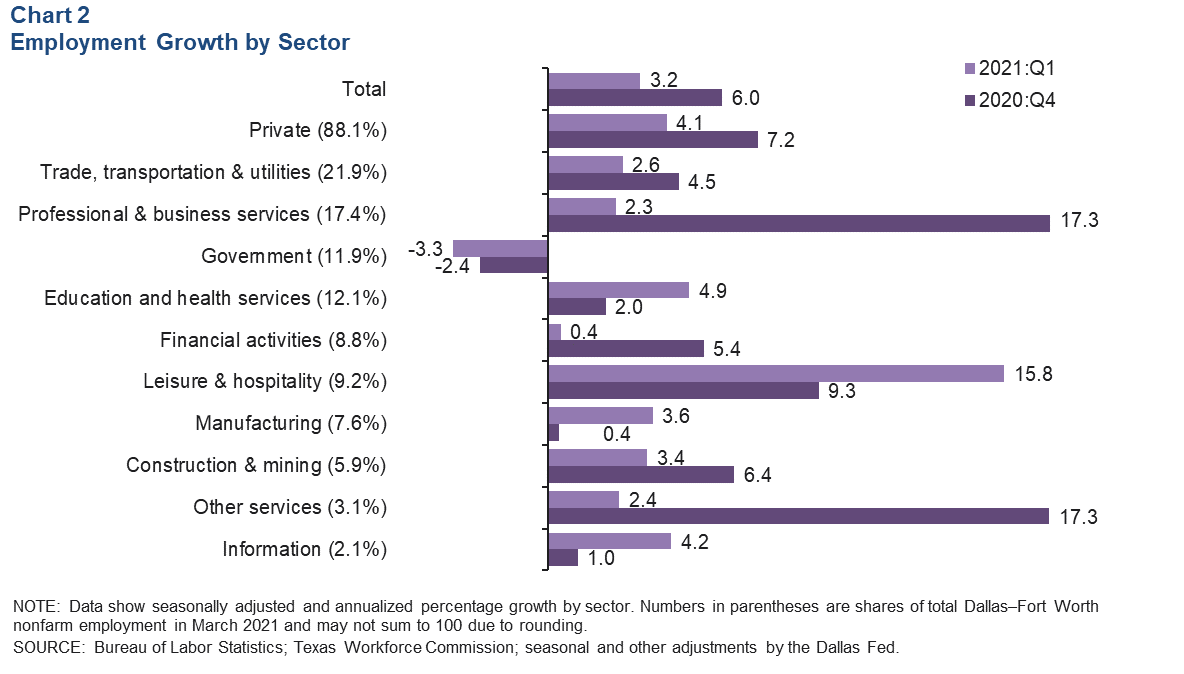
Jobs in DFW expanded at a 3.2 percent annualized rate in the first quarter—slower than the fourth quarter’s 6.0 percent increase (Chart 2). Gains were broad based. In the goods sector, employment growth strengthened in manufacturing but moderated in construction and mining. Expansion among service-providing industries was led by a surge in leisure and hospitality employment, particularly accommodation and food services jobs in the Dallas metro division. Hiring accelerated in information and education and health services, while government payrolls contracted in the first quarter, driven largely by sharp declines in Dallas. Payrolls in the metro’s largest sector—trade, transportation and utilities—rose in the quarter thanks to a pickup in retail employment and continued increases in demand for warehousing services.
Business-Cycle Indexes
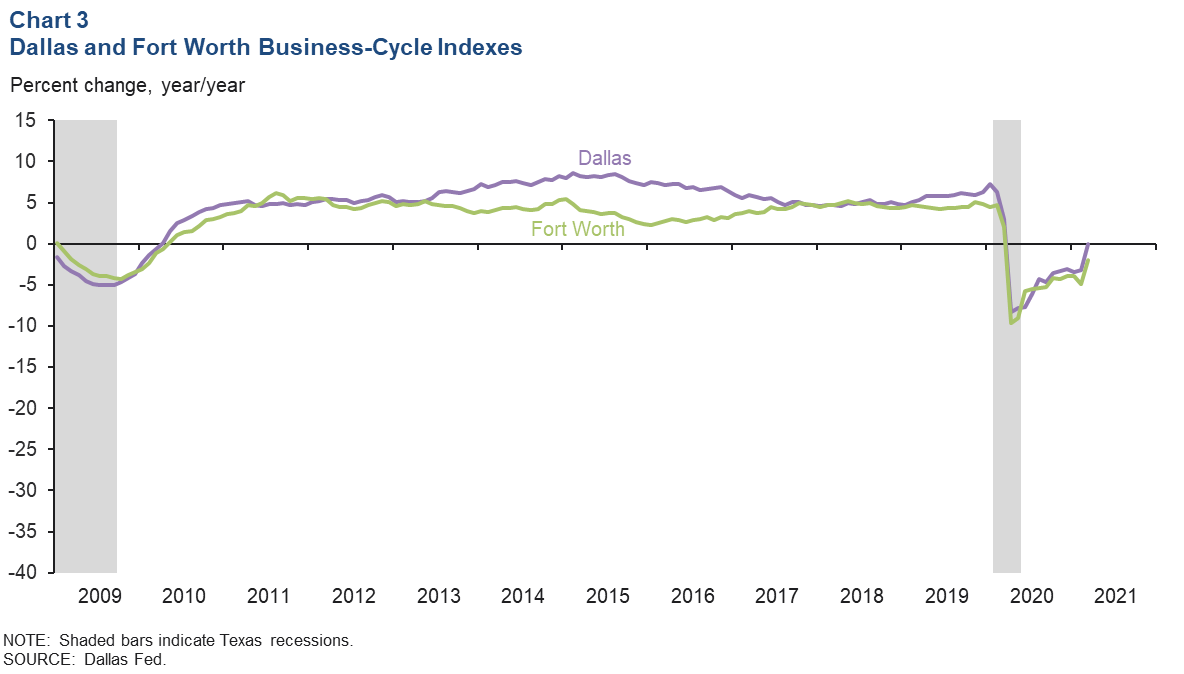
The business-cycle indexes for Dallas and Fort Worth accelerated in March, supported by healthy payroll gains. The Dallas and Fort Worth indexes saw over 9.0 percent growth in March after more modest increases in February. Year over year in March, the Dallas index was flat, while the Fort Worth index was down 2.0 percent (Chart 3).
Real Estate
Apartment Demand Strengthens
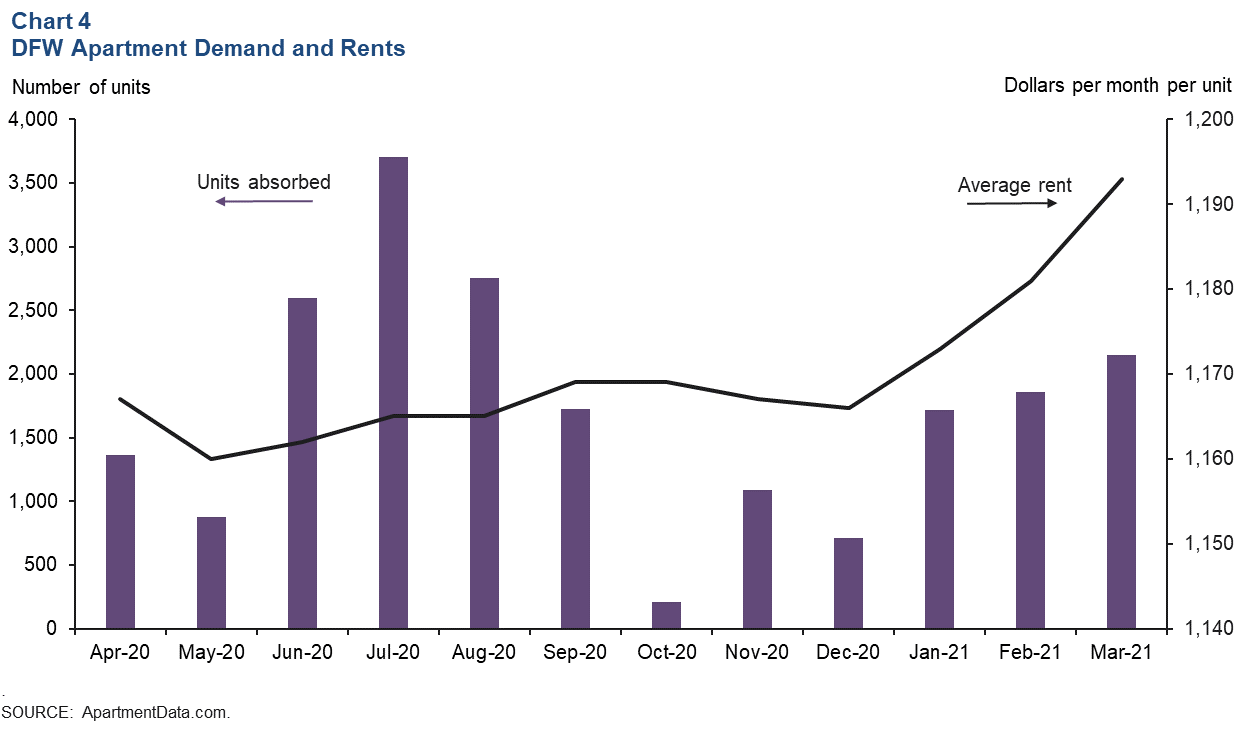
DFW apartment absorption was strong, and rents rose in the first quarter, according to ApartmentData.com. Demand is generally sluggish in the first quarter, but absorption exceeded expectations with a total of 5,727 units absorbed, up from 2,009 units in the fourth quarter. Average monthly rents in DFW ticked up to $1,193 per unit, up 1.6 percent year over year (Chart 4). Rent concessions were ongoing, largely in Class A properties. Occupancy rose as well to 91 percent; however, it remained extremely low in Class A properties that were in the lease-up phase.
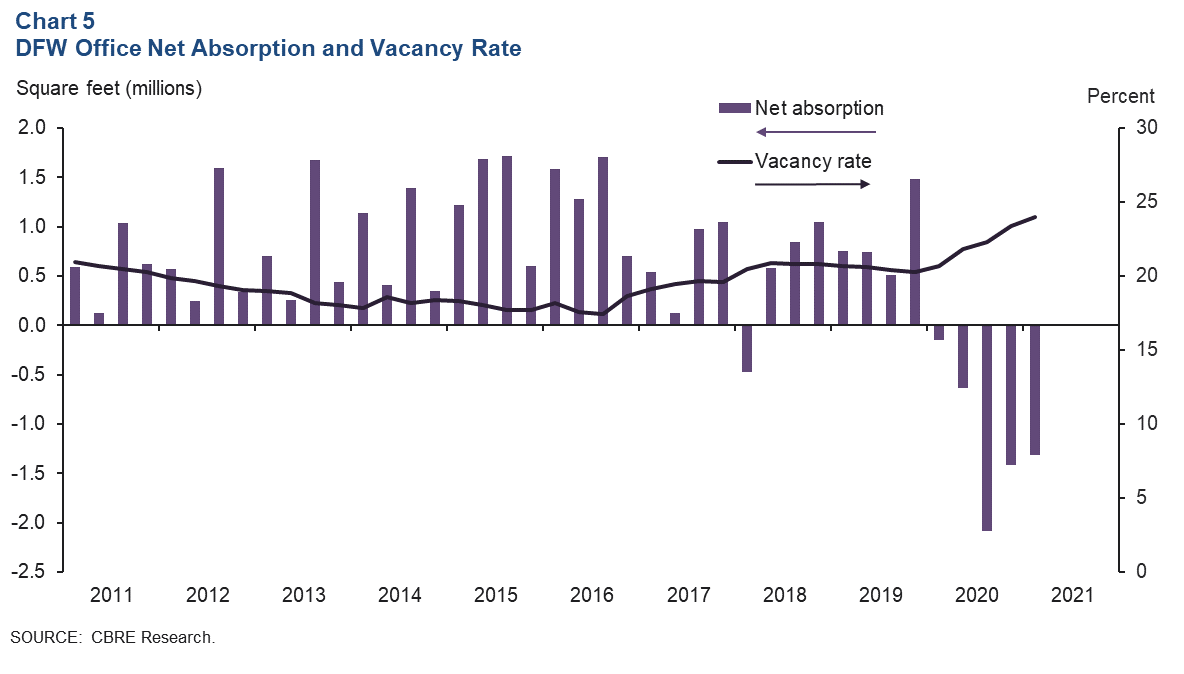
Office Vacancy Sets New Multiyear High
Demand for office space in DFW remained weak in first quarter 2021. Net absorption was negative for the fifth quarter in a row at 1.3 million square feet, pushing up the vacancy rate to a multiyear high of 24.0 percent, according to data from CBRE Research (Chart 5). Over the past five quarters, net absorption in DFW has totaled -5.6 million square feet, and the vacancy rate has risen by nearly 4 percentage points to its highest level since 2004. This is the first time in recent history that the metro has seen five straight quarters of negative absorption. Increases in sublease space have moderated, though the total ticked up again in the first quarter to slightly above 9.0 million square feet, or 13.9 percent of current available space (direct plus sublease). The far North Dallas submarket accounts for the largest share at roughly 28.0 percent of the metro area’s sublease space. Business contacts note that activity, though weak, is beginning to stabilize.
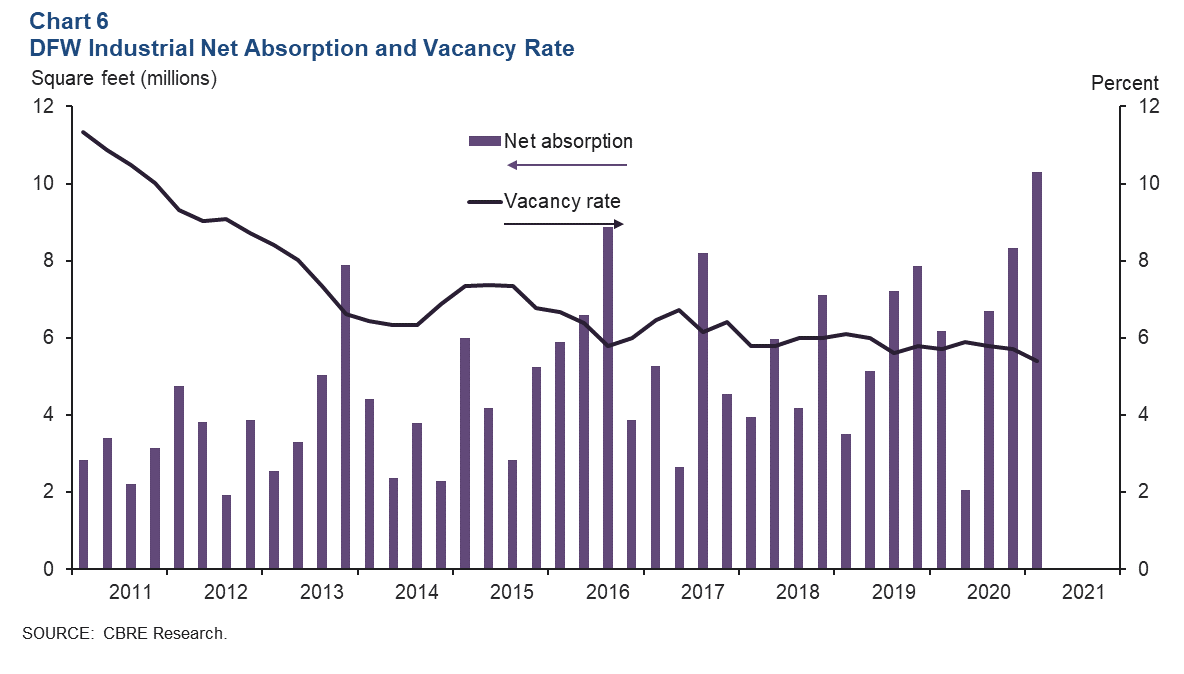
Industrial Activity Booming
Leasing activity for industrial space continued to be vigorous in the first quarter, driven by demand from consumer goods, e-commerce and logistics firms, according to CBRE. Net absorption was a hearty 10.3 million square feet, the highest in recent history (Chart 6). The vacancy rate dipped to 5.4 percent, buoyed by persistent strong demand. The pandemic has boosted online sales growth, which has been a boon to distribution hubs such as DFW. Construction stayed high at 22.4 million square feet, of which 18.3 percent was preleased.
NOTE: Data may not match previously published numbers due to revisions.
About Dallas–Fort Worth Economic Indicators
Questions can be addressed to Laila Assanie at laila.assanie@dal.frb.org. Dallas–Fort Worth Economic Indicators is published every month after state and metro employment data are released.