Dallas-Fort Worth Economic Indicators

November 1, 2021
Dallas–Fort Worth economic expansion accelerated in September. Payroll employment grew and finally surpassed its prepandemic high 19 months after COVID-19 battered the local labor market. The Dallas and Fort Worth business-cycle indexes—broad measures of local economic activity—increased strongly. Consumer spending remained robust in early October and was well above prepandemic levels. Demand for industrial space was elevated, and office leasing activity remained sluggish.
Labor Market
Employment Eclipses Prepandemic High
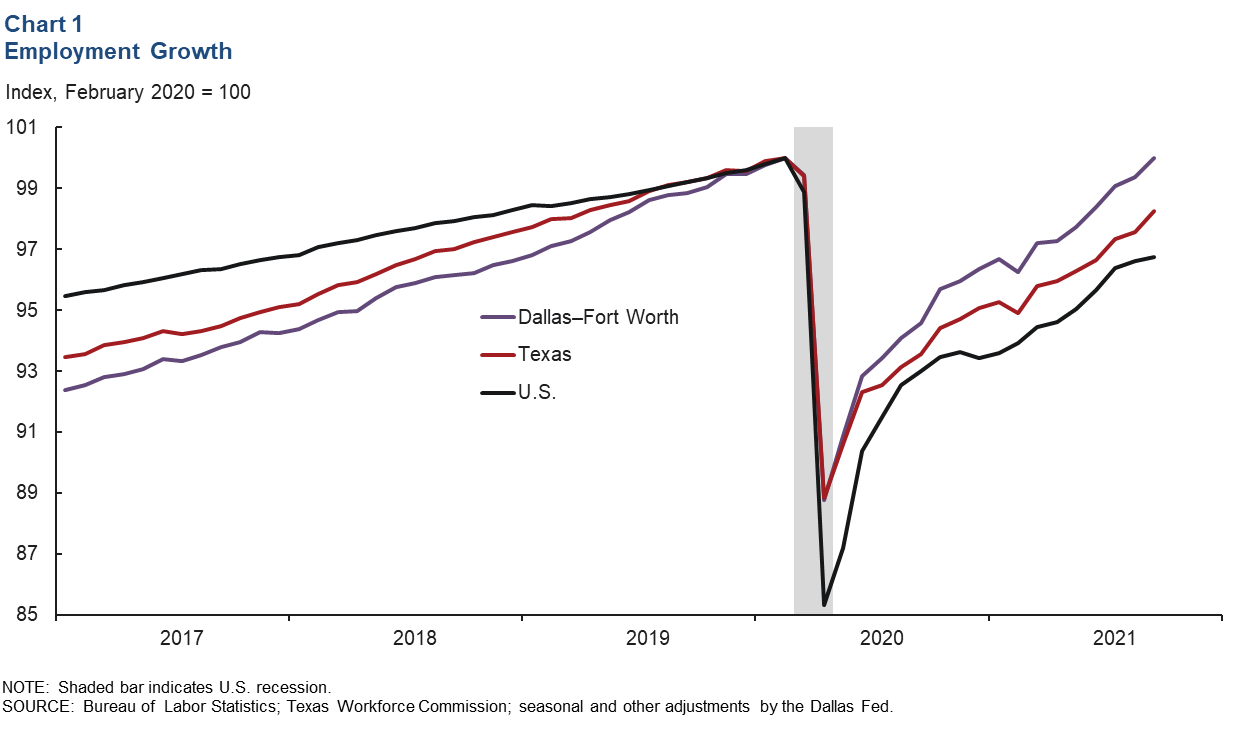
Job growth picked up pace in September, rising an annualized 8.1 percent, up from 3.6 percent in August. September gains of 24,900 jobs pushed DFW employment past its prerecession level (Chart 1). The metro area’s recovery has outperformed the state and U.S. since early in the pandemic. Employment in the Dallas–Plano–Irving metro division was 0.5 percent above February 2020 levels, while Fort Worth–Arlington was 1.1 percent below. Payrolls in Texas and the U.S. trailed their prepandemic highs by 1.7 percent and 3.3 percent, respectively.
Jobs Recovery in the Goods Sector and High-Contact Services Straggle
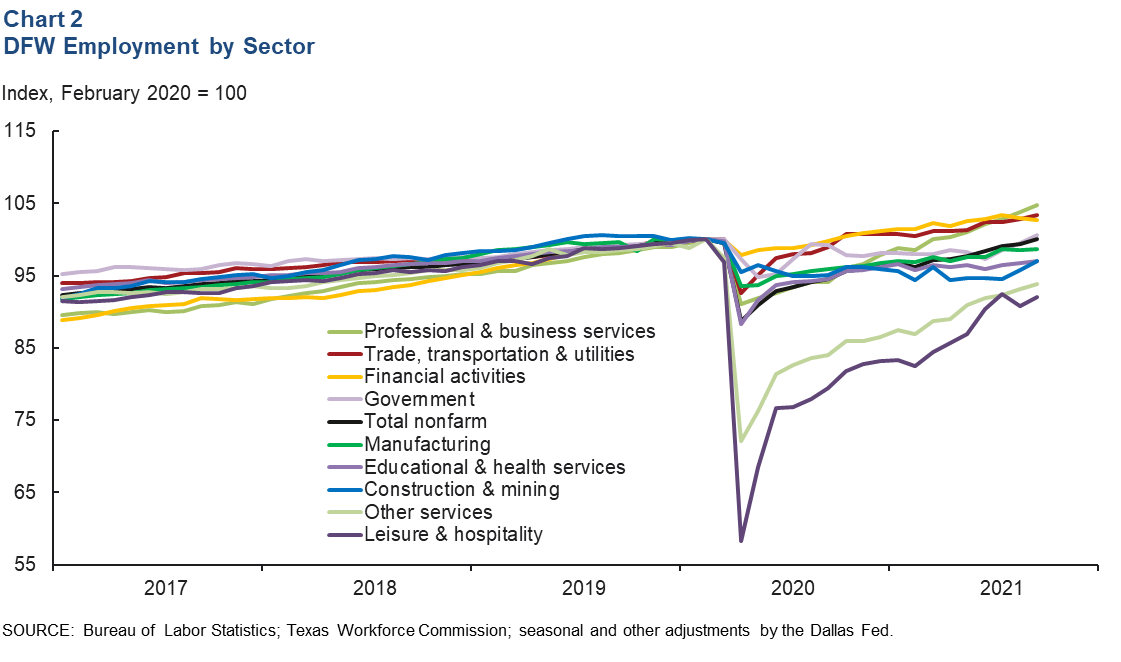
Labor market recovery has been uneven across sectors. In the service sector, payrolls in professional and business services, financial activities, and trade, transportation and utilities have more than recovered, with growth in the latter fueled by strong e-commerce activity (Chart 2). Employment in government has recouped fully, too; however, employment in high-contact service industries such as leisure and hospitality, and other services, which were the hardest hit, has been the slowest to recover. Overall, job gains in the goods sector have been more measured than in the service sector, with employment in manufacturing at 98.7 percent of its February 2020 peak and in construction and mining at 97.0 percent.
Business-Cycle Indexes
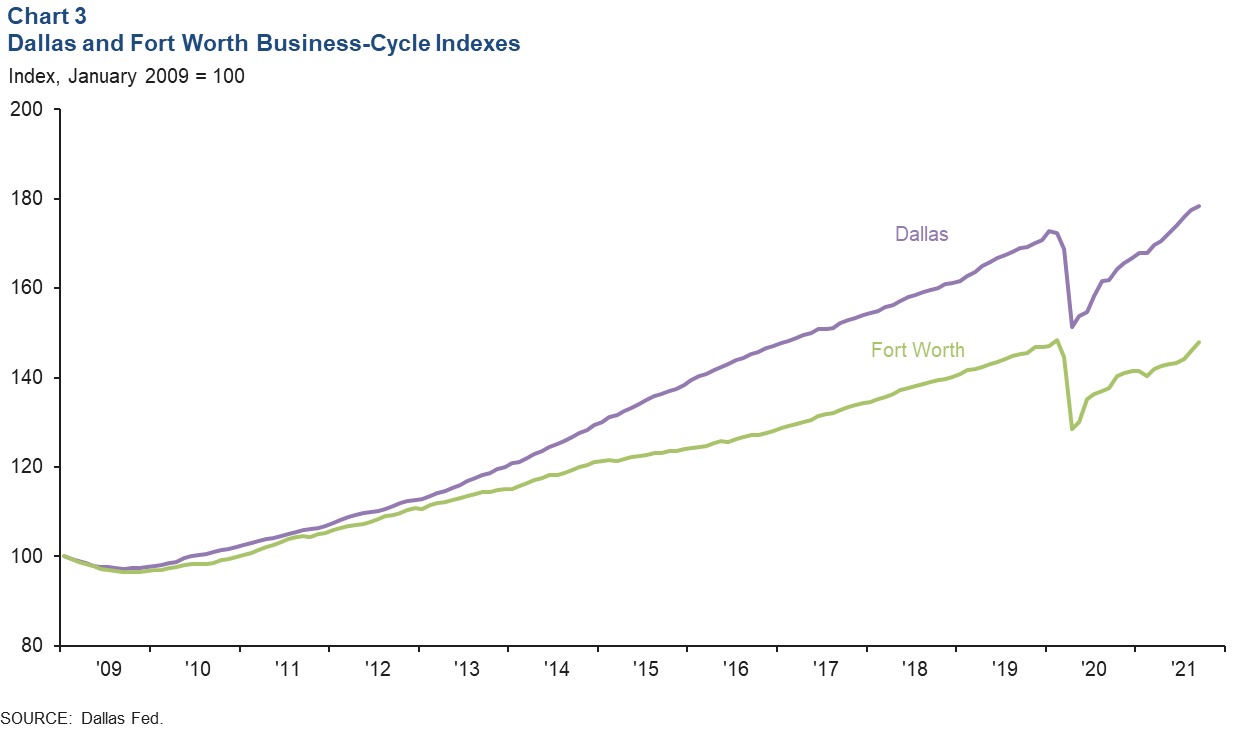
The Dallas and Fort Worth business-cycle indexes continued to expand strongly in September, buoyed by robust job growth and declining unemployment. The Dallas index rose an annualized 7.3 percent, marking the 17th successive month of growth, and was up 3.6 percent from its previous February 2020 peak (Chart 3). The Fort Worth index rose an annualized 18.9 percent in September, its seventh straight month of expansion, though it remains down 0.3 percent from its prepandemic high.
Consumer Spending
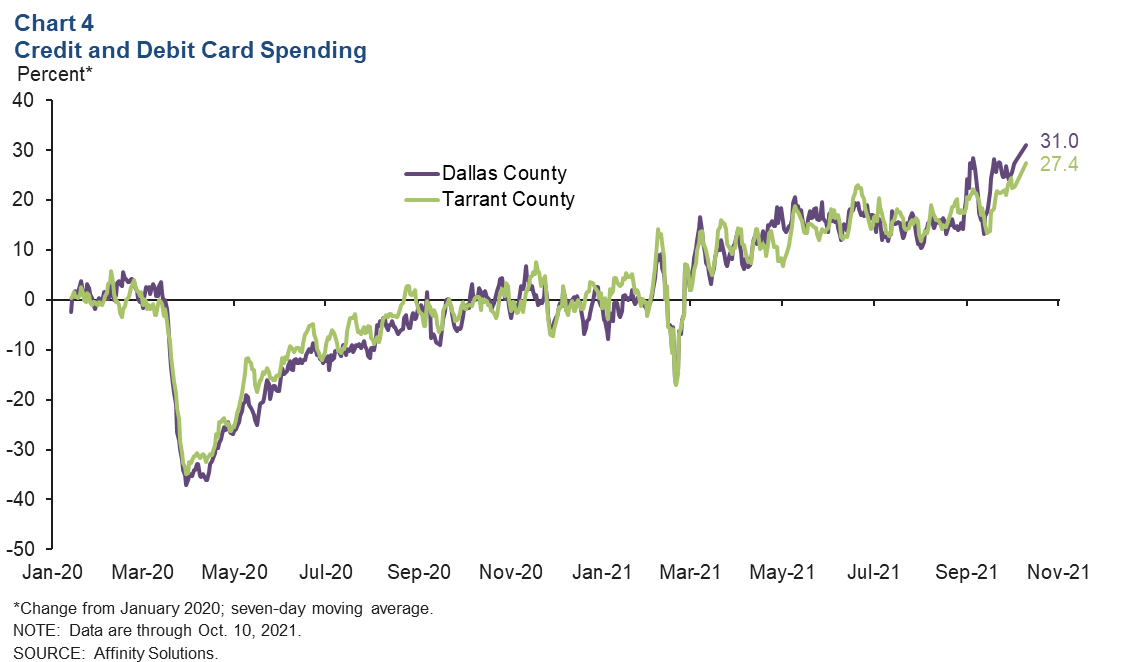
Since late January 2021, debit and credit card spending in DFW has consistently exceeded prepandemic levels, except for the brief decline during the week of Winter Storm Uri in mid-February. Spending has strengthened in recent weeks; as of Oct. 10, it was 31.0 percent higher in Dallas County relative to January 2020 and 27.4 percent higher in Tarrant County (Chart 4).
Commercial Real Estate
Office Vacancy Climbs Further
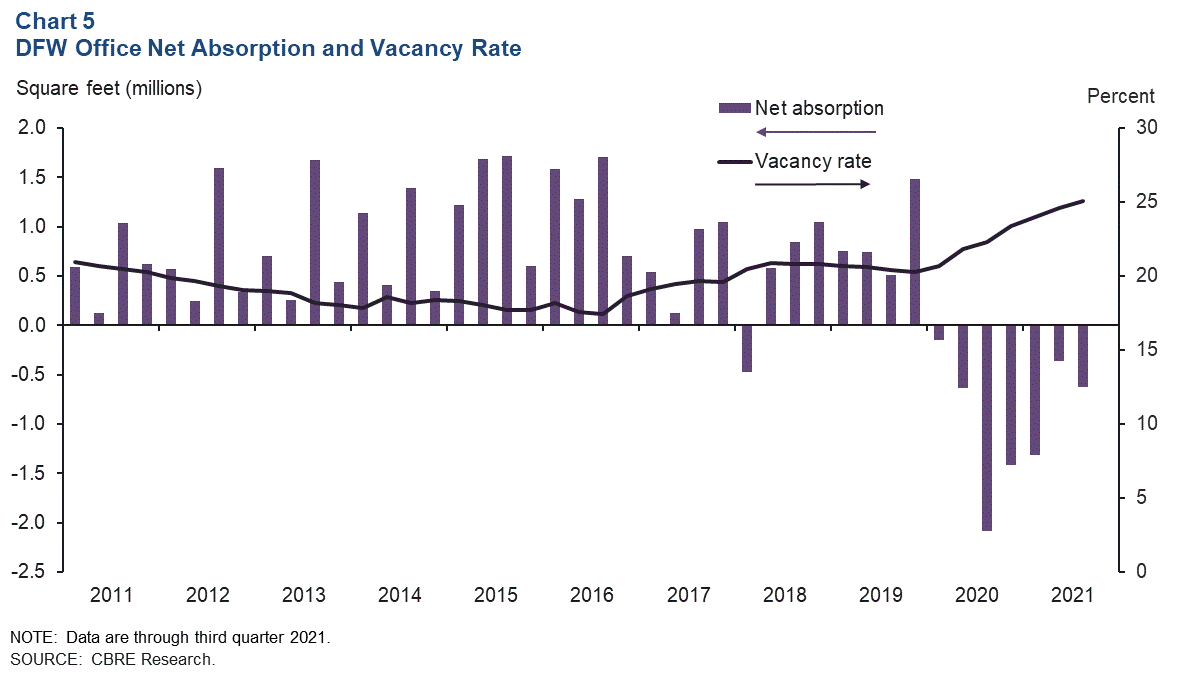
Demand for office space in DFW remained weak in third quarter 2021 as tenants continued to downsize and/or reevaluate their space needs. Net absorption was negative for the seventh straight quarter at 621,328 square feet, pushing up the vacancy rate to a high of 25.1 percent, according to data from CBRE Research (Chart 5). This is the first time in recent history that the metro has seen nearly two years of negative absorption. Availability of sublease space edged up to 9.2 million square feet, or 14.0 percent of total available space, with Class A properties continuing to make up two-thirds of the sublease listings. Business contacts expect activity to gradually improve next year.
Boom in Industrial Activity Continues
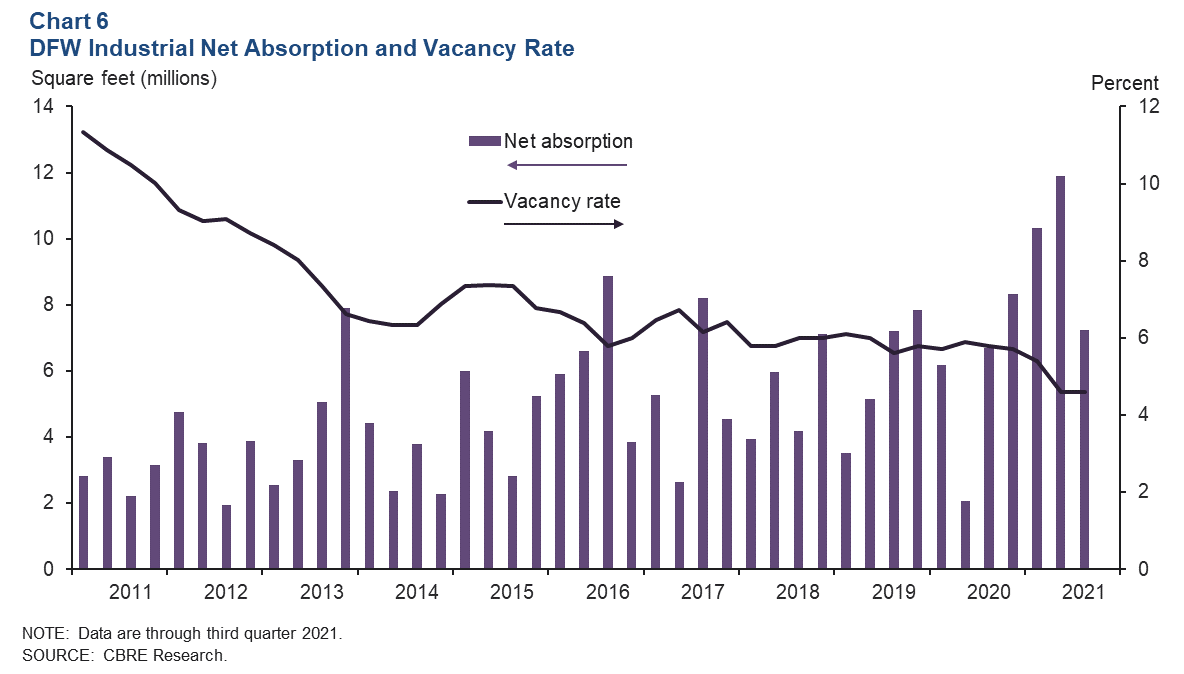
Leasing activity for industrial space stayed relentlessly strong in the third quarter, driven by demand from consumer goods, e-commerce, and logistics and manufacturing firms. Net absorption was nearly 7.3 million square feet, bringing the year-to-date total to 29.5 million square feet, according to CBRE (Chart 6). Year-to-date absorption has eclipsed the previous annual high of 25.3 million in 2016. The vacancy rate held steady at 4.6 percent, sustained by persistent strong demand. The pandemic has boosted online sales growth, which has been a boon to distribution hubs such as DFW. Construction soared from 27.1 million square feet in the second quarter to 31.3 million in the third, of which 31.5 percent was preleased.
NOTE: Data may not match previously published numbers due to revisions.
About Dallas–Fort Worth Economic Indicators
Questions can be addressed to Laila Assanie at laila.assanie@dal.frb.org. Dallas–Fort Worth Economic Indicators is published every month after state and metro employment data are released.