Dallas-Fort Worth Economic Indicators

December 2, 2021
Economic growth in the Dallas–Fort Worth metroplex remained steady in October. Both payroll employment and the Dallas and Fort Worth business-cycle indexes—broad measures of local economic activity—increased strongly. New jobless claims continued their downward trend. Home sales and construction have cooled from their peaks but remained elevated, pushing up home prices to new highs.
Labor Market
Strong Job Gains Persist
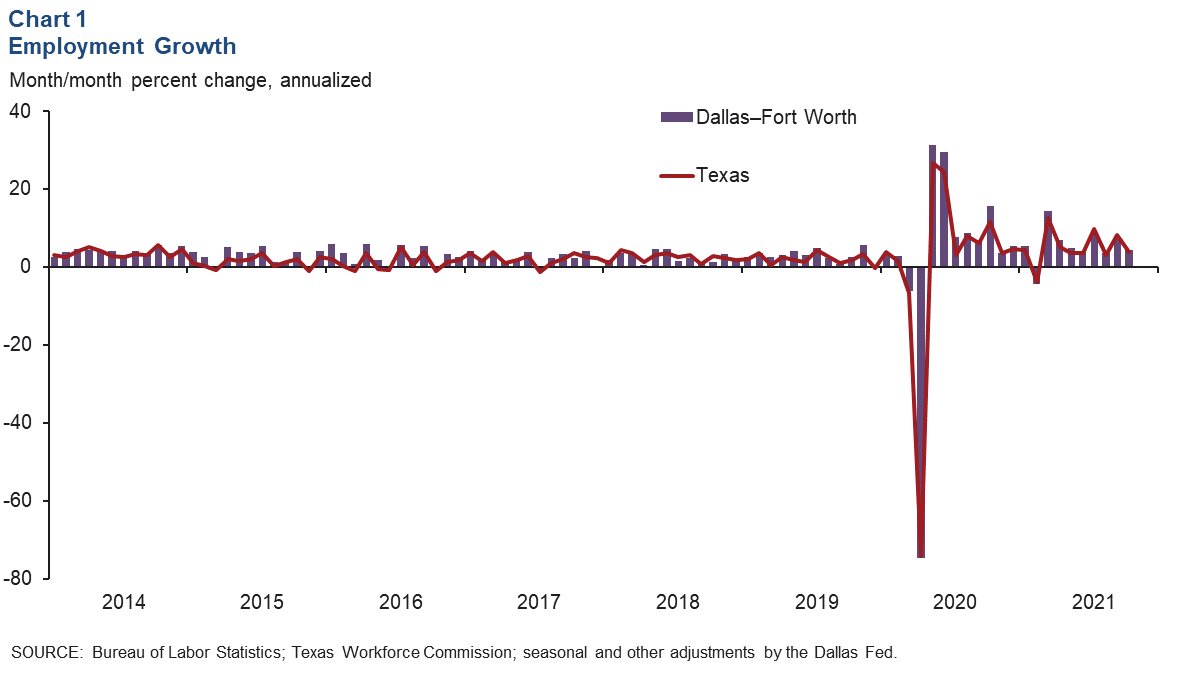
Job growth in DFW stayed above par in October, rising an annualized 4.5 percent, or by 14,300 jobs (Chart 1). Growth was mixed, with employment expanding robustly in private services but declining in construction and mining, manufacturing and government. With October gains, DFW employment is 0.6 percent above its February 2020 level, or 25,000 jobs. Employment in the Dallas–Plano–Irving metro division was 1.0 percent above prepandemic levels, while Fort Worth–Arlington was 0.3 percent below them. Payrolls in Texas and the U.S. trailed their prepandemic highs by 1.1 percent and 2.8 percent, respectively.
New Jobless Claims Slide
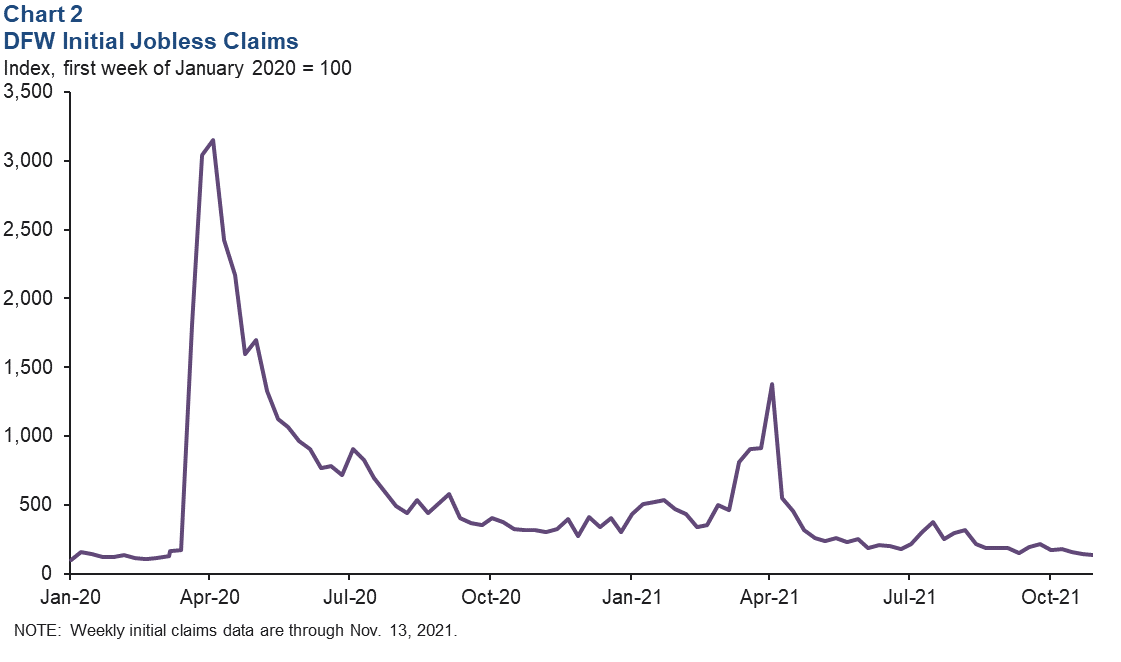
The unemployment rate held steady at 4.6 percent in Dallas and 4.7 percent in Fort Worth in October, with both remaining below Texas’ jobless rate of 5.4 percent. Initial unemployment insurance claims in DFW dipped further to 3,157 for the week ended Nov. 13 (Chart 2). Since peaking in early April 2020, claims have generally been on a downward trend outside of a post-winter-storm period in February and March. They have largely stabilized and are roughly in line with levels seen in early 2020 (pre-COVID-19).
Business-Cycle Indexes
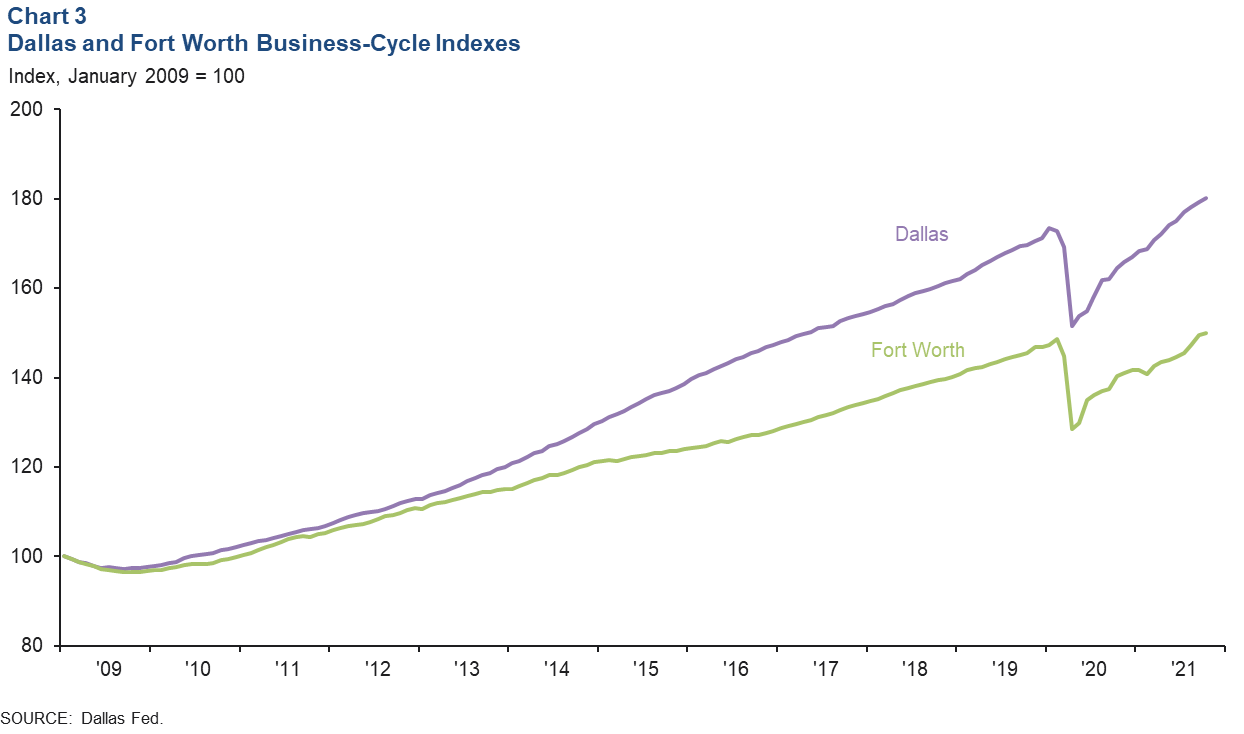
The Dallas and Fort Worth business-cycle indexes continued to expand strongly in October, buoyed by robust job growth and low unemployment. The Dallas index rose an annualized 6.8 percent, marking the 18th straight month of growth, and was up 4.3 percent from its February 2020 level (Chart 3). The Fort Worth index rose an annualized 4.8 percent in October, its eighth successive month of expansion, and has eclipsed its prepandemic high by 1.0 percent.
Housing
Homes Sales Tick Up
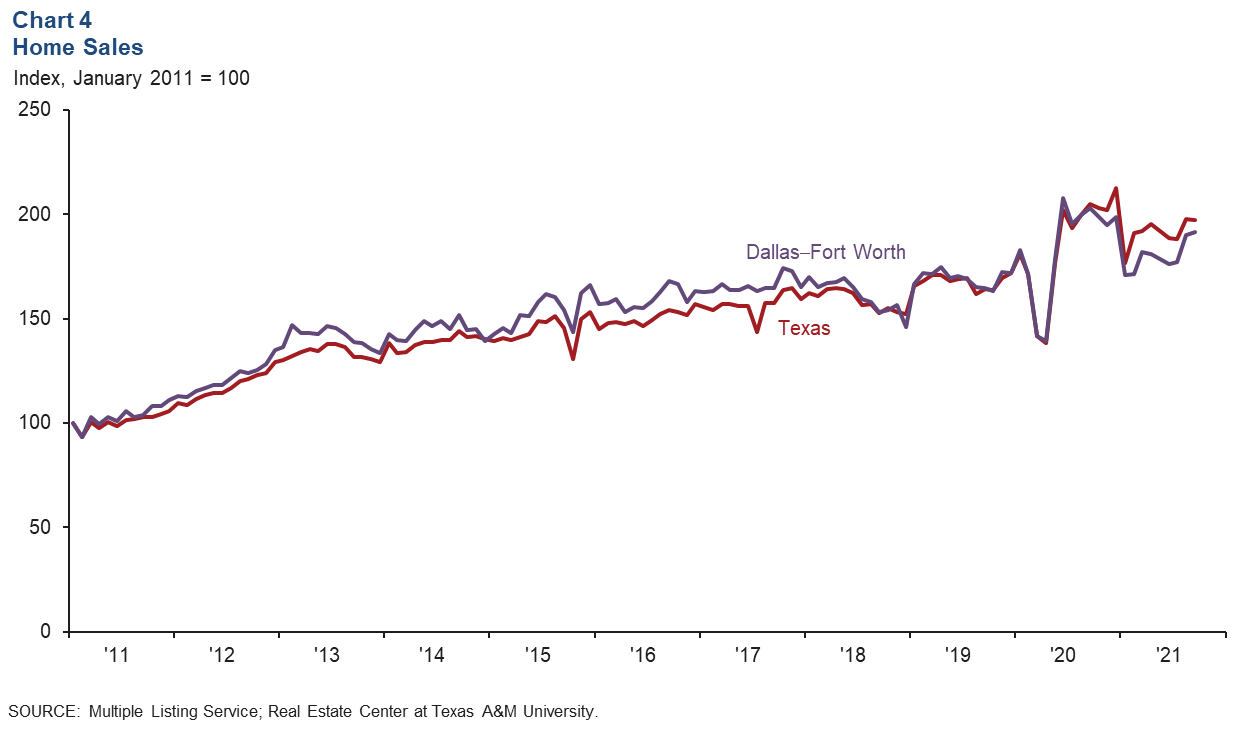
DFW existing-home sales rose 0.9 percent in October after strong growth in September (Chart 4). Sales of homes priced above $300,000 saw continued healthy increases, while sales of homes priced below $300,000 were flat to down. Statewide, existing-home sales dipped 0.3 percent. According to business contacts, new-home sales remained solid but were not as frantic as earlier in the year. Sales are being supported in part by near-record-low mortgage rates. Through October, existing-home sales are up 1.5 percent in DFW and 8.4 percent in Texas compared with the same period in 2020. Both new and active home listings on the Multiple Listing Service (MLS) continued their downward trend in October, and DFW existing-home inventories stayed tight at 1.1 months of supply.
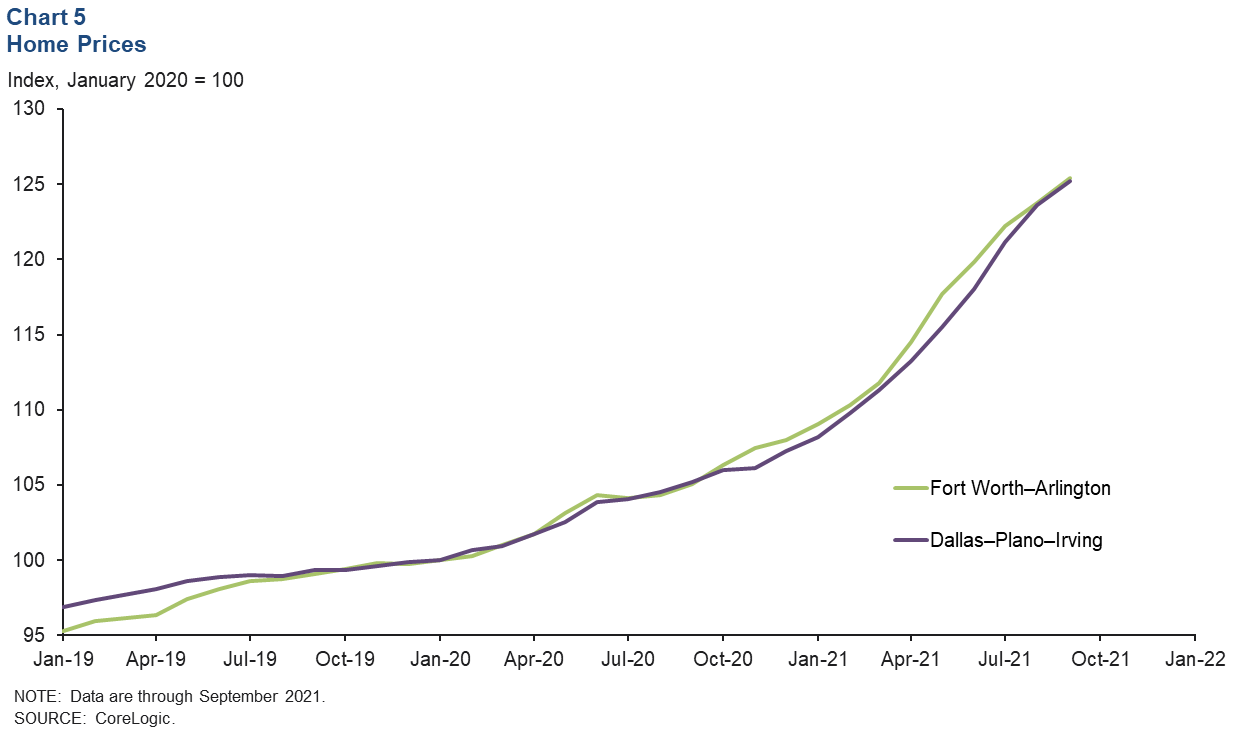
Home Prices Set New Highs
Record sales, tight inventories and rapidly rising construction costs continue to boost home prices. In September, home prices rose 1.3 percent in Dallas and 1.4 percent in Fort Worth, according to CoreLogic’s Home Price Index (Chart 5). U.S. prices similarly saw increases of 1.1 percent. Year over year, prices climbed 19.0 percent in Dallas, 19.4 percent in Fort Worth and 18.0 percent in the U.S. According to data from MLS, the nominal median sales price reached an all-time high of $381,422 in Dallas and $317,749 in Fort Worth in October.
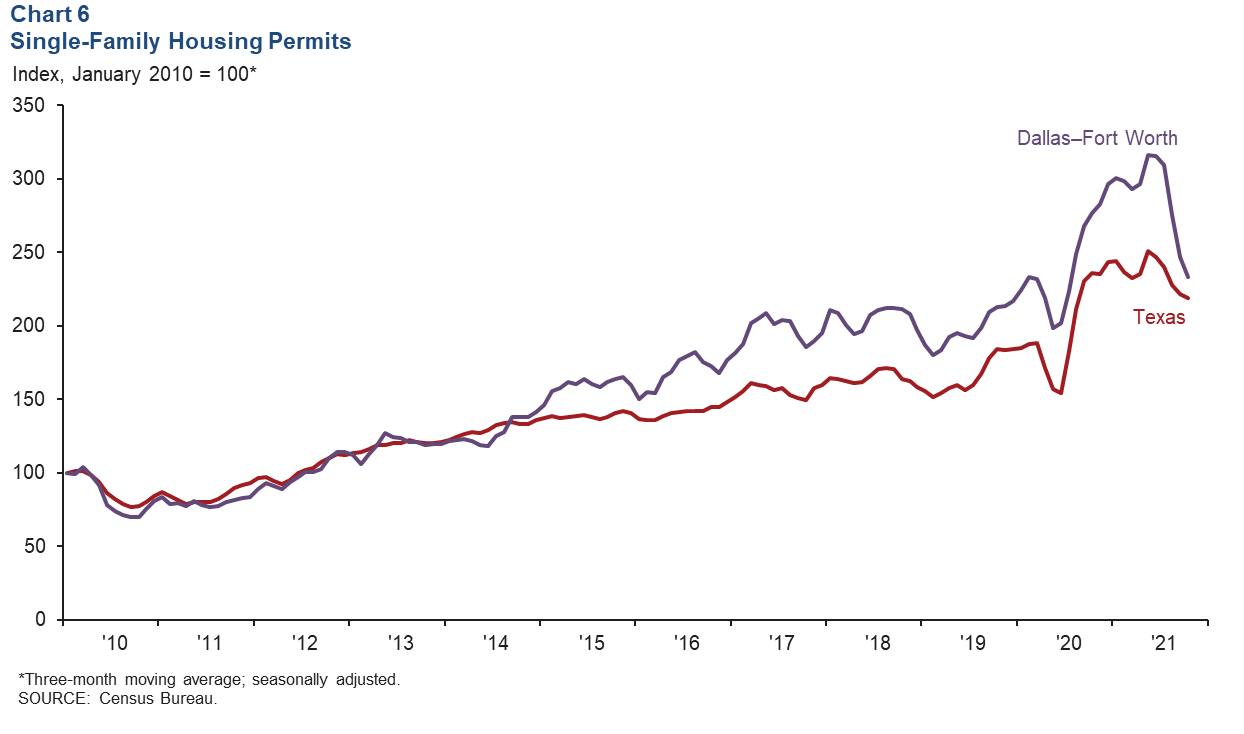
Growth in Single-Family Construction Slows
Single-family permit issuance, which leads home construction, rose in DFW and Texas for the second straight month in October following declines in summer. However, the three-month moving average continued to slide (Chart 6). Homebuilders noted that tight lot supply and shortages of labor and materials have elongated building-cycle times and are restraining activity. However, homebuilding activity remains highly elevated; through October, single-family permits were up 17.7 percent in DFW and 18.5 percent in Texas compared with the same period in 2020. The metroplex remains one of the busiest markets in single-family construction among large U.S. metros. So far this year, nearly 40,840 single-family permits have been issued in the metroplex.
NOTE: Data may not match previously published numbers due to revisions.
About Dallas–Fort Worth Economic Indicators
Questions can be addressed to Laila Assanie at laila.assanie@dal.frb.org. Dallas–Fort Worth Economic Indicators is published every month after state and metro employment data are released.