Dallas-Fort Worth Economic Indicators

March 18, 2022
Dallas–Fort Worth’s economic expansion strengthened in January. Payroll employment rose at a rapid clip. The Dallas Business-Cycle Index advanced further, but the Fort Worth index dipped. Home sales rose in January, pushing up home prices to new highs. Housing affordability declined in fourth quarter 2021 due to higher home prices and mortgage rates.
Labor market
DFW employment rose an annualized 6.3 percent (20,100 jobs) in January, faster than December’s downwardly revised 0.5 percent (1,800) increase (Chart 1). Growth was mixed, with employment levels in the Dallas–Plano–Irving metro division climbing 9.9 percent (22,200) but contracting 2.2 percent (-2,100) in Fort Worth–Arlington. Texas employment grew 3.6 percent in January, similar to December’s 3.4 percent increase.
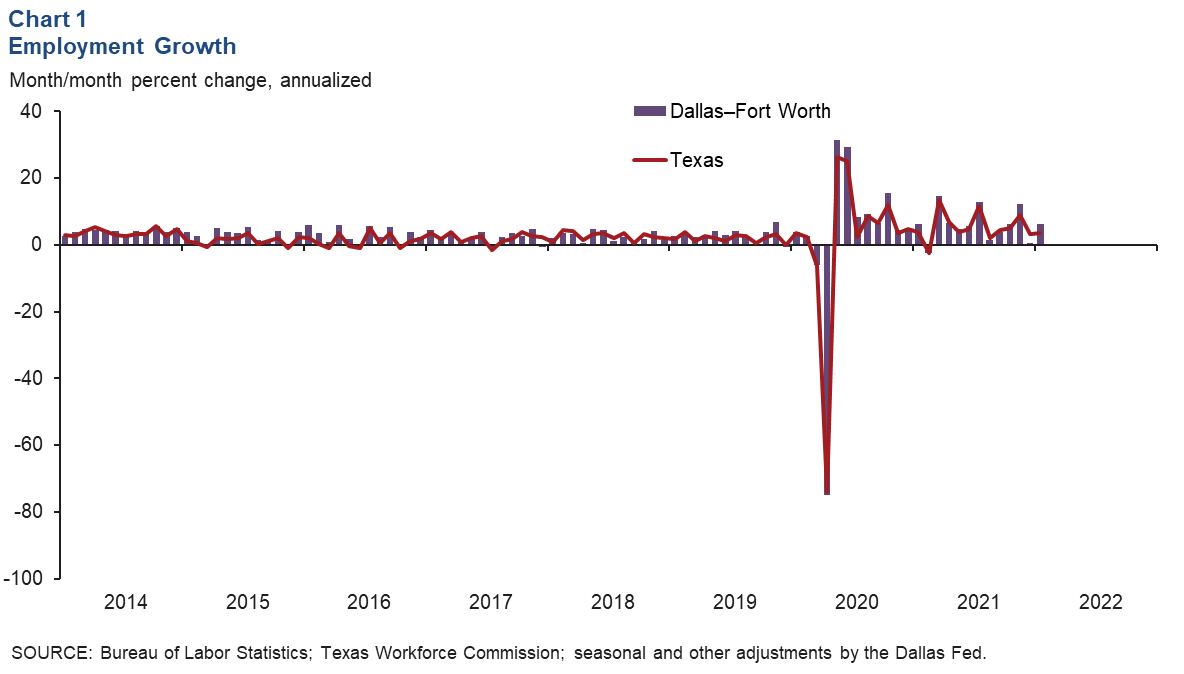
The January data, which incorporate the annual benchmark revision, show that DFW employment expanded a rapid 5.9 percent (218,000 jobs) last year, helping the metroplex regain its prepandemic level of employment by July 2021 (previously estimated to be fall 2021). In January, the jobless rate held steady in Dallas at 3.9 percent and rose in Fort Worth to 4.1 percent. Texas unemployment rate was unchanged at 4.8 percent.
Business-cycle index
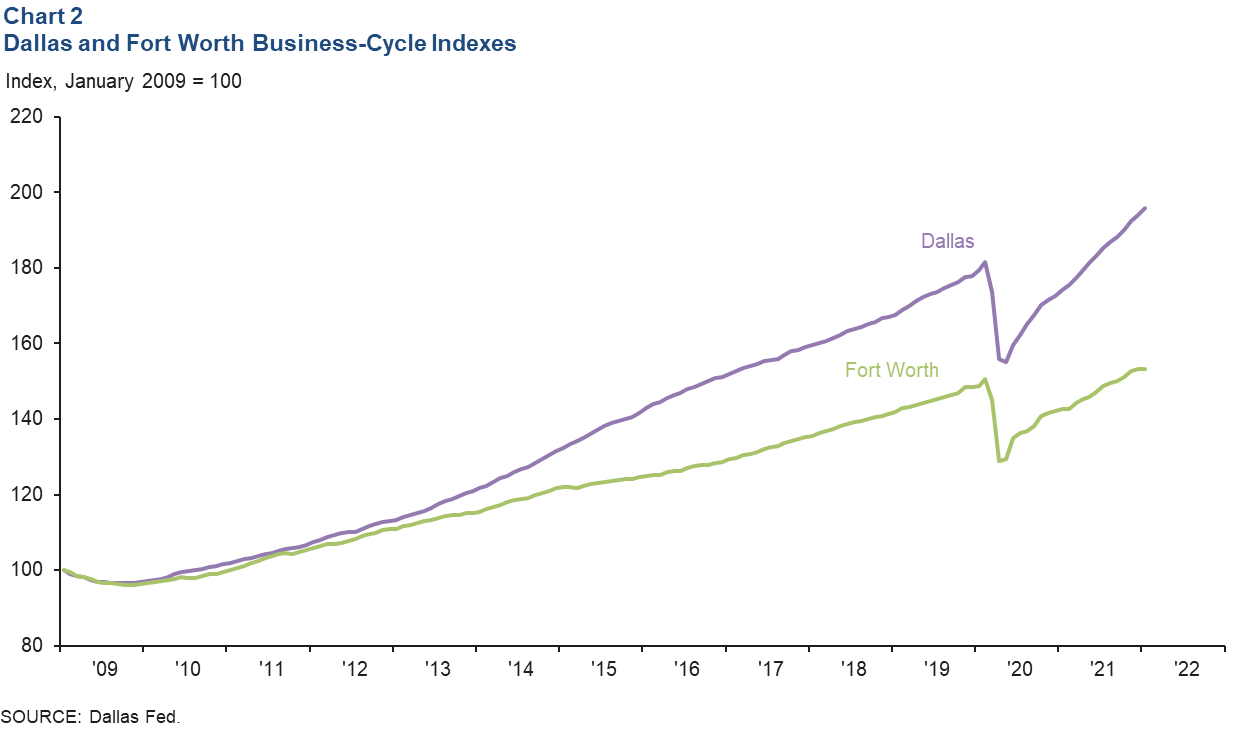
Movements in the Dallas and Fort Worth business-cycle indexes were mixed in January. The Dallas index climbed an annualized 10.6 percent, marking the 20th straight month of growth, and was up 7.9 percent from its February 2020 level (Chart 2). The Fort Worth index fell 1.5 percent (annualized) in January—breaking a 10-month positive streak—but was 1.7 percent higher than its prepandemic peak.
Housing
Home sales rise
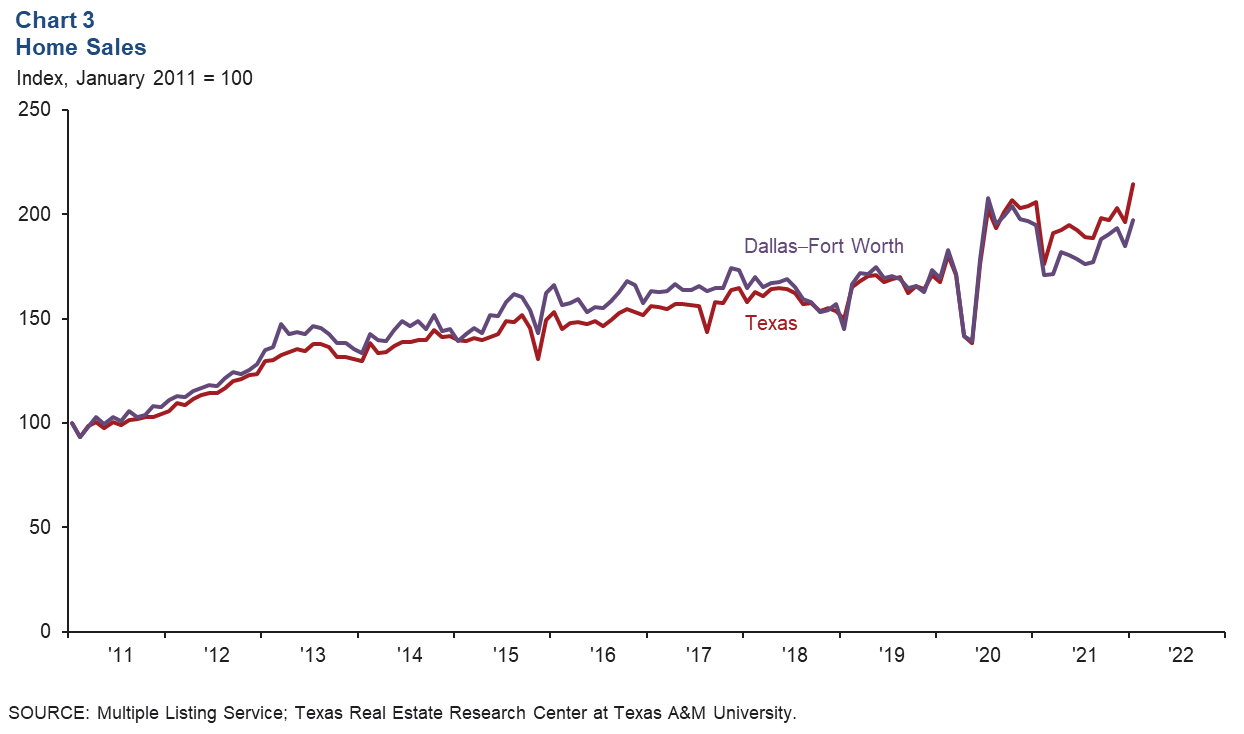
DFW existing-home sales rose 6.7 percent in January following a drop in the prior month (Chart 3). Statewide, existing-home sales climbed 9.3 percent. According to business contacts, new-home sales remained solid as well despite an increase in mortgage rates. Last year, existing-home sales were 0.2 percent higher in DFW and 6.3 percent higher in Texas compared with 2020 totals. Active home listings on the Multiple Listing Service (MLS) continued their downward trend in January, and DFW existing-home inventories stayed extremely tight—less than one month of supply.
Home prices surge higher
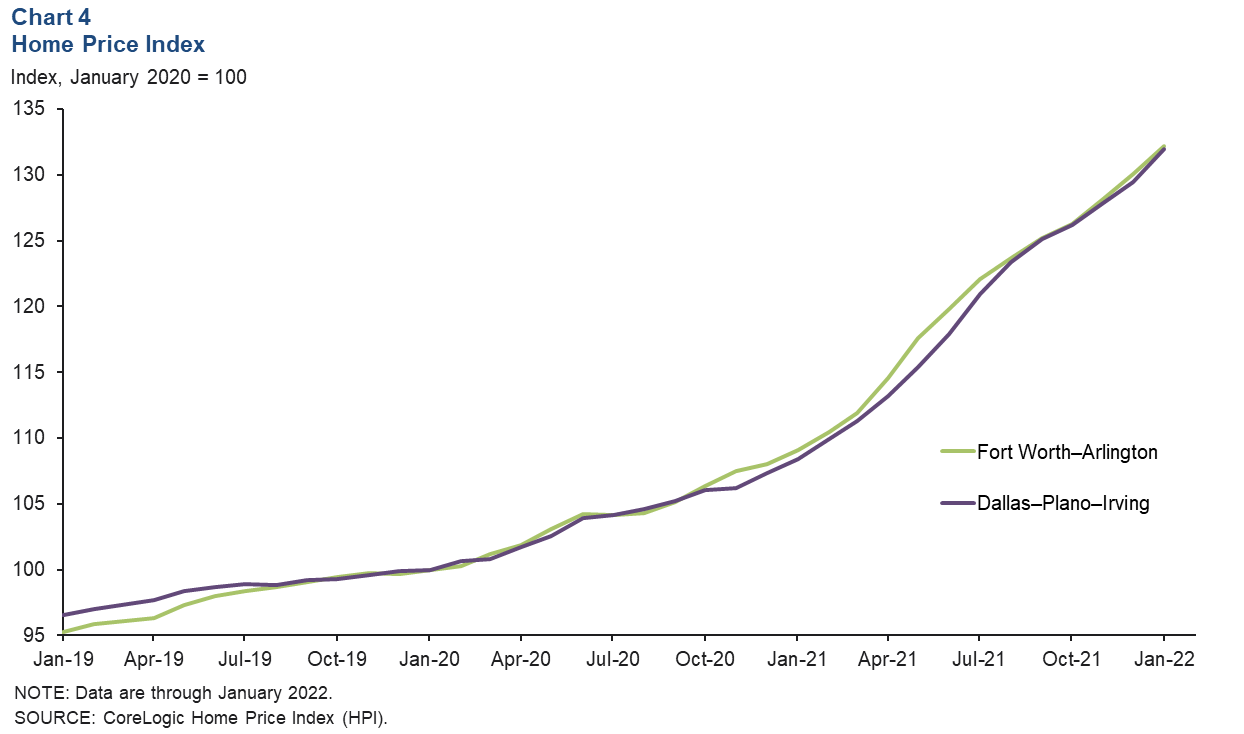
Strong demand, tight inventories and rapidly rising construction costs continue to boost home prices. Home prices continued their upward trend in January, rising 1.9 percent in Dallas and 1.6 percent in Fort Worth, according to CoreLogic’s Home Price Index (Chart 4). U.S. prices similarly saw increases of 1.4 percent. Year over year, prices were up 20.6 percent in Dallas, 20.4 percent in Fort Worth and 19.1 percent nationwide. According to data from MLS, the nominal median sales price in Dallas reached an all-time high of $403,449 in Dallas and $344,583 in Fort Worth in January. CoreLogic forecasts U.S. house price growth to moderate to 3.8 percent this year.
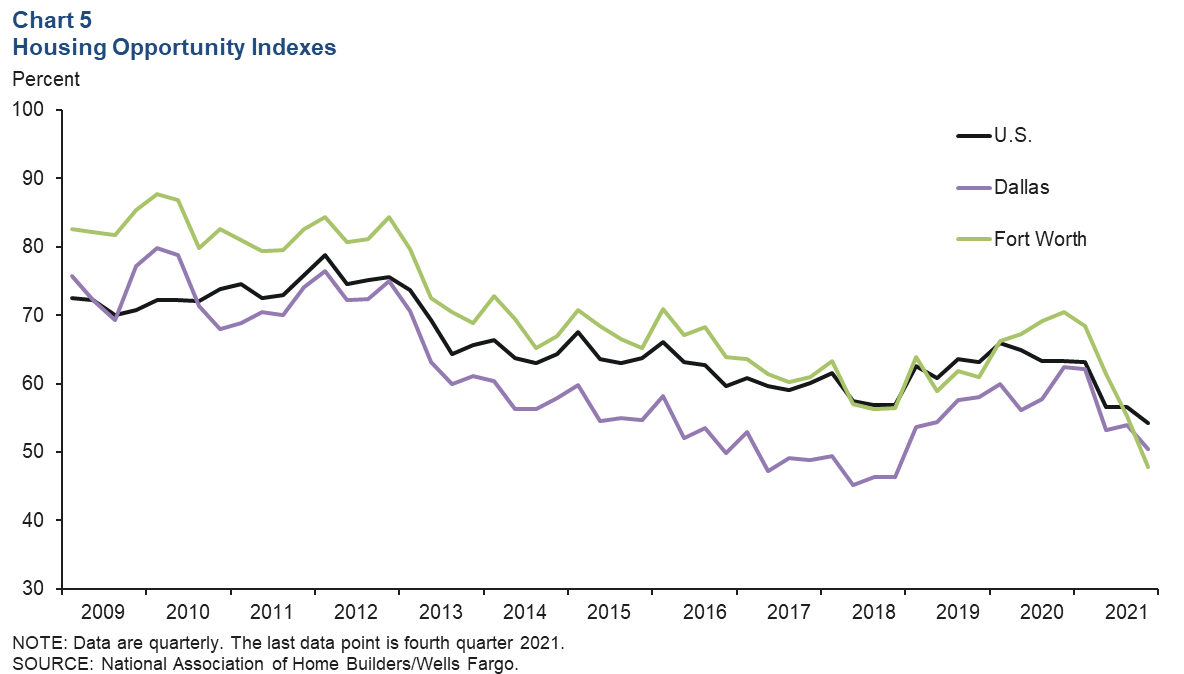
Housing affordability declines
Amid a hot housing market, housing affordability in Dallas dipped from 54 percent to 50.4 percent in fourth quarter 2021 after increasing 0.8 percentage points in the third quarter (Chart 5). Affordability in Fort Worth slid further to 47.8 percent in the fourth quarter, down 7.5 percentage points from the previous quarter. Housing affordability is defined as the percentage of homes sold that the median-income household can afford. Affordability fell at the national level from 56.6 percent to 54.2 percent. Since fourth quarter 2020, housing affordability has retracted 12.0 percentage points in Dallas, 22.7 percentage points in Fort Worth and 9.1 percentage points in the nation.
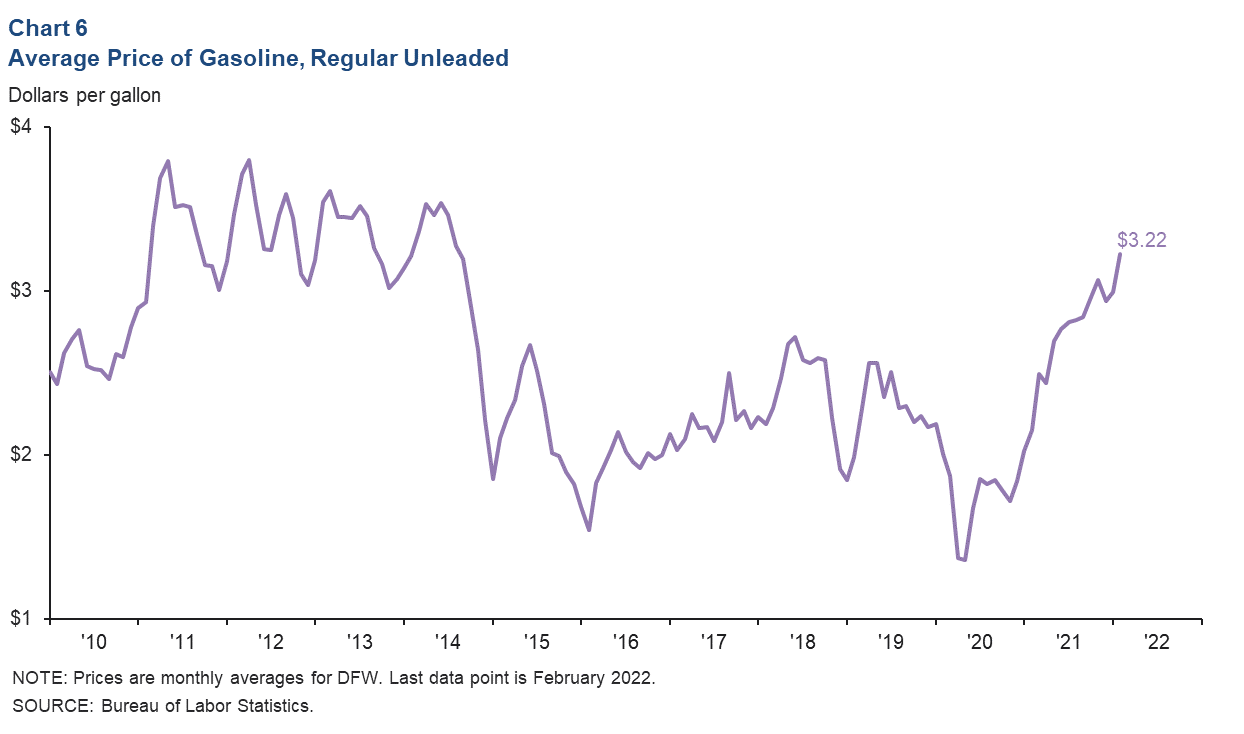
Fuel prices
Inflation remained on the forefront of consumers’ minds, with gasoline prices spiking in recent weeks due to the Russia–Ukraine conflict. The average price of regular unleaded gasoline in DFW rose to $3.22 per gallon in February, up 7.8 percent from the previous month (Chart 6). Gasoline prices in DFW are at their highest level since mid-2014.
NOTE: Data may not match previously published numbers due to revisions.
About Dallas–Fort Worth Economic Indicators
Questions can be addressed to Laila Assanie at laila.assanie@dal.frb.org. Dallas–Fort Worth Economic Indicators is published every month after state and metro employment data are released.