Dallas-Fort Worth Economic Indicators

September 2, 2022
Broad-based expansion continued in the Dallas–Fort Worth economy in July. Payroll employment grew at a rapid clip, bolstering growth in the Dallas and Fort Worth business-cycle indexes. Home sales fell for the sixth straight month. Home-price appreciation remained strong in the second quarter, and housing affordability plunged due to a sharp increase in mortgage rates.
Labor market
Robust job growth continues
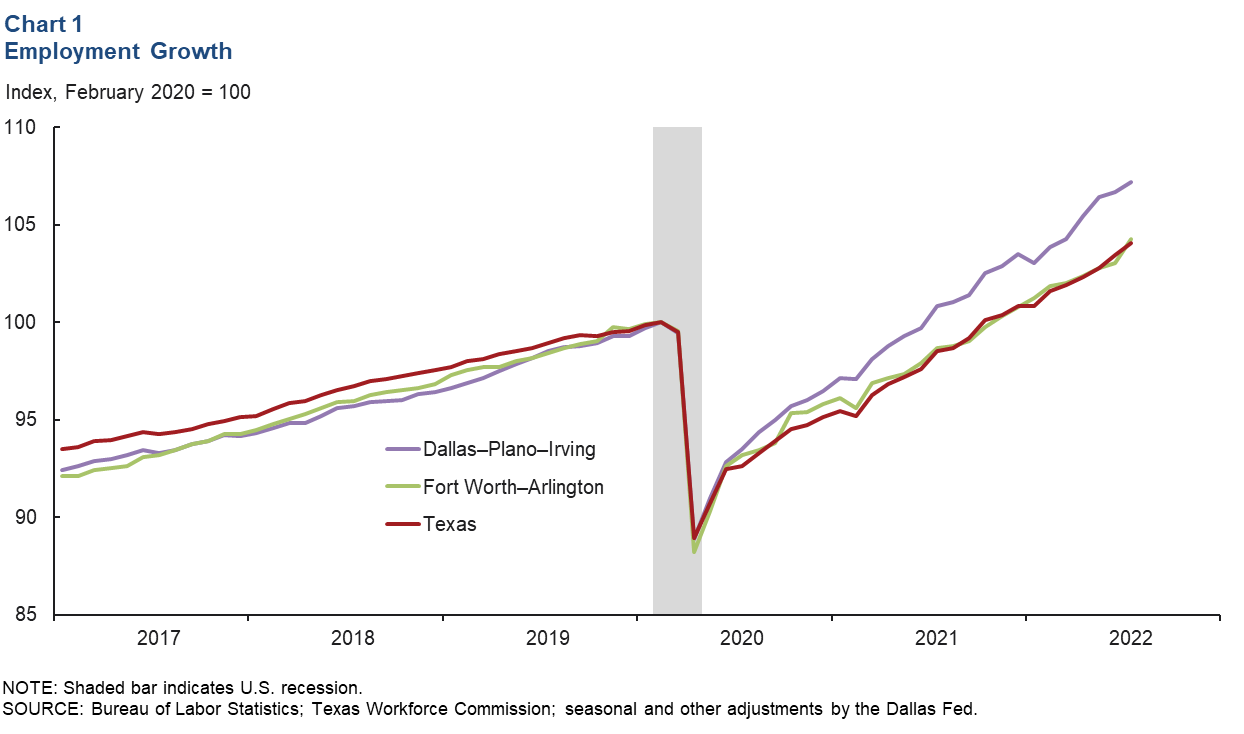
DFW employment rose an annualized 8.5 percent (27,700 jobs) in July, faster than June’s 3.1 percent increase. Payrolls in the leisure and hospitality sector posted the fastest growth, followed by information services, education and health services, and construction and mining. Employment levels expanded 6.0 percent (14,400) in the Dallas–Plano–Irving metro division and 14.9 percent (13,300) in Fort Worth–Arlington. Two and half years from the onset of the pandemic, DFW employment exceeds the February 2020 peak by 6.4 percent (245,400 jobs). Employment in the Dallas–Plano–Irving metro division was 7.2 percent (198,100) above prepandemic levels, and the Fort Worth–Arlington division’s employment was 4.3 percent (47,300) higher than prepandemic levels (Chart 1). Payrolls in Texas were 4.1 percent higher than their prepandemic high.
Unemployment low
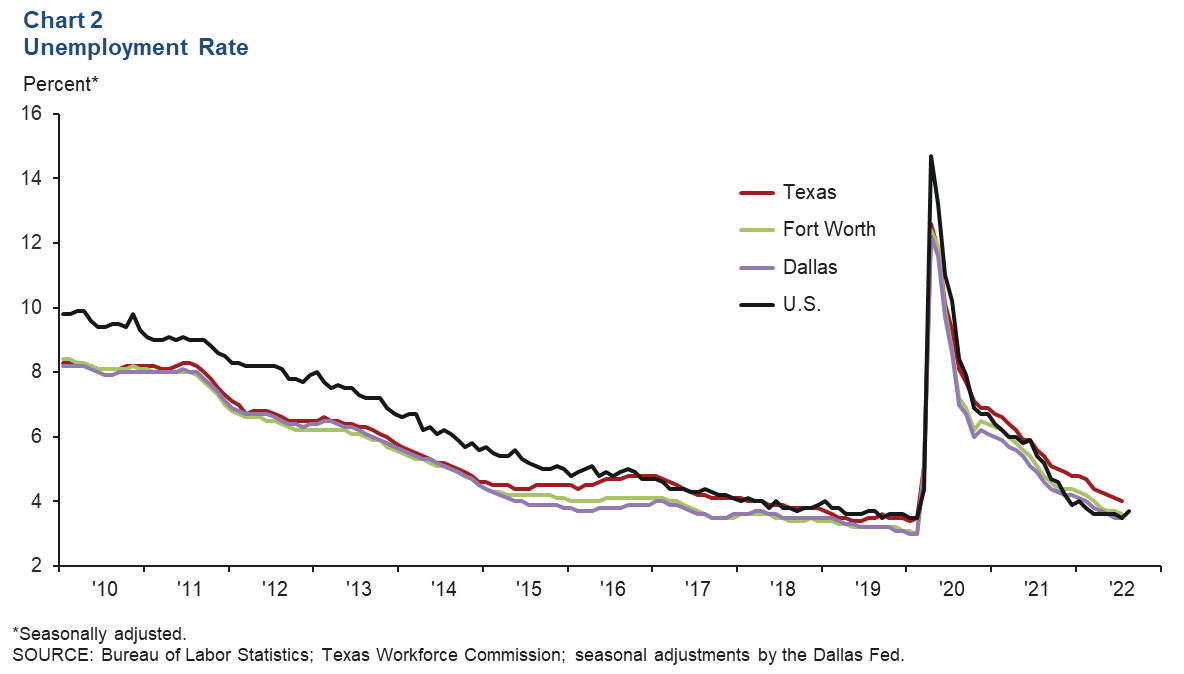
The DFW labor market continued to be tight, with unemployment close to prepandemic lows. In July, the unemployment rate held steady at 3.5 percent in Dallas and edged down to 3.6 percent in Fort Worth (Chart 2). The jobless rate in Texas dipped to 4.0 percent in July, while in the U.S. it rose to 3.7 percent in August. The labor force expanded an annualized 2.4 percent in Dallas and 2.1 percent in Fort Worth, in line with the state’s 2.3 percent rise.
Business-cycle indexes
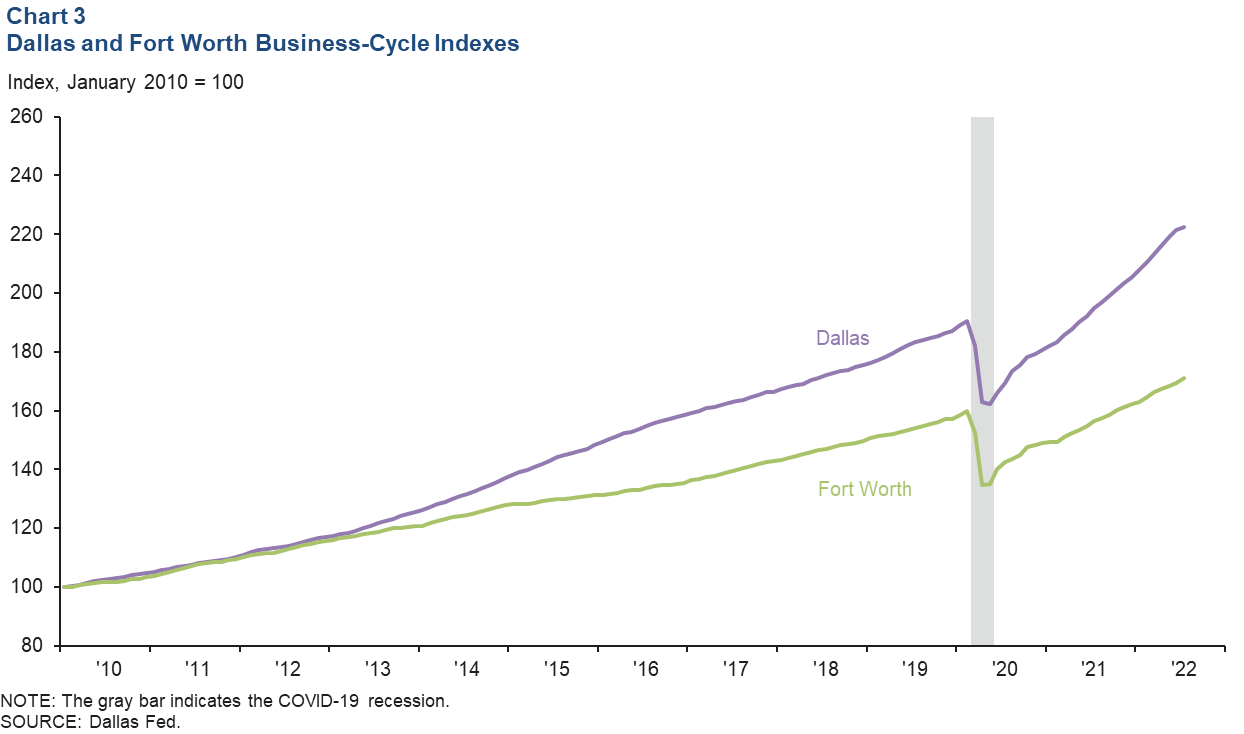
The Dallas and Fort Worth business-cycle indexes continued to expand in July, marking their 26th straight month of increases. Growth in the indexes has been buoyed by sustained solid job gains in the metroplex. The Dallas index climbed an annualized 7.1 percent and was up 16.7 percent from its prepandemic peak (Chart 3). The Fort Worth index rose an annualized 14.6 percent, surpassing its prepandemic high by 7.2 percent.
Housing
Existing-home sales drop further
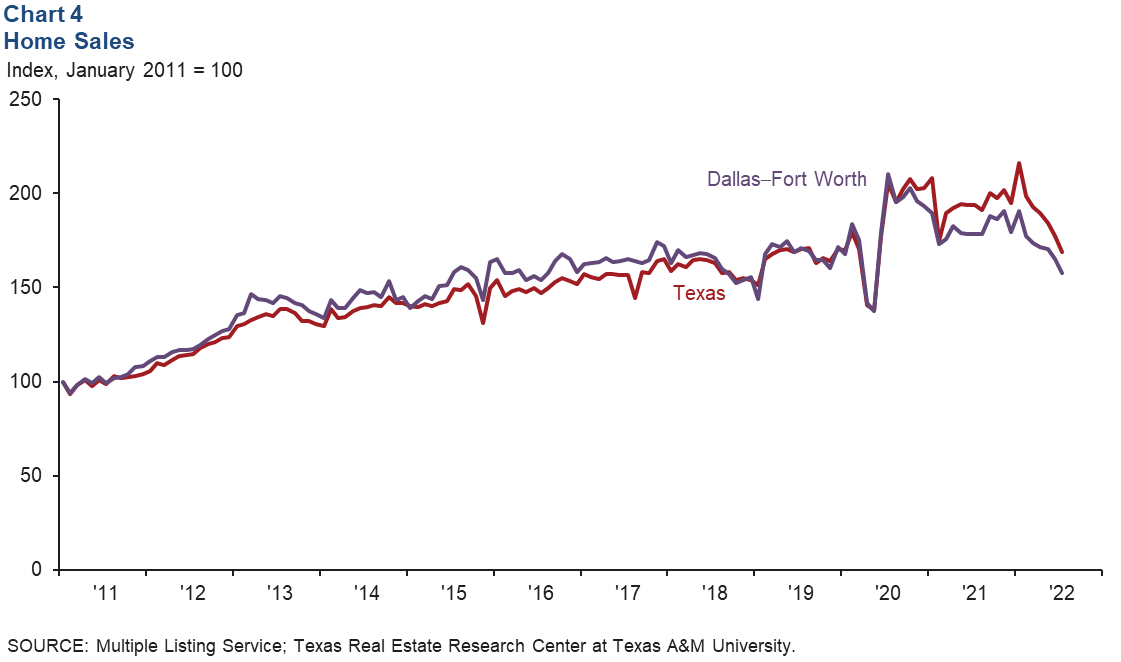
DFW existing-home sales contracted for the sixth consecutive month in July, falling 4.3 percent (Chart 4). Statewide, existing-home sales fell at a similar pace, down 4.6 percent. Year over year in July, sales were down 11.5 percent in DFW and 12.7 percent in Texas. According to business contacts, new-home sales have slowed notably too, dampened by higher mortgage rates and record-high prices. Cancellations are up, and incentives are becoming more widespread. DFW existing-home inventories ticked up to 1.8 months of supply but remained just below the Texas average of 2.2 months.
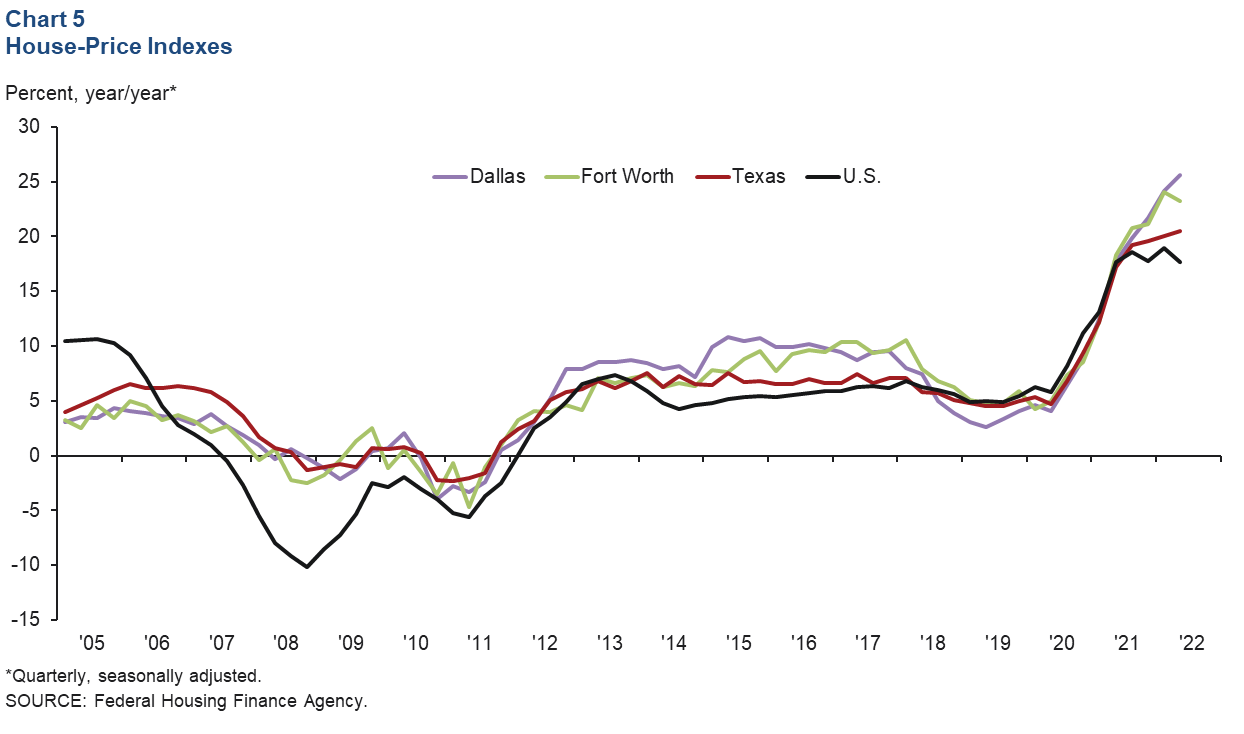
Home prices appreciate rapidly
Home prices in DFW rose at a near-record pace, according to the Federal Housing Finance Agency’s Purchase-Only House Price Index. Year-over-year price increases in the second quarter were at or close to historical highs, up 25.6 percent in Dallas, 23.2 percent in Fort Worth, 20.5 percent in Texas and 17.7 percent in the U.S. (Chart 5). Prices rose at a rapid clip in the second quarter, increasing 6.3 percent in Dallas and up 5.7 percent in Fort Worth. The U.S. and Texas similarly saw swift price increases of 4.0 percent and 5.2 percent, respectively.
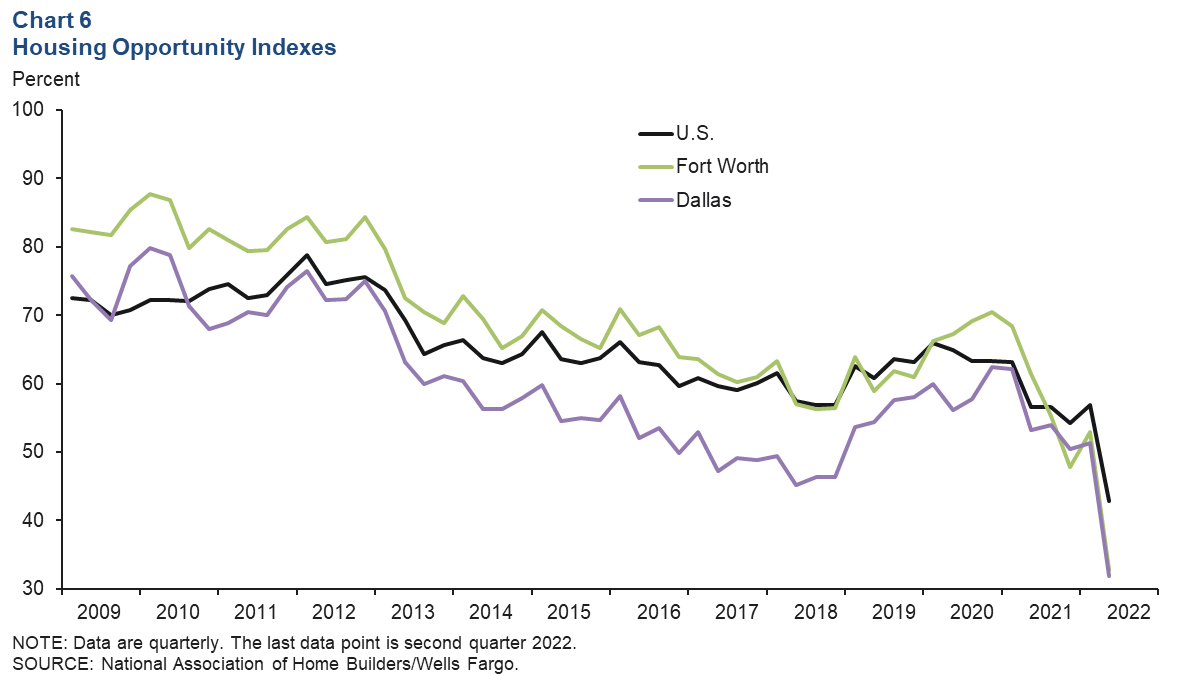
Affordability plunges in second quarter
Housing affordability nosedived in the second quarter due to a combination of high home prices and climbing mortgage rates (Chart 6). In Dallas, the share of homes sold that the median-income household could afford plummeted from 51.3 percent in the first quarter to 31.9 percent in the second. Affordability in Fort Worth sunk by 20.3 percentage points to 32.7 percent in the second quarter. The decline in affordability was starker in DFW relative to the U.S., where affordability fell 14.1 percentage points. In July, the real median home-sales price edged down to $404,284 in DFW, though year-over-year appreciation was slightly elevated at 7.5 percent.
NOTE: Data may not match previously published numbers due to revisions.
About Dallas–Fort Worth Economic Indicators
Questions can be addressed to Laila Assanie at laila.assanie@dal.frb.org. Dallas–Fort Worth Economic Indicators is published every month after state and metro employment data are released.