Dallas-Fort Worth Economic Indicators

March 24, 2023
| DFW economy dashboard (January 2023) | |||
| Job growth (annualized) Oct. '22–Jan. '23 |
Unemployment rate |
Avg. hourly earnings |
Avg. hourly earnings growth y/y |
| 3.8% | 3.4% | $34.16 | 1.4% |
The Dallas–Fort Worth economy continues to expand. Payroll employment grew strongly in January, and unemployment held steady. Multifamily permit issuance fell further in January but remained elevated. Apartment demand was weak, while rents were stable in February. Housing affordability declined in fourth quarter 2022, though home price appreciation slowed.
Labor market
Payroll gains stay solid
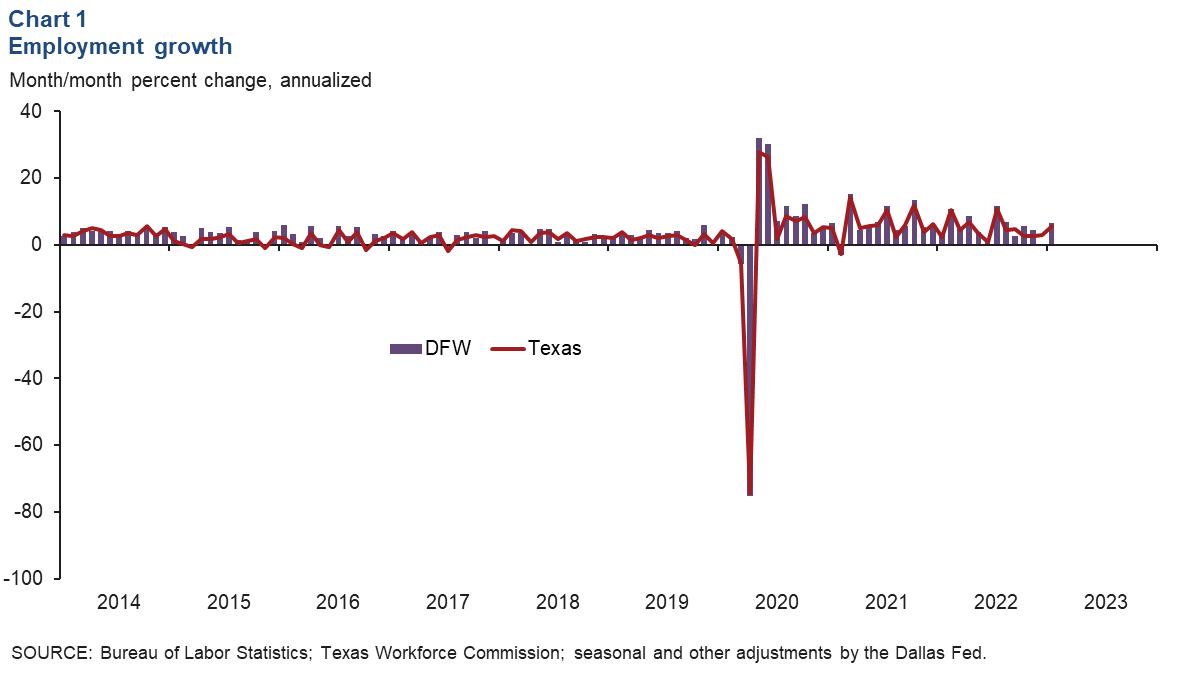
DFW employment grew an annualized 6.6 percent in January (Chart 1). Payrolls rose 6.8 percent in Dallas and 6.3 percent in Fort Worth, faster than the state’s 5.7 percent increase. The unemployment rate was unchanged at 3.4 percent in DFW, below the Texas and U.S. jobless rates of 3.9 percent and 3.6 percent, respectively. DFW private average hourly earnings ticked up to $34.16 in January and were up 1.4 percent over the 12-month period.
Benchmarking revises 2022 job growth up
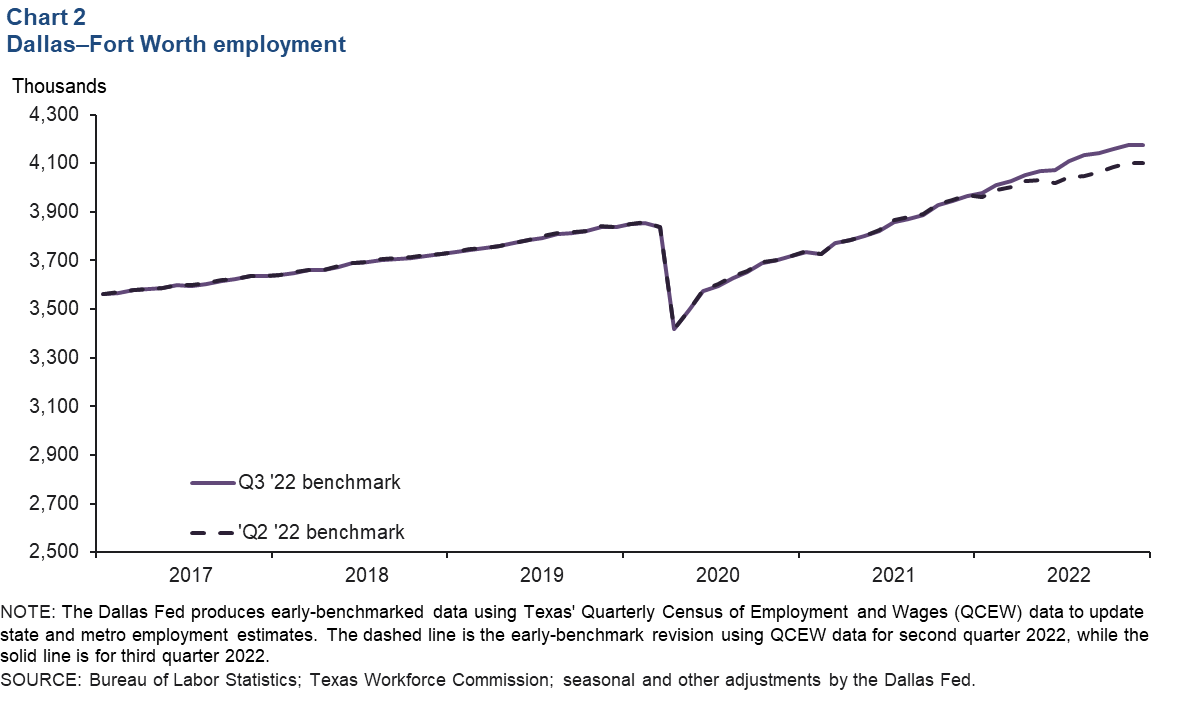
In March, the state and metro employment data were revised up during the Dallas Fed’s early benchmark process (Chart 2). The Dallas Fed uses the Quarterly Census of Employment and Wages, which covers over 95 percent of jobs, to update the monthly Current Employment Statistics with more complete data. For DFW, the second quarter 2022 benchmark indicated 3.4 percent job growth in 2022, while the third quarter benchmark shows a robust 5.3 percent increase.
Housing
Apartment demand remains subdued
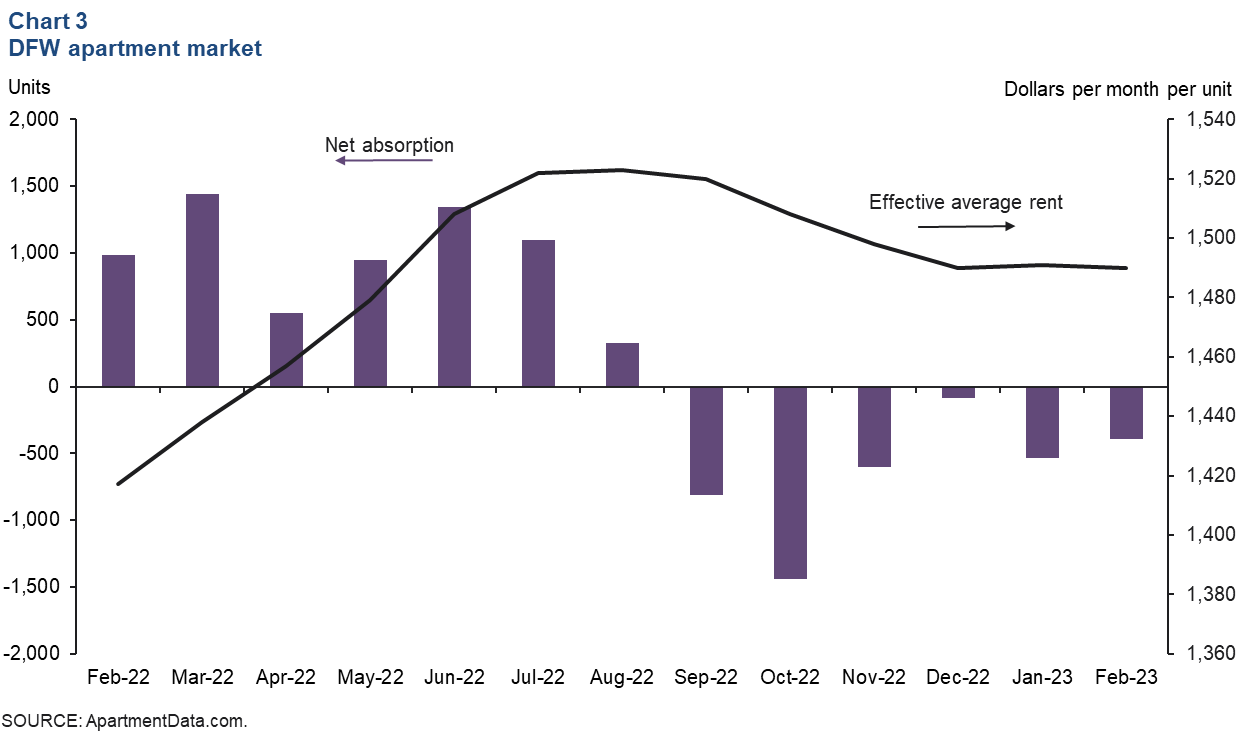
DFW apartment absorption was sluggish in early 2023. Net absorption was -396 units in February following a decline of 533 units in January (Chart 3). As demand moderated, effective monthly rents in DFW stabilized around $1,490 per unit in February, down from $1,523 in August 2022. Rents were still up 5.2 percent year over year. Occupancy edged down to 91.9 percent from 92.2 percent at year-end 2022.
Multifamily construction moderates
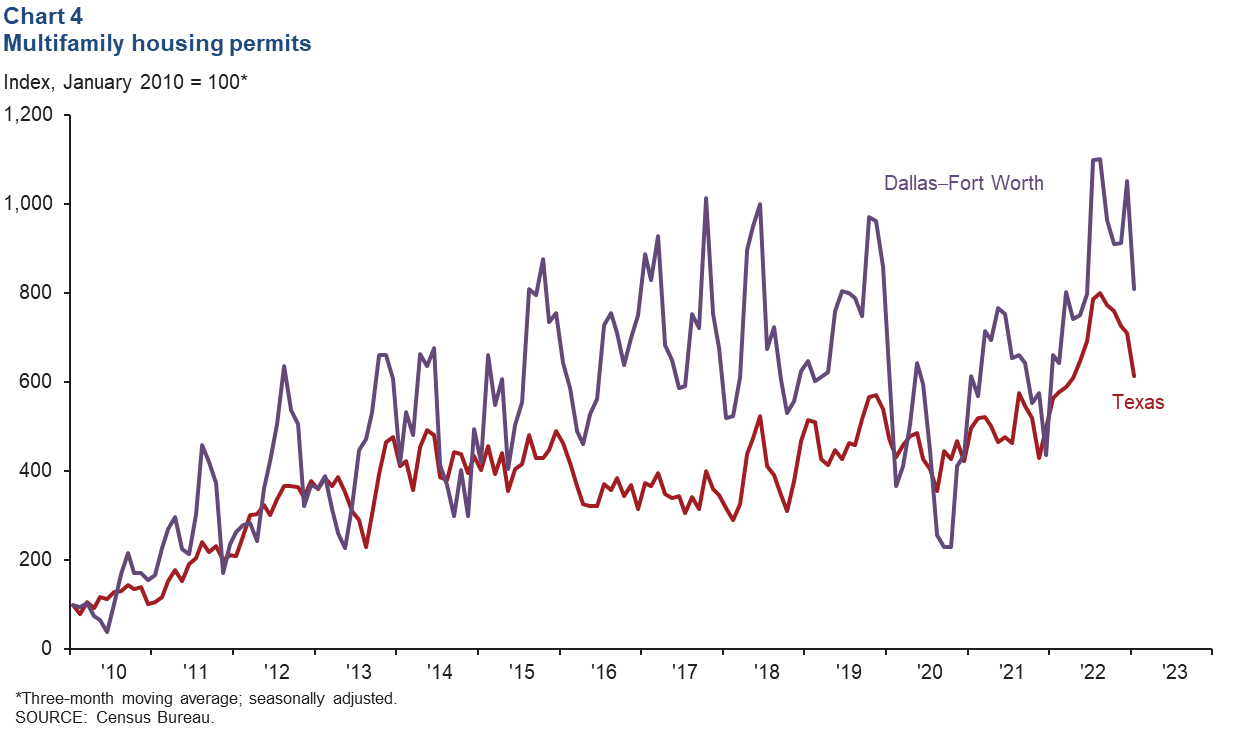
Multifamily permit issuance, which leads apartment construction, slowed in January (Chart 4). Permit issuance fell 20.2 percent in DFW and 3.3 percent in Texas. Despite the recent pullback, in part due to higher financing costs, DFW multifamily permit issuance remains elevated compared with historical levels. DFW is still among the busiest large U.S. metros in apartment construction.
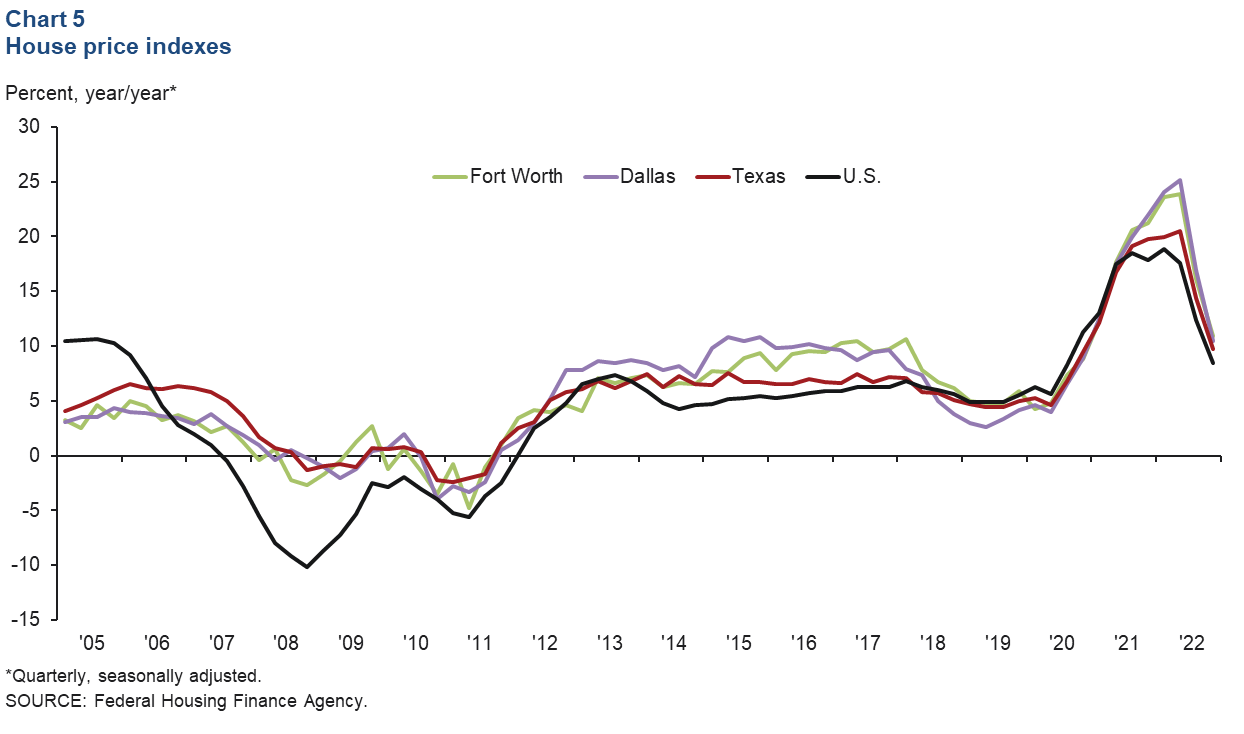
Home price appreciation cools at year-end
Home prices in DFW were relatively flat in fourth quarter 2022, according to recently released data from the Federal Housing Finance Agency. Compared with the third quarter, prices were little changed in DFW, Texas and the nation. Year-over-year price increases in the quarter slowed to 10.9 percent in Fort Worth, 10.5 percent in Dallas, 9.7 percent in Texas and 8.4 percent in the U.S. (Chart 5).
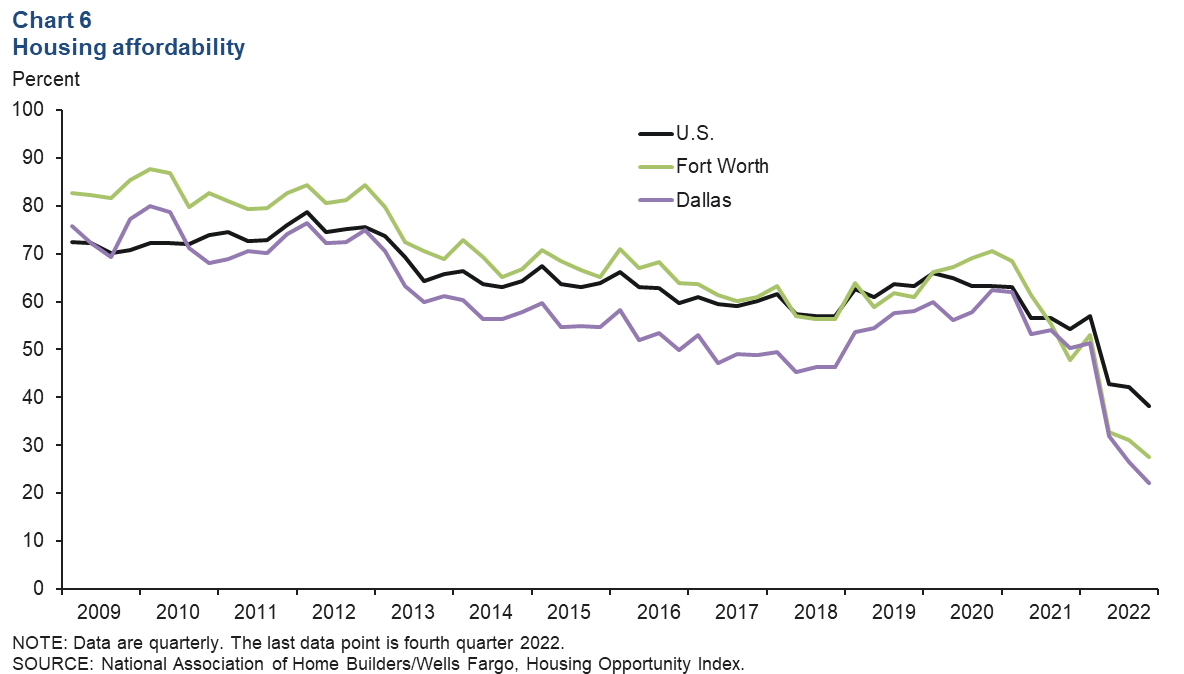
Affordability declines further
Recently released data show that housing affordability fell again due to high home prices and climbing mortgage rates (Chart 6). In Dallas, the share of homes sold that the median-income household could afford dropped from 26.6 percent in the third quarter of 2022 to 22.1 percent in the fourth. Affordability in Fort Worth dipped 3.5 percentage points to 27.5 percent in the fourth quarter. Affordability declined nationally as well. In February, the nominal median home sales price ticked up to $395,423 in DFW, and year-over-year appreciation was modest at 1.7 percent.
NOTE: Data may not match previously published numbers due to revisions.
About Dallas–Fort Worth Economic Indicators
Questions or suggestions can be addressed to Laila Assanie at laila.assanie@dal.frb.org. Dallas–Fort Worth Economic Indicators is published every month after state and metro employment data are released.