Dallas-Fort Worth Economic Indicators

| DFW economy dashboard (June 2023) | |||
Job growth (annualized) March–June '23 |
Unemployment rate |
Avg. hourly earnings |
Avg. hourly earnings growth y/y |
4.3% |
3.8% | $34.24 | 3.0% |
The Dallas–Fort Worth economy expanded in June as wages and employment grew and unemployment fell. Housing cooled, with existing-home sales declining and inventories staying flat.
Labor market
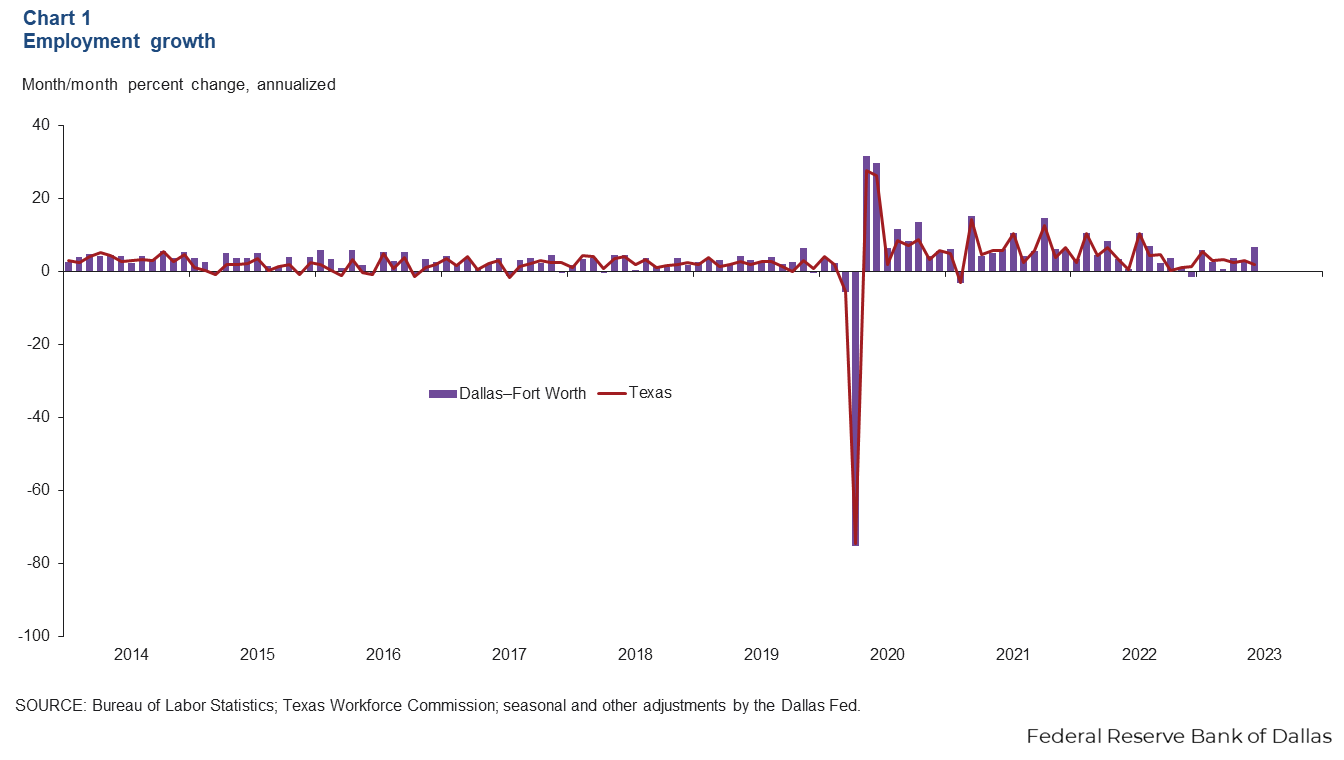
Job growth strong in June
DFW jobs grew an annualized 6.8 percent in June, up from May’s 2.7 percent growth and greater than Texas’ 2.1 percent gain (Chart 1). In the second quarter, DFW employment rose an annualized 4.3 percent, faster than the state’s 2.6 percent increase.
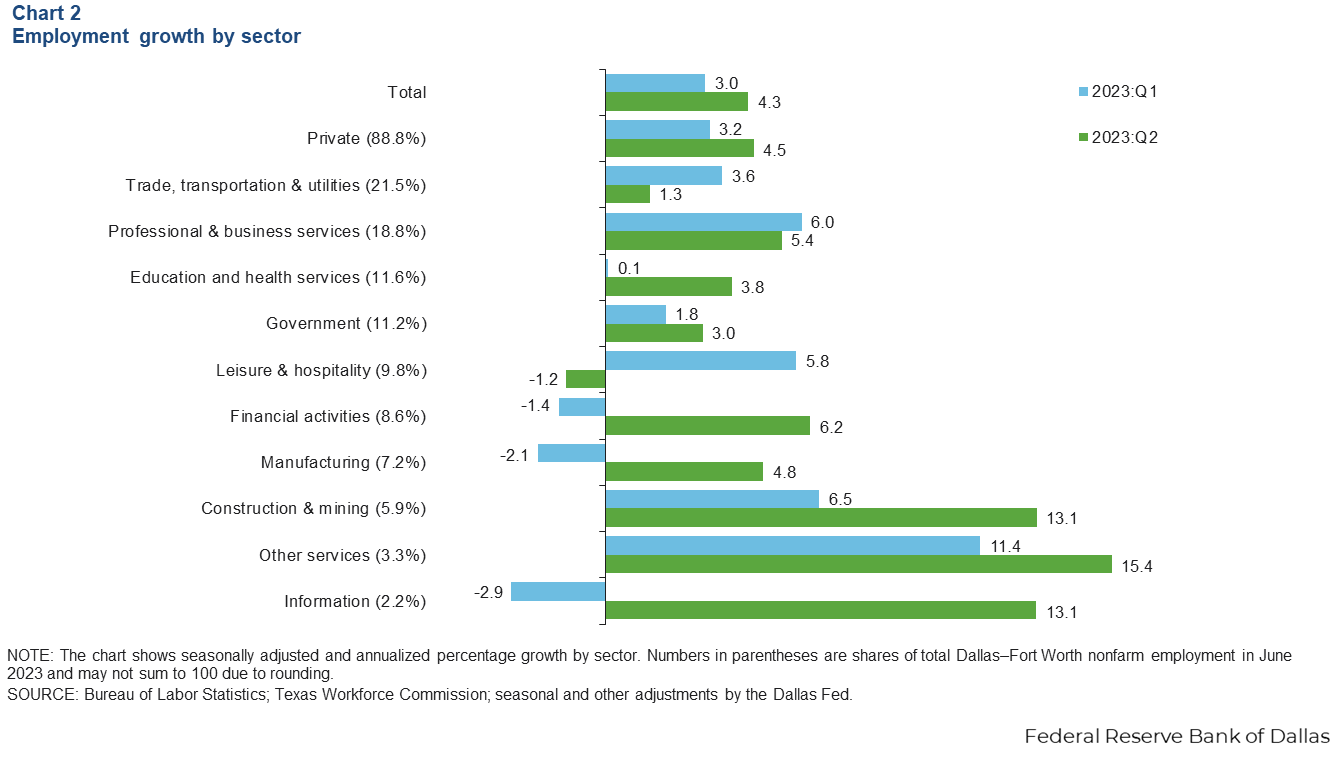
Job gains seen across sectors
Nearly all sectors grew in the second quarter of 2023 (Chart 2). Leading the growth were other services (15.4 percent, or 4,980 jobs), construction (13.1 percent, or 7,672 jobs) and the information sector (13.1 percent, or 2,849 jobs). The only sector that fell in the quarter was leisure and hospitality (1.2 percent, or 1,227 jobs). The DFW unemployment rate declined to 3.4 percent in June and remains below the state’s jobless rate of 4.1 percent.
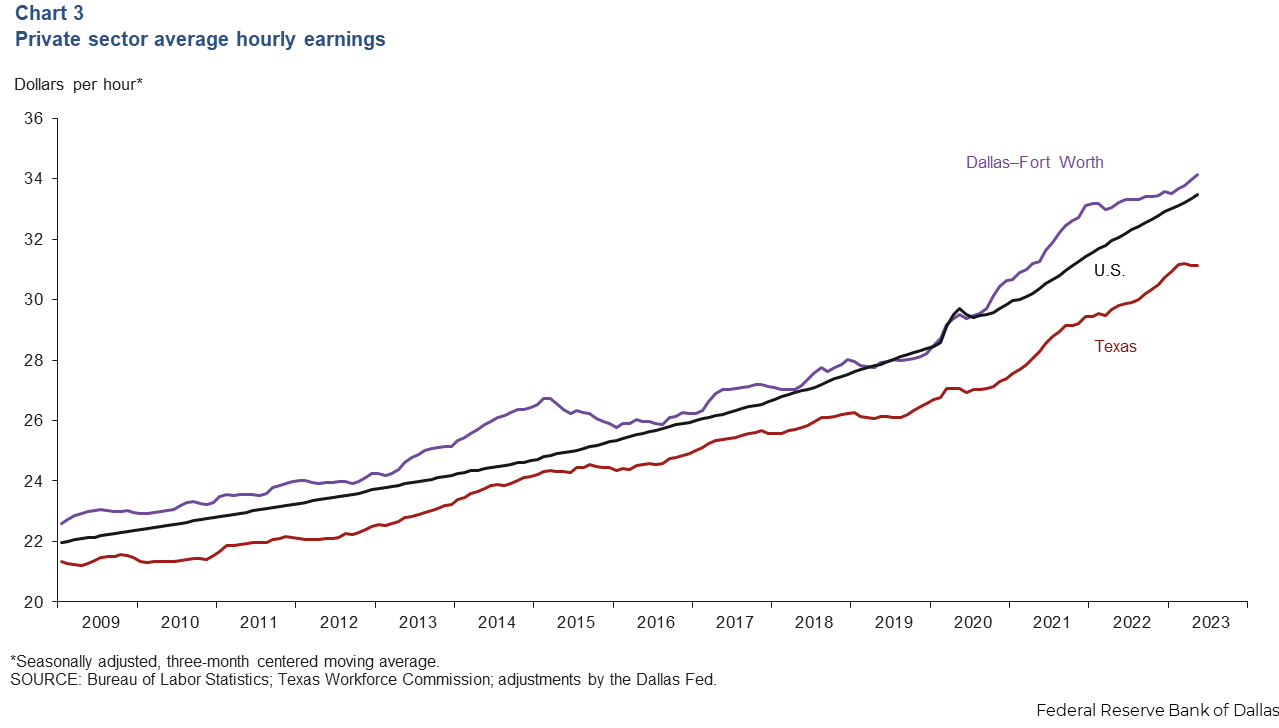
Hourly wages tick up
DFW average private hourly earnings were $34.24 in June, up from May’s figure of $33.75. The three-month moving average for hourly earnings ticked up to $34.12 and remained above both the state average of $31.13 and the national average of $33.46 (Chart 3). In the past year, average wages in DFW have increased 3.0 percent, narrower than gains of 5.0 percent in Texas and 4.4 percent in the U.S.
Housing
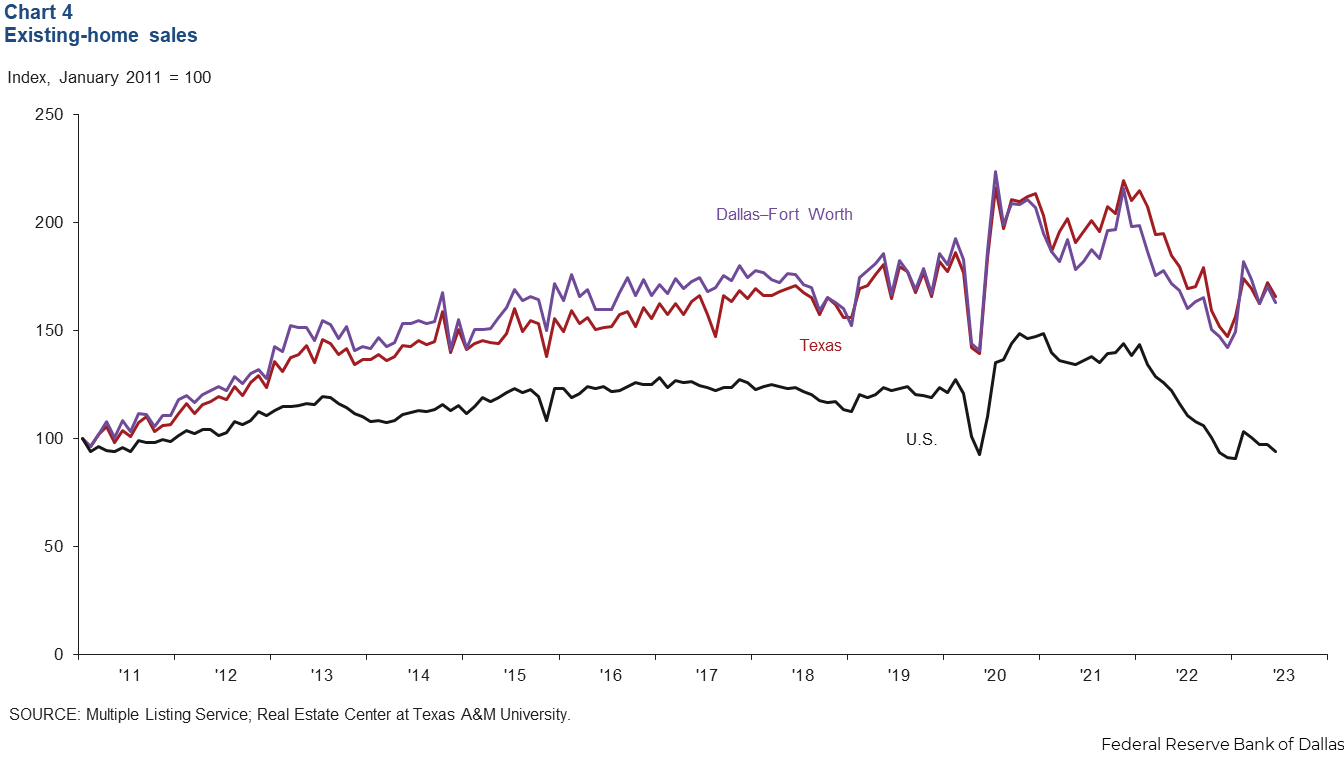
Existing-home sales decline
Activity in the housing market weakened. DFW existing-home sales declined 4.3 percent following 4.8 percent growth in May (Chart 4). Statewide sales dropped 3.9 percent, while sales fell 3.3 percent nationally. According to business contacts, solid demand continues, particularly for quick move-in and inventory (speculative) homes. Prices are largely stable, and incentives such as rate buydowns remain on offer.
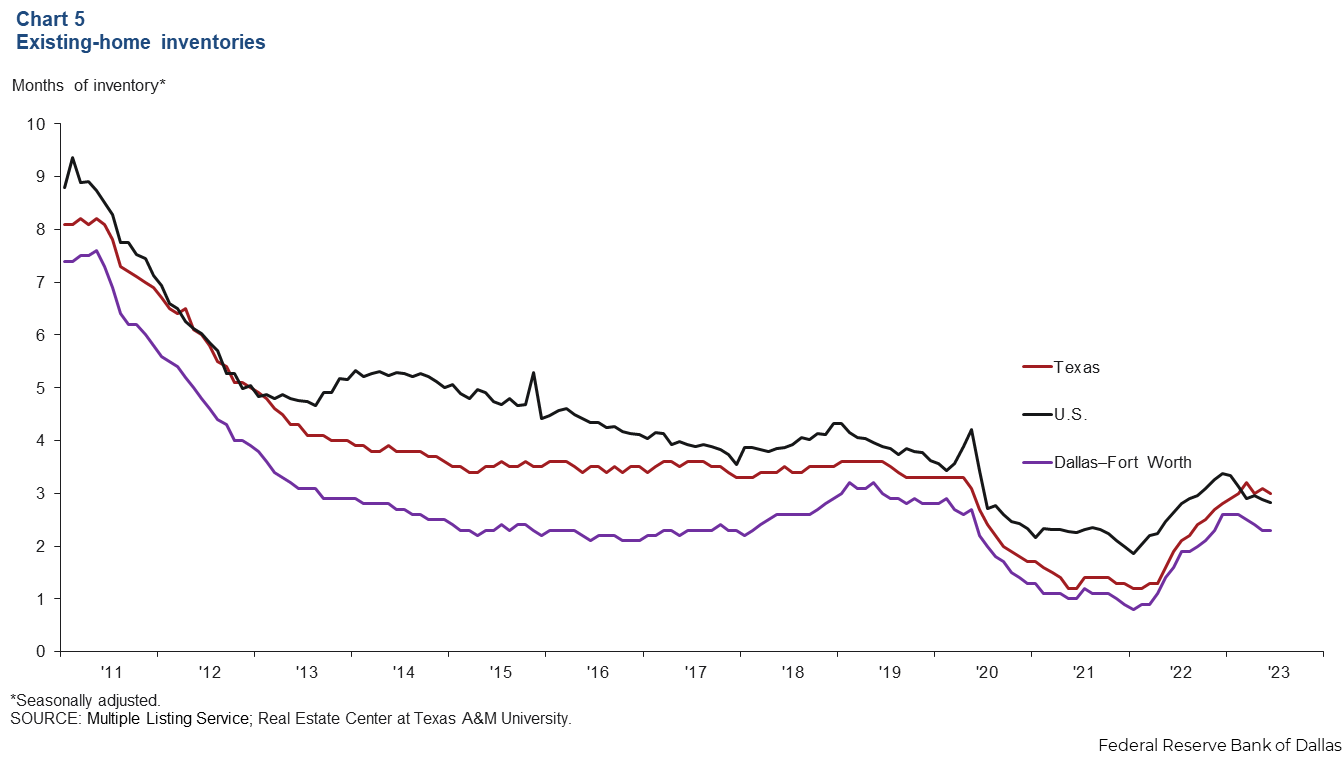
Home inventories remain low
DFW home inventories were flat in June as sales fell. Existing-home inventories remained at 2.3 months in DFW, while inventory levels ticked down to 3.0 months for the state and 2.8 months for the nation (Chart 5). Inventories in North Texas, Texas and the U.S. remain tight and below the six-month benchmark for a normal market.
NOTE: Data may not match previously published numbers due to revisions.
About Dallas–Fort Worth Economic Indicators
Questions or suggestions can be addressed to Laila Assanie at laila.assanie@dal.frb.org. Dallas–Fort Worth Economic Indicators is published every month after state and metro employment data are released.