Dallas-Fort Worth Economic Indicators

| DFW economy dashboard (August 2023) | |||
Job growth (annualized)
May–Aug. '23 |
Unemployment rate |
Avg. hourly earnings |
Avg. hourly earnings growth y/y |
5.1% |
3.9% | $33.69 | 1.1% |
The Dallas–Fort Worth economy expanded in August. Employment growth continued at a brisk pace, and unemployment remained low. Apartment demand and single-family housing permits rose in August, while multifamily permits continued to decline in part due to tighter credit conditions and higher financing costs. Housing affordability remained low in the second quarter as a result of high mortgage rates.
Employment
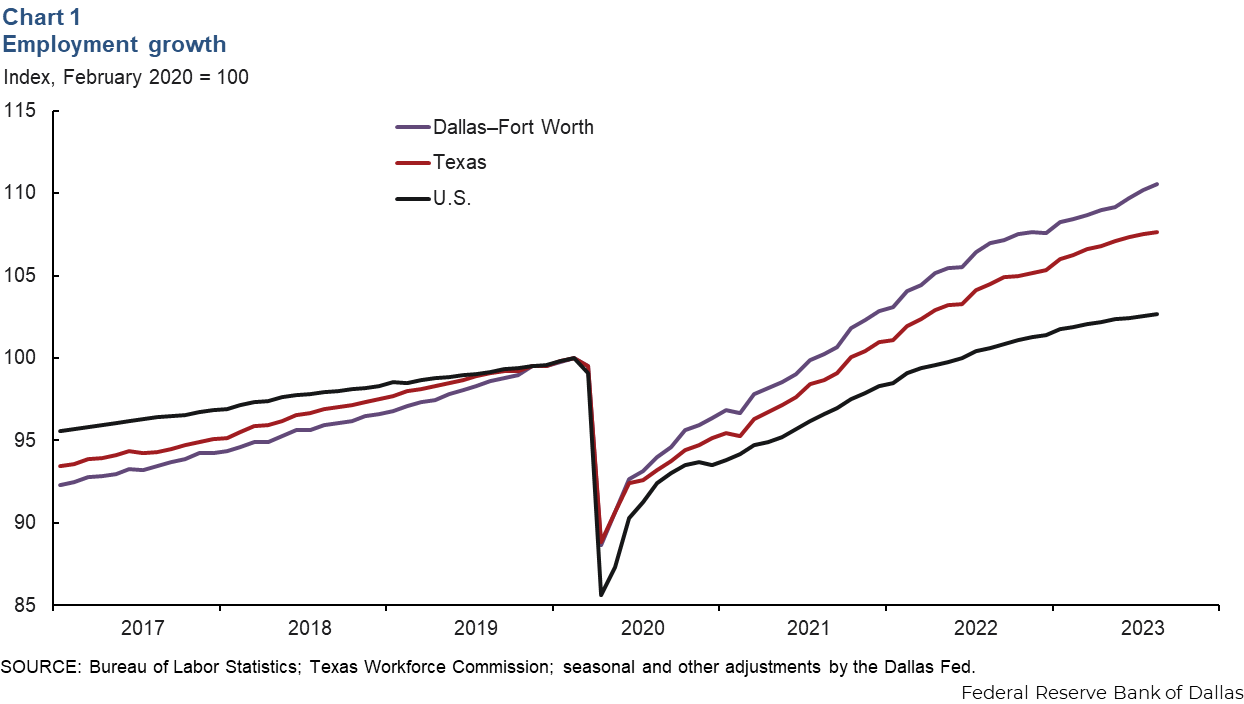
DFW payroll employment grew an annualized 3.7 percent (13,000 jobs) in August (Chart 1). In the three months through August, employment was up an annualized 5.1 percent in DFW—double its trend growth rate. Job gains were mostly broad based across sectors during this period, though payrolls in education and health services contracted, and growth was sluggish in trade, transportation and utilities (1.7 percent). Texas payrolls rose an annualized 2.0 percent in the three months ending in August, while U.S. employment increased 1.2 percent. The DFW unemployment rate ticked up to 3.9 percent in August but was below the state’s 4.1 percent jobless rate.
Housing
Single-family construction rises
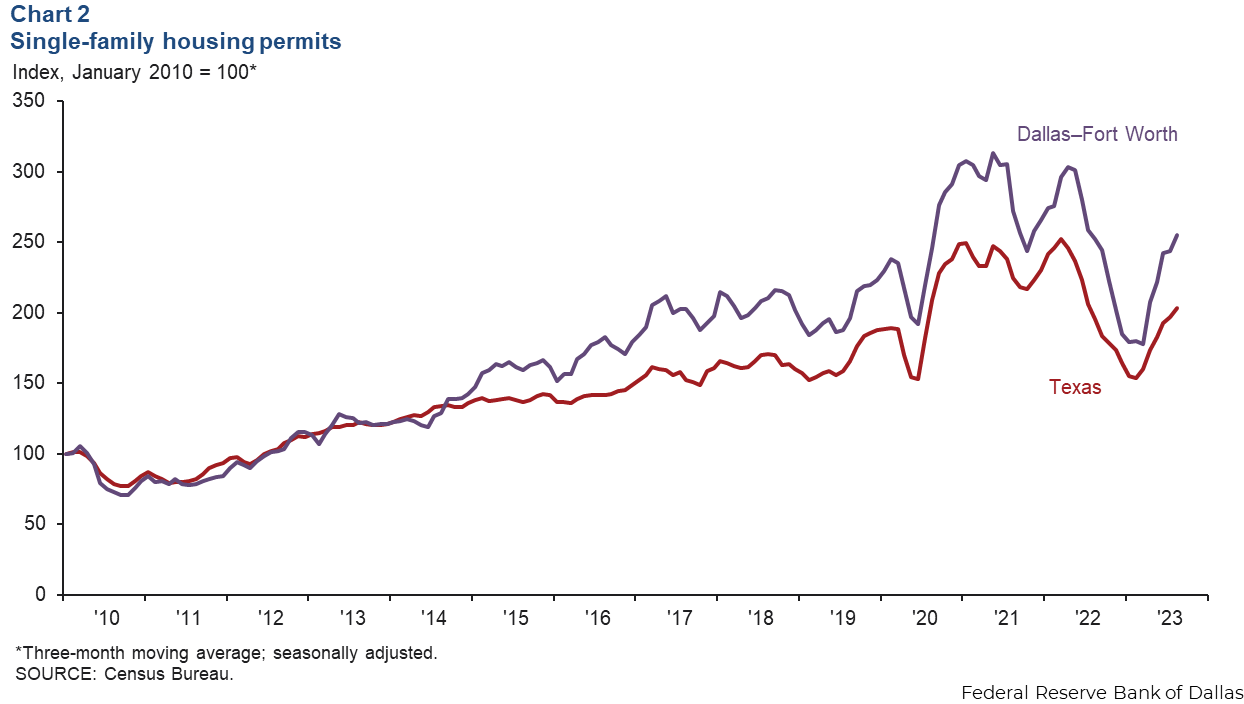
Single-family permit issuance, which leads home construction, rose further in August. Permit issuance climbed 5.5 percent in DFW and 6.3 percent in Texas. The three-month moving average of single-family permits also rose in DFW and the state (Chart 2). Despite the steady increase seen since spring 2023, single-family permit issuance year to date was down 19.8 percent in DFW and 18.4 percent in Texas compared with the same period last year.
Multifamily permit issuance declines
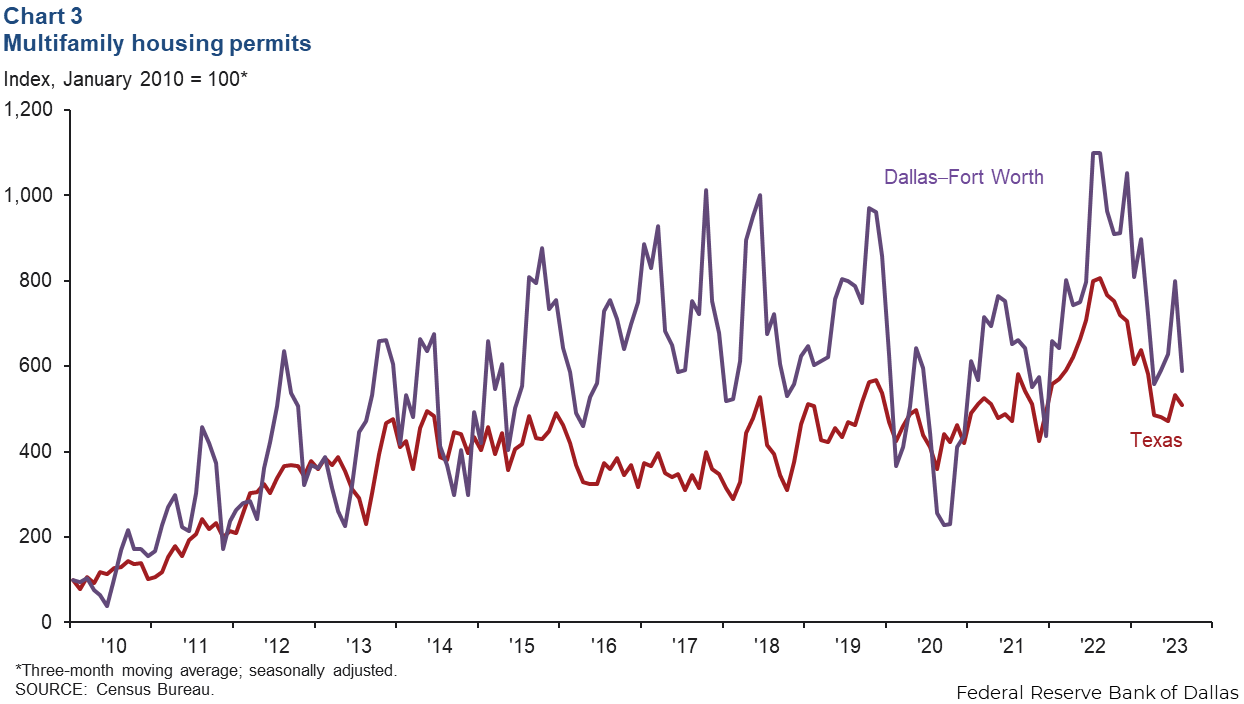
Multifamily permit issuance, which leads apartment construction, weakened in August (Chart 3). The three-month moving average of multifamily permits fell 26.4 percent in DFW and 4.1 percent in Texas, in part due to higher construction and financing costs. Despite the recent pullback, DFW multifamily permit issuance remains elevated compared with historical levels; the metroplex is among the busiest large U.S. metros in apartment construction.
Apartment demand stays firm
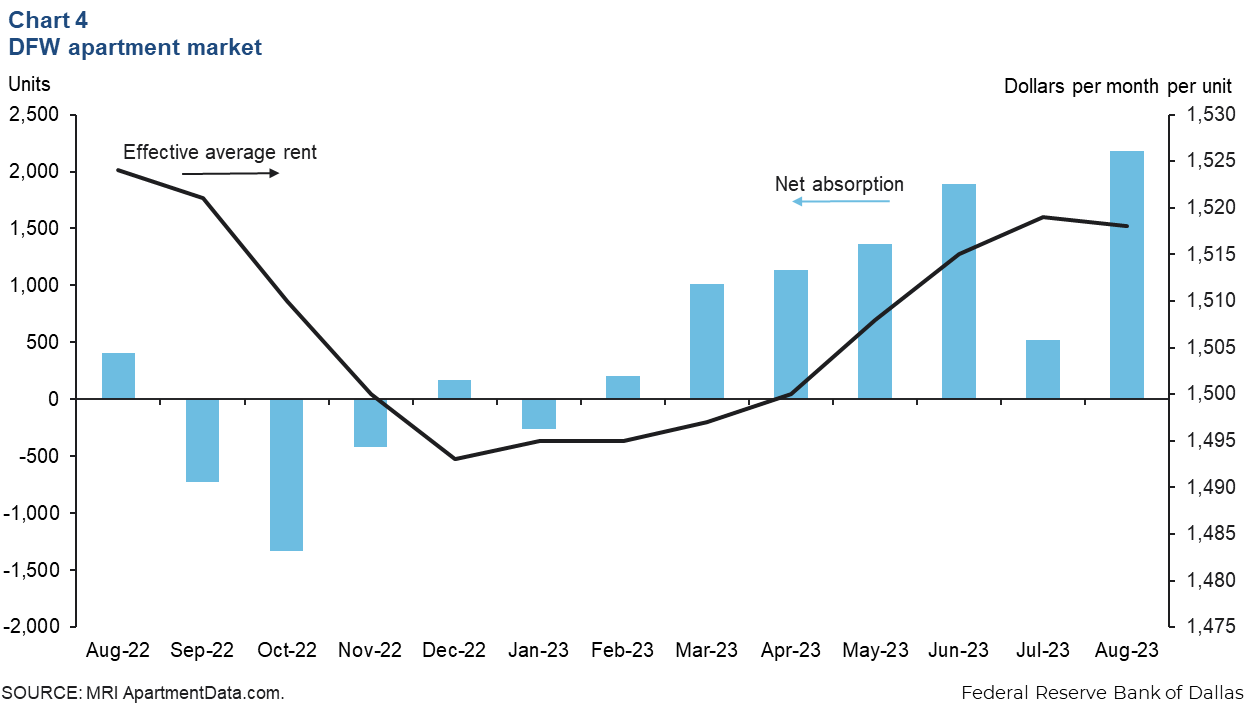
DFW apartment absorption remained solid in the summer. Net absorption was 4,600 units from June through August, following an increase of about 3,500 units from March through May (Chart 4). With demand holding up, effective monthly rents in DFW stabilized at $1,518 per unit in August, little changed from year-ago levels. Occupancy was stable at around 91.1 percent, and contacts note that while leasing activity is healthy, an elevated level of apartment completions is weighing down occupancy and rent growth.
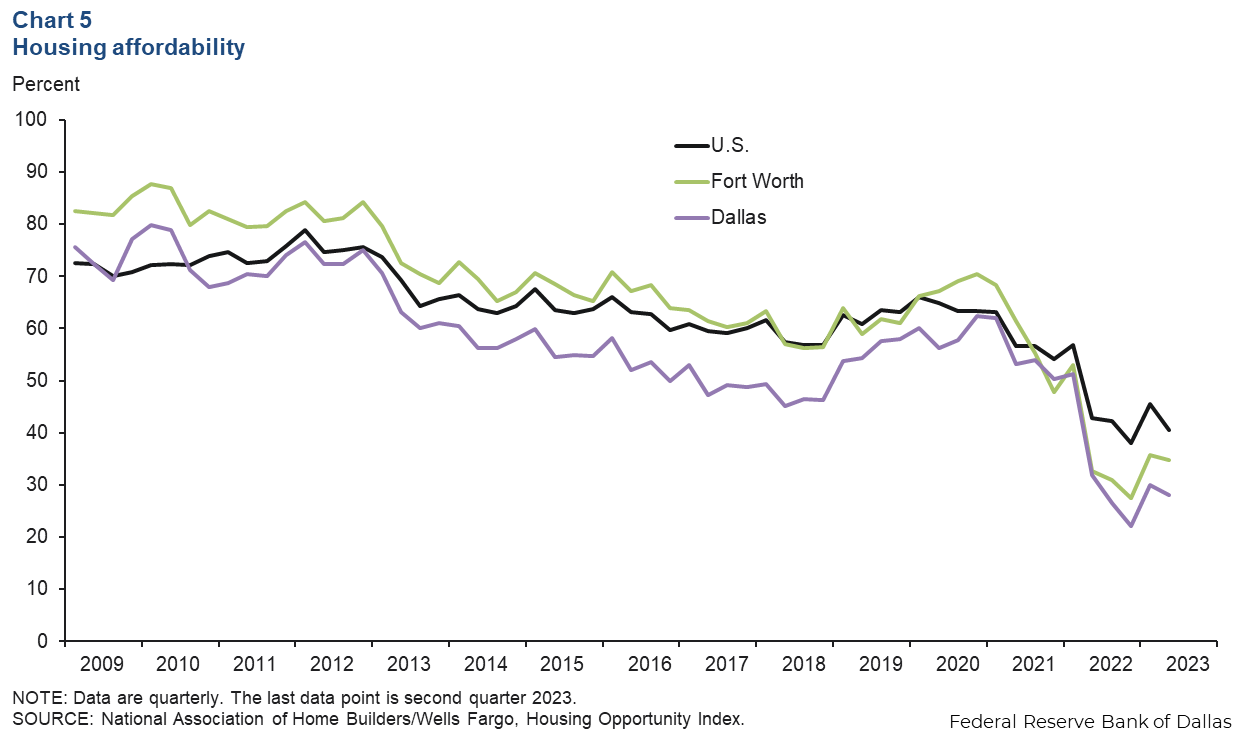
Affordability remains low
Housing affordability fell in the second quarter due to a combination of high home prices and climbing mortgage rates (Chart 5). In Dallas, the share of homes sold that the median-income household could afford dropped from 30.0 percent in first quarter 2023 to 28.1 percent in the second. Affordability in Fort Worth dipped 1 percentage point to 34.8 percent in the second quarter. Affordability plunged in the U.S. as well last quarter, falling 5.1 percentage points to 40.5 percent. In August, the median home sales price was little changed at $396,300 in DFW, and year-over-year, prices were down 0.8 percent.
NOTE: Data may not match previously published numbers due to revisions.
About Dallas–Fort Worth Economic Indicators
Questions or suggestions can be addressed to Laila Assanie at laila.assanie@dal.frb.org. Dallas–Fort Worth Economic Indicators is published every month after state and metro employment data are released.