Dallas-Fort Worth Economic Indicators

| DFW economy dashboard (September 2023) | |||
Job growth (annualized)
June–Sept. '23 |
Unemployment rate |
Avg. hourly earnings |
Avg. hourly earnings growth y/y |
5.6% |
3.8% | $34.19 | 2.8% |
Dallas–Fort Worth’s economy gained momentum in September. Payroll gains accelerated, unemployment dipped, and retail sales tax collections rose. Demand for office space stayed sluggish in the third quarter while industrial leasing remained active.
Employment
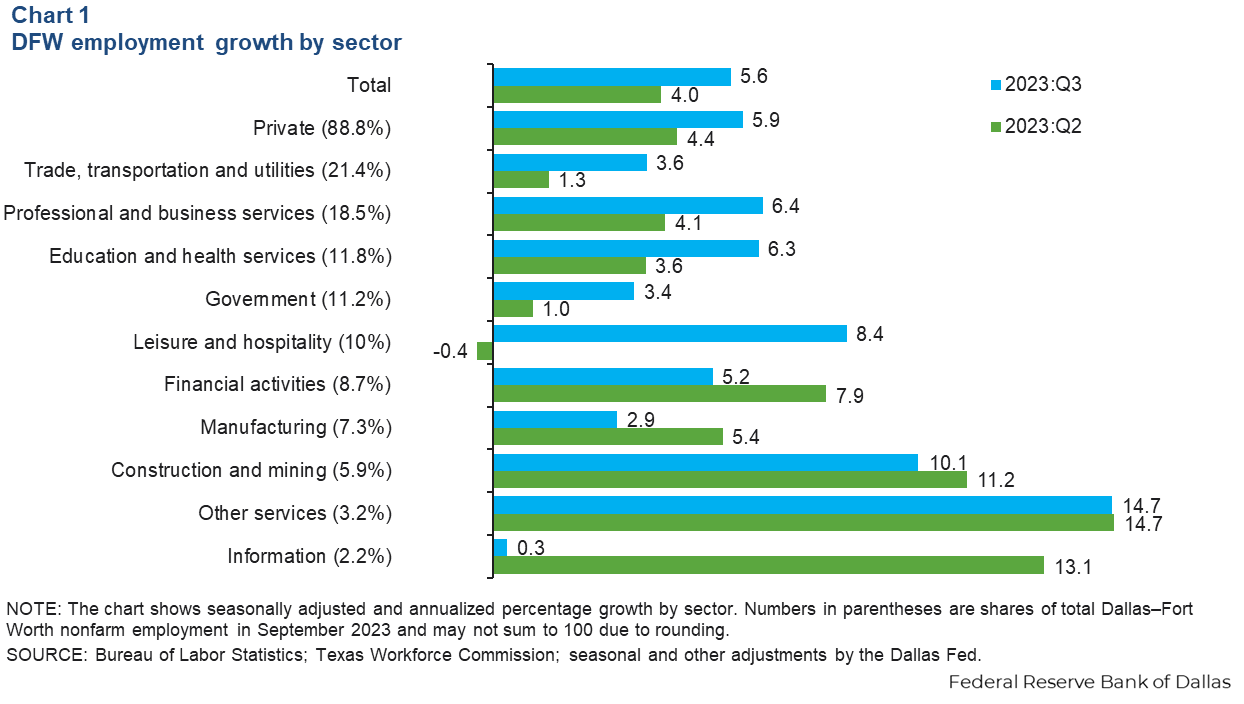
Job growth accelerates
DFW added 28,000 jobs in September, up from August’s 12,000 increase. In the third quarter, DFW employment grew an annualized 5.6 percent an acceleration from the second quarter’s 4.0 percent increase (Chart 1). DFW gains were widespread across major sectors over the three-month period, with only employment in information services holding relatively steady. Payrolls in construction and mining, leisure and hospitality, education and health services, professional and business services and other services sectors posted strong gains.
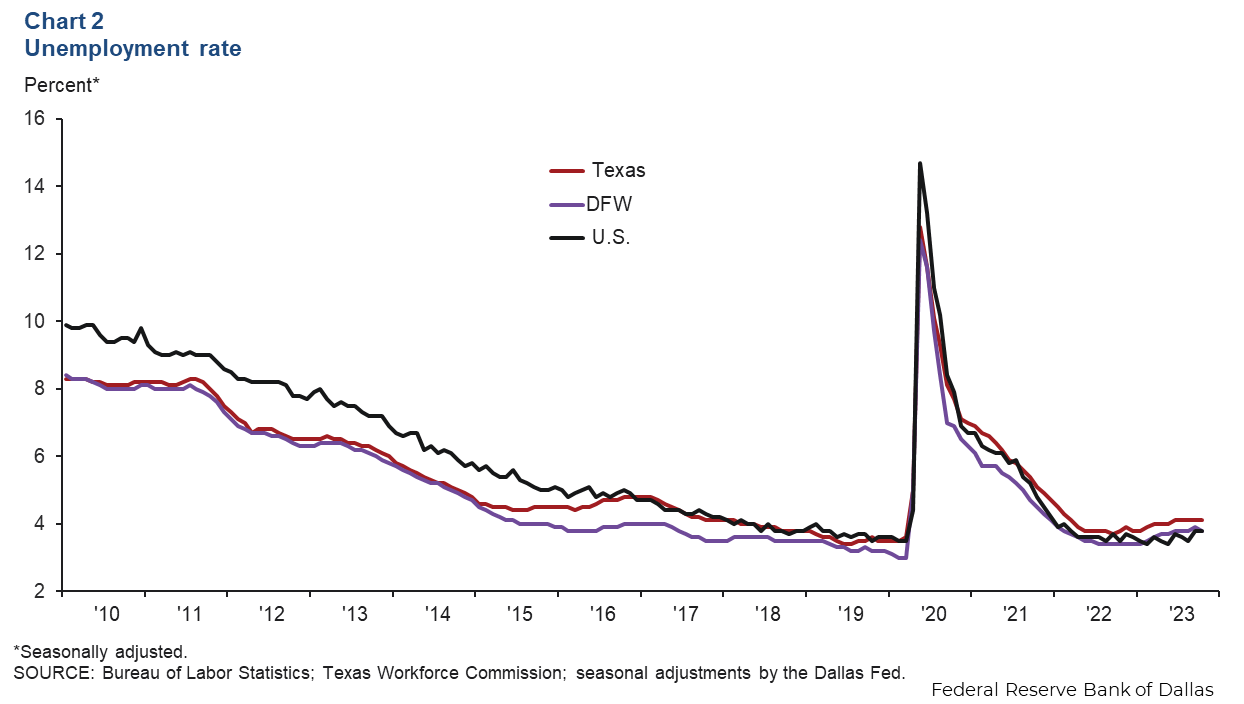
Unemployment dips
The DFW labor market continued to be tight. The unemployment rate dipped to 3.8 percent in DFW, while in Texas it held steady at 4.1 percent (Chart 2). The jobless rate in the U.S. was also unchanged at 3.8 percent. The labor force expanded an annualized 3.2 percent in DFW—faster than the nation’s 0.6 percent rise.
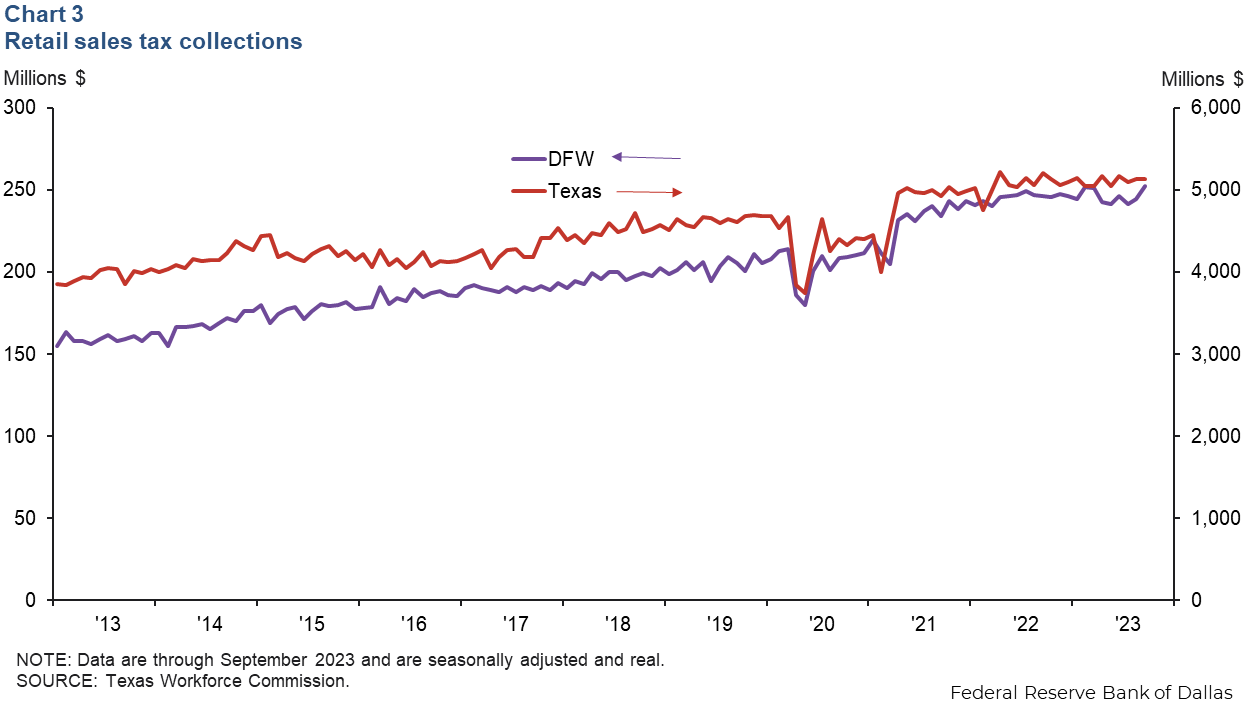
Retail sales tax collections
In September, DFW retail sales tax collections increased by 3.2 percent to 253 million (Chart 3). Sales tax collections rose 2.0 percent in Dallas and 6.6 percent in Fort Worth last month, outpacing the growth in the state’s collections, which were essentially flat in September. Year over year, the region’s retail sales tax collections were up 2.5 percent, contrasting Texas’ collections, which fell 1.5 percent.
Commercial real estate
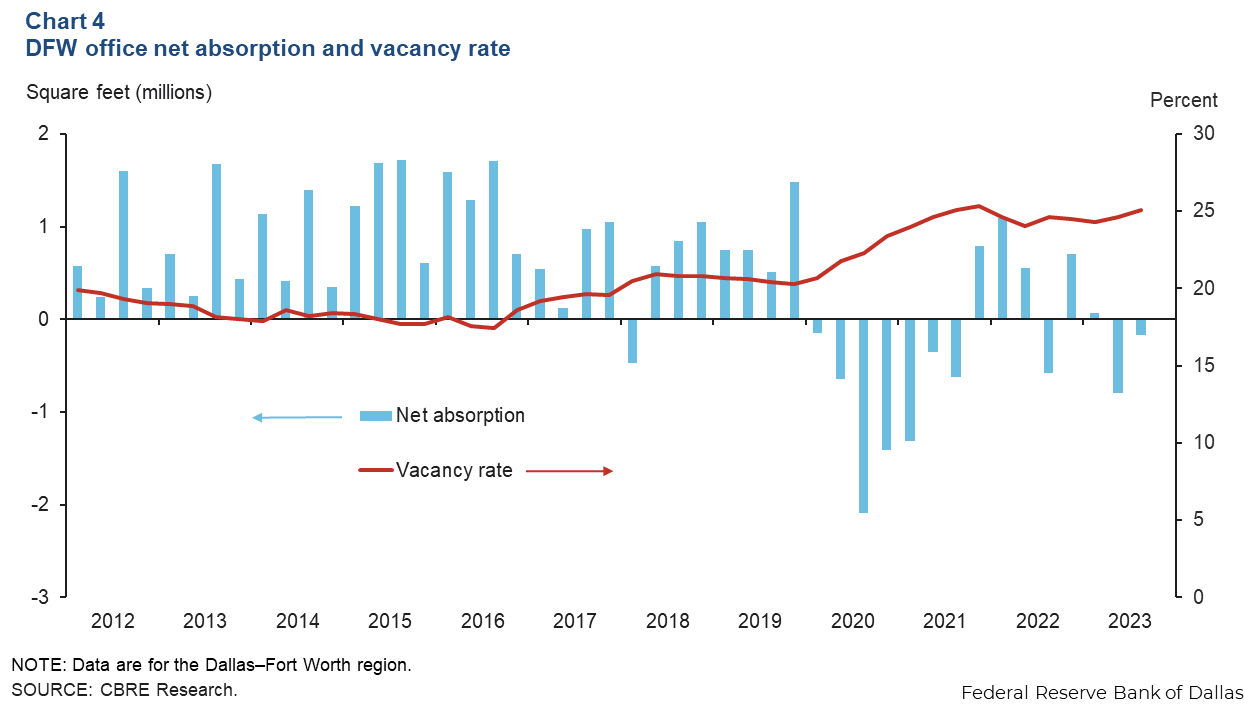
Office vacancies rise
Demand for office space in DFW remained subdued in the third quarter (Chart 4). Net absorption fell 173,202 square feet due to net move outs from older or less desirable Class B space, according to data from CBRE Research. The vacancy rate rose from 24.6 percent to 25.1 percent, equivalent to over 58 million square feet of vacant space. Sublease space availability rose further to 10.6 million square feet, representing 15.4 percent of total availability. The additions were concentrated in suburban markets. The volume of space under construction dipped to 3.4 million square feet in the third quarter of which 15 percent was preleased. Business contacts noted that leasing activity, a leading indicator of the amount of commercial real estate absorbed by the market, or net absorption, remains sluggish, suggesting continued weakness in the near term.
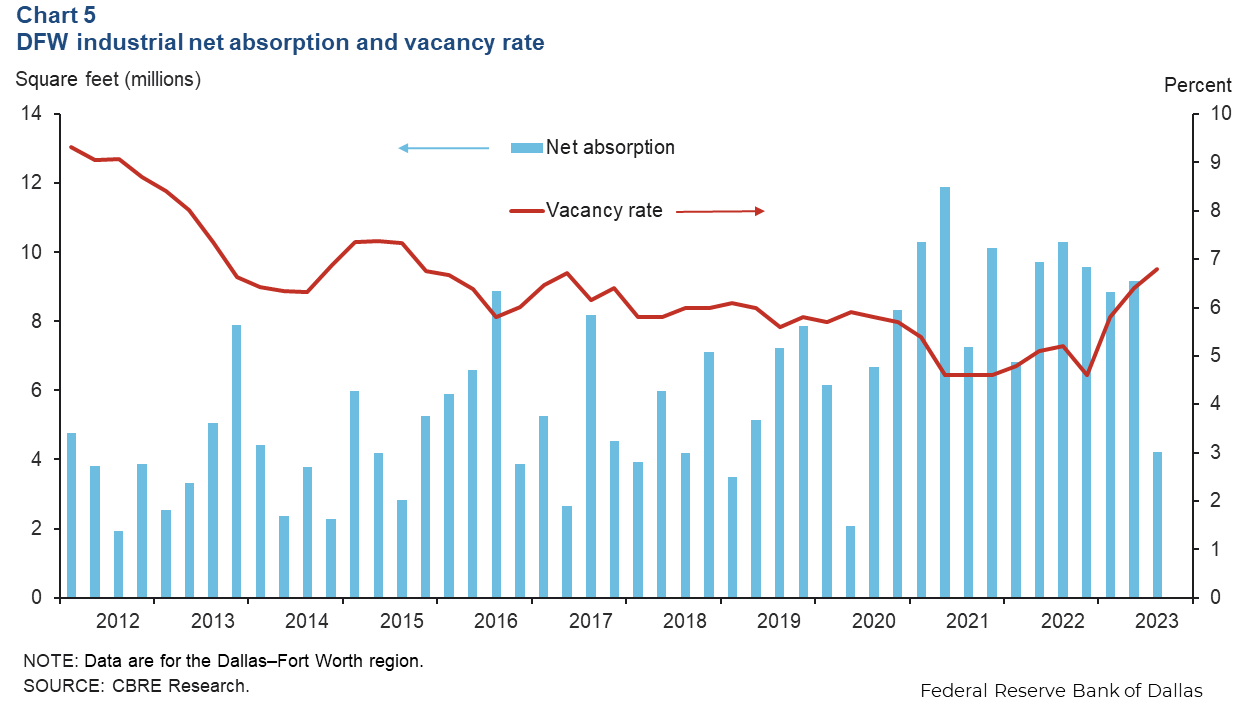
Industrial leasing stays solid, but vacancy increases
The positive momentum in industrial leasing continued in the third quarter, driven by demand from third-party logistics, manufacturing and wholesale firms. Net absorption was a 4.2 million square feet, marking the 52nd straight quarter of positive absorption, according to CBRE (Chart 5). The vacancy rate climbed 40 basis points to 6.8 percent due to the elevated level of deliveries that totaled 8.1 million square feet in the third quarter. DFW continues to rank among the largest markets in the country in industrial development at 47 million square feet under construction. Though still elevated, the figure is down from second quarter. The North Fort Worth submarket has the highest level of speculative construction, followed by the East Dallas submarket.
NOTE: Data may not match previously published numbers due to revisions.
About Dallas–Fort Worth Economic Indicators
Questions or suggestions can be addressed to Laila Assanie at laila.assanie@dal.frb.org. Dallas–Fort Worth Economic Indicators is published every month after state and metro employment data are released.