Dallas-Fort Worth Economic Indicators

| DFW economy dashboard (December 2023) | |||
Job growth (annualized)
Sept.–Dec. '23 |
Unemployment rate |
Avg. hourly earnings |
Avg. hourly earnings growth y/y |
0.6% |
3.7% | $34.04 | 2.0% |
The Dallas–Fort Worth economy expanded in December. Payroll employment rose moderately, and unemployment dipped. Home prices were relatively flat in the fourth quarter, and affordability held steady. Office leasing remained sluggish, and industrial demand picked up in the fourth quarter.
Labor market
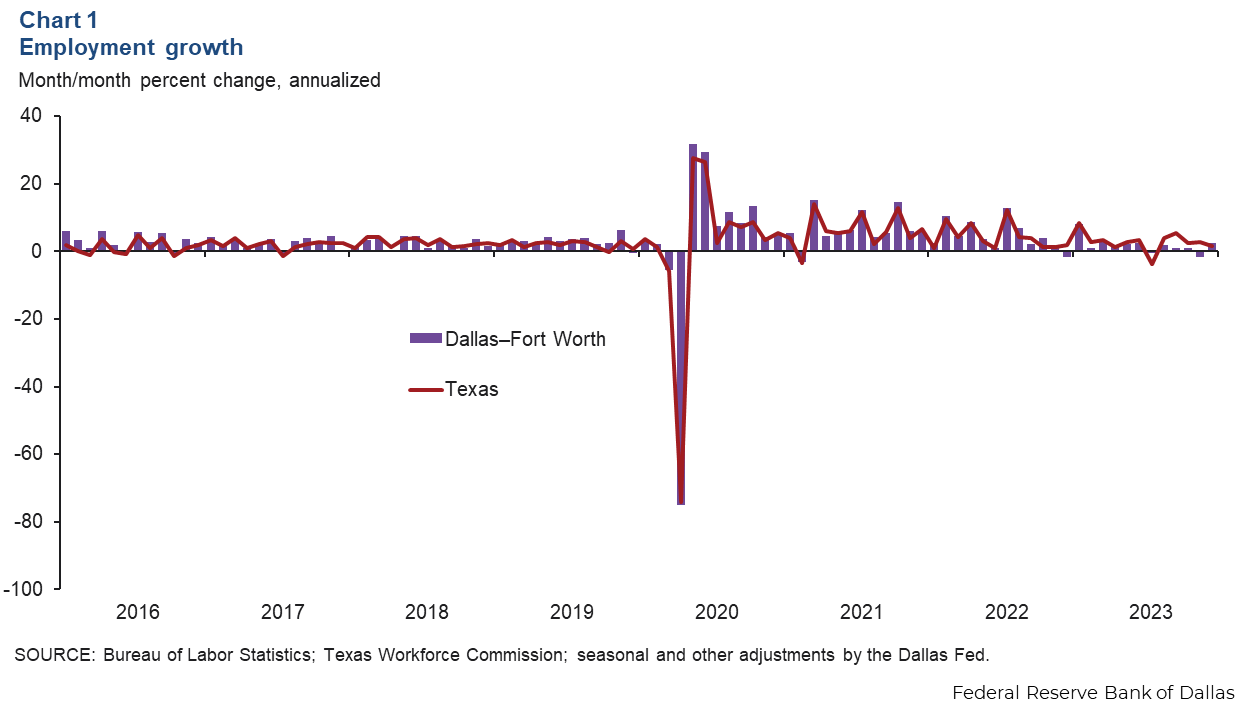
Job growth picks up in December
Employment in DFW rose 2.4 percent in December after declining in November (Chart 1). Job growth was mixed across the major sectors, with strong gains seen in manufacturing, financial activities, and leisure and hospitality. Payrolls declined in construction and mining and professional and business services in December. The unemployment rate in DFW dipped to 3.7 percent.
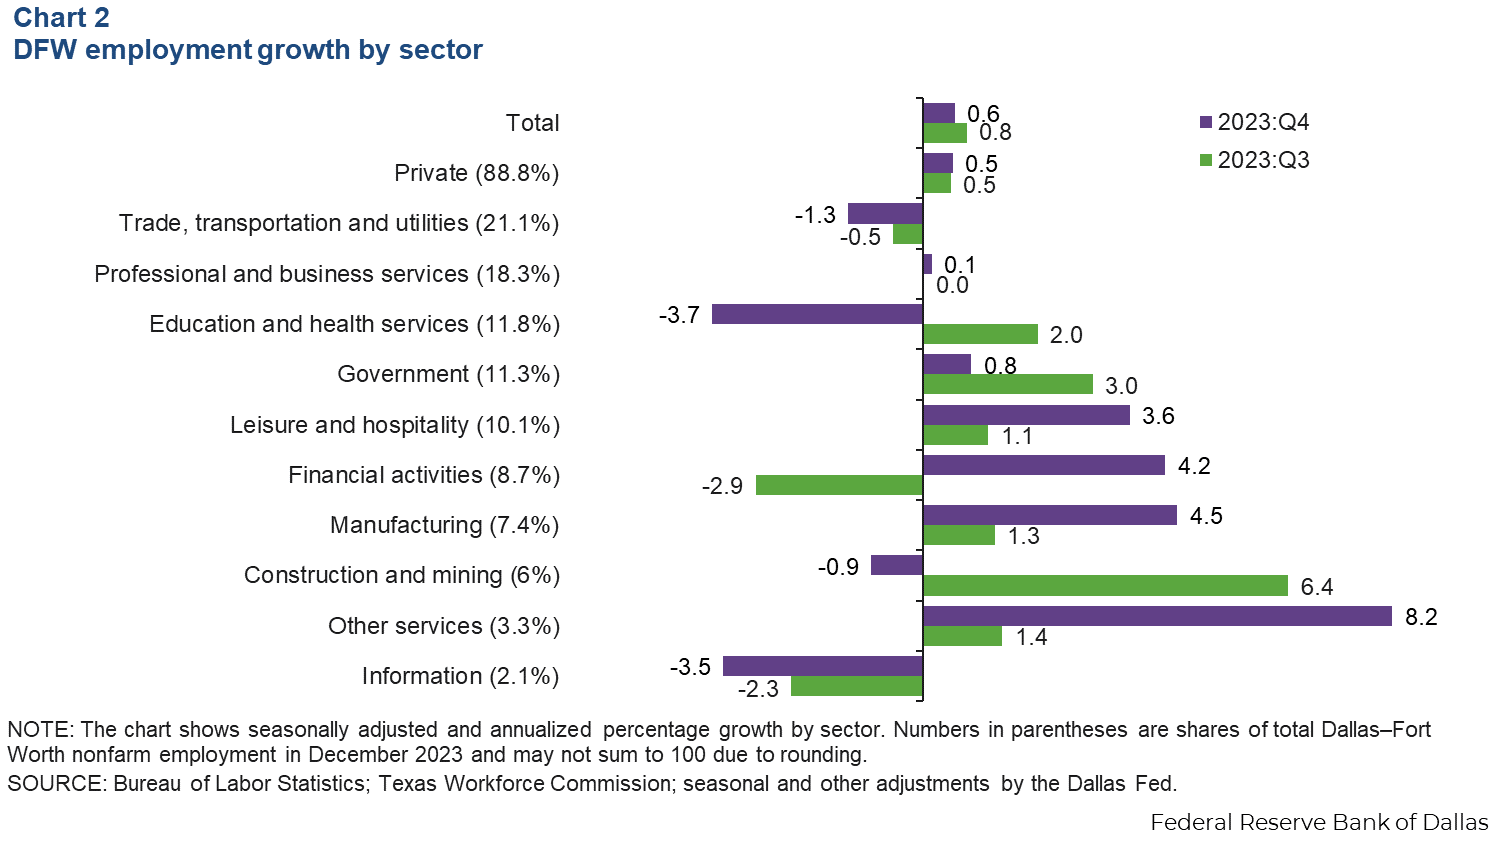
Payroll gains slow in fourth quarter
In the fourth quarter, DFW employment grew an annualized 0.6 percent, slower than the third quarter’s 0.8 percent increase (Chart 2). DFW gains were mixed across major sectors over the three-month period. Employment gains were robust in leisure and hospitality, financial activities, manufacturing and other services. Payrolls in professional and business services were little changed, while employment contracted in trade, transportation and utilities, education and health services, construction and mining, and information.
Real estate
Home prices nearly flat in fourth quarter
Home prices in DFW were little changed in the fourth quarter, according to recently released data from the Federal Housing Finance Agency. Compared with the third quarter, prices edged up 0.1 percent in Dallas and in Fort Worth. Meanwhile, prices rose 0.4 percent in Texas and 1.5 percent in the U.S. over the same period. In 2023, home prices grew 1.4 percent in Fort Worth, 3.5 percent in Dallas and 2.7 percent in Texas, all lower than the nation’s 6.5 percent increase (Chart 3).

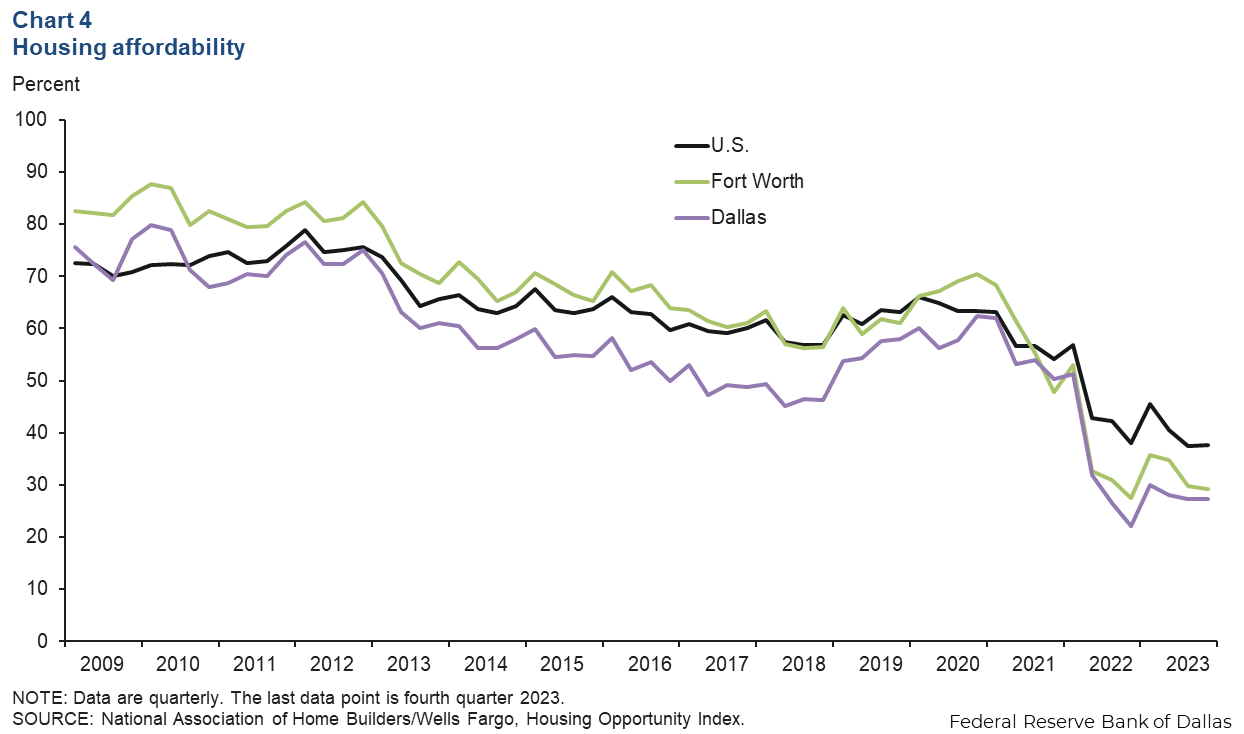
Affordability remains low
Housing affordability stabilized in the fourth quarter, as prices were largely flat and mortgage rates dipped (Chart 4). In Dallas, the share of homes sold that the median-income household could afford was unchanged at 27.3 percent in the fourth quarter, and affordability in Fort Worth edged down to 29.3 percent. Affordability in the U.S. held steady last quarter at 37.7 percent. Affordability in DFW remains below the national average as well as below the figures for Austin, Houston and San Antonio.
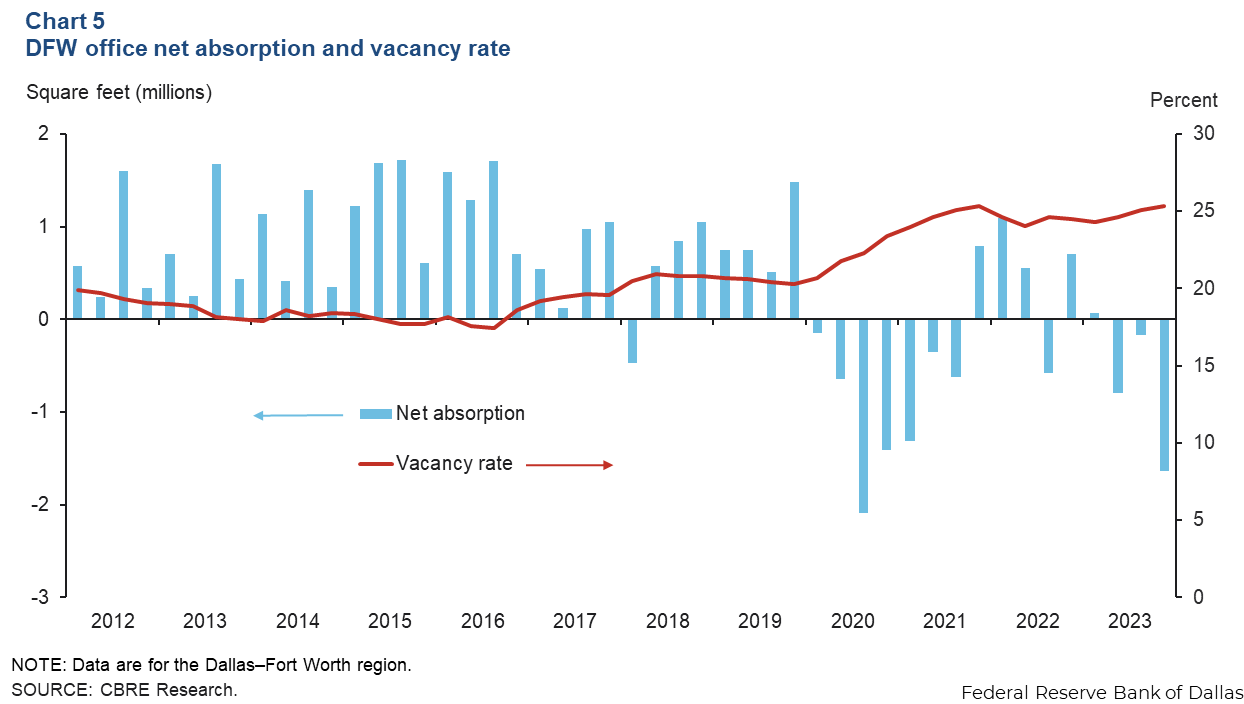
Office vacancies flat, demand weak
Demand for office space in DFW remained subdued in the fourth quarter (Chart 5). Net absorption fell 1.6 million square feet due to net move-outs from older or less desirable Class B space, according to data from CBRE Research. The vacancy rate rose from 25.1 percent to 25.3 percent, equivalent to over 58 million square feet of vacant space. Sublease space availability dipped to 10.4 million square feet, representing 15.5 percent of total availability. Sublease space was concentrated in suburban markets, and many of the spaces are equipped with furniture and other office necessities. The volume of space under construction rose to 5.2 million square feet in the fourth quarter. Business contacts noted that leasing activity, a leading indicator of the amount of commercial real estate absorbed by the market, or net absorption, has ticked up for smaller spaces but remains sluggish for larger deals.
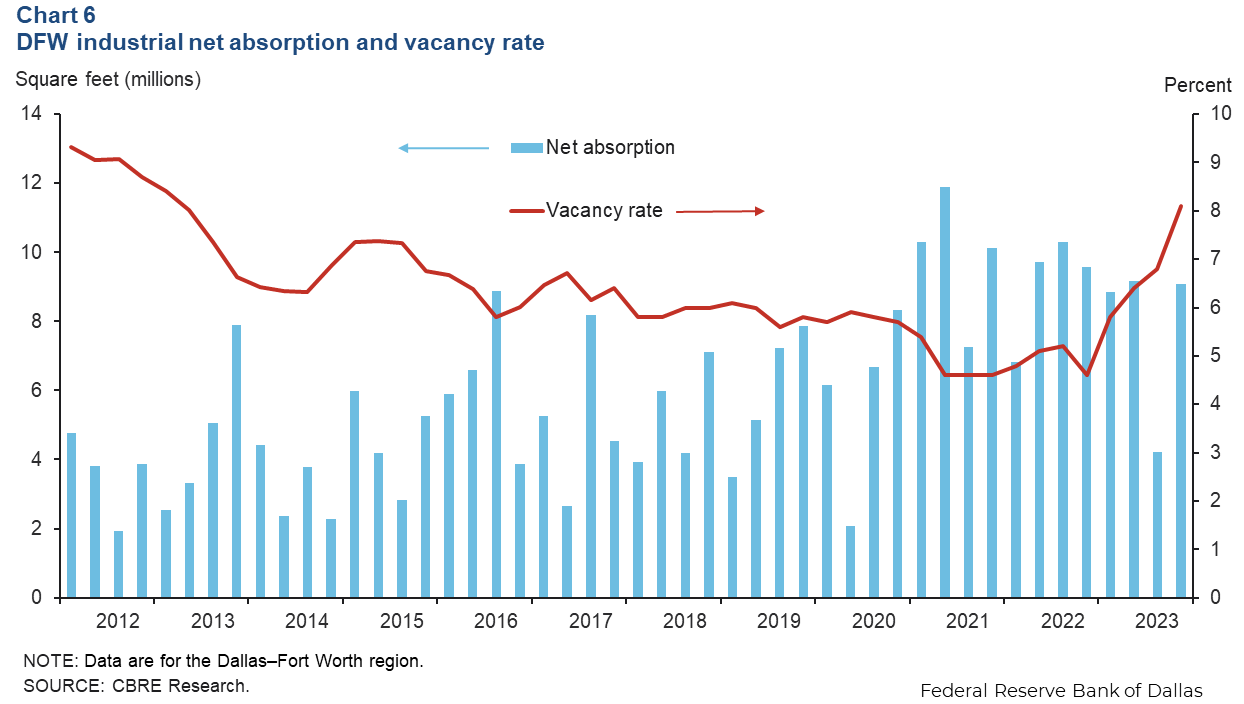
Industrial leasing stays solid, but vacancy increases sharply
The positive momentum in industrial leasing continued in the fourth quarter, driven by demand from third-party logistics, manufacturing and retail firms. Net absorption was 9.1 million square feet, more than double the space absorbed in the third quarter, according to CBRE (Chart 6). The vacancy rate climbed to 8.1 percent due to the elevated level of deliveries that totaled 19.6 million square feet in the fourth quarter. The space under construction dropped from 47 million square feet to 30 million square feet at year-end. The East Dallas submarket has the highest level of speculative construction, followed by the South Dallas submarket.
NOTE: Data may not match previously published numbers due to revisions.
About Dallas–Fort Worth Economic Indicators
Questions or suggestions can be addressed to Laila Assanie at laila.assanie@dal.frb.org. Dallas–Fort Worth Economic Indicators is published every month after state and metro employment data are released.