Dallas-Fort Worth Economic Indicators

| DFW economy dashboard (February 2024) | |||
Job growth (annualized)
Nov. 23–Feb. '24 |
Unemployment rate |
Avg. hourly earnings |
Avg. hourly earnings growth y/y |
1.3% |
3.7% | $34.05 | 2.1% |
The Dallas–Fort Worth economy expanded in February. Job growth accelerated, and unemployment held steady for the third straight month. Sales tax collections climbed in March, suggestive of strong consumer spending, while apartment demand fell. According to recently released data, DFW continued to see strong population growth in 2023 due to solid in-migration.
Labor market
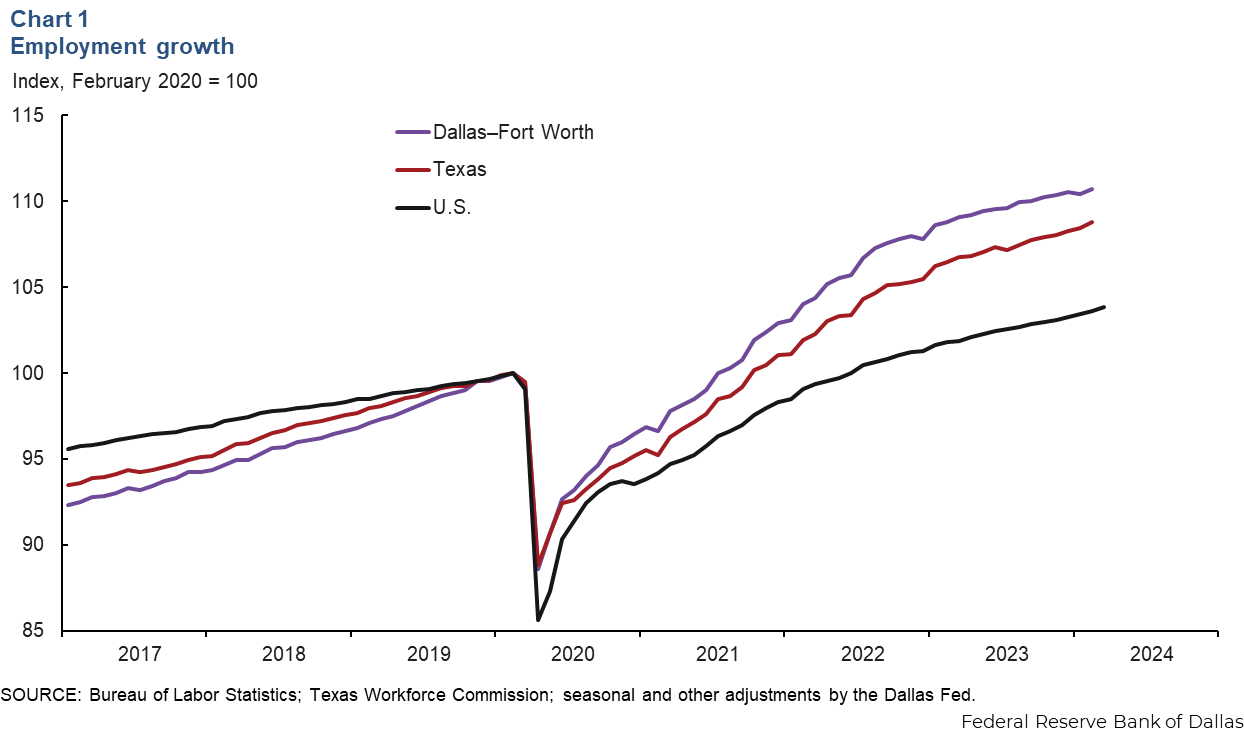
Employment rises
DFW payroll employment expanded an annualized 2.9 percent (10,000 jobs) in February following job declines in the previous month (Chart 1). In the three months through February, employment was up a modest 1.3 percent in DFW—below its trend growth rate. Job gains were mixed across sectors during this period, with job growth led by other services and manufacturing. Payrolls were flat in trade, transportation and utilities and declined in information services and construction and mining. Texas payrolls rose an annualized 2.8 percent in the three months ending in February, while U.S. employment increased 2.1 percent.
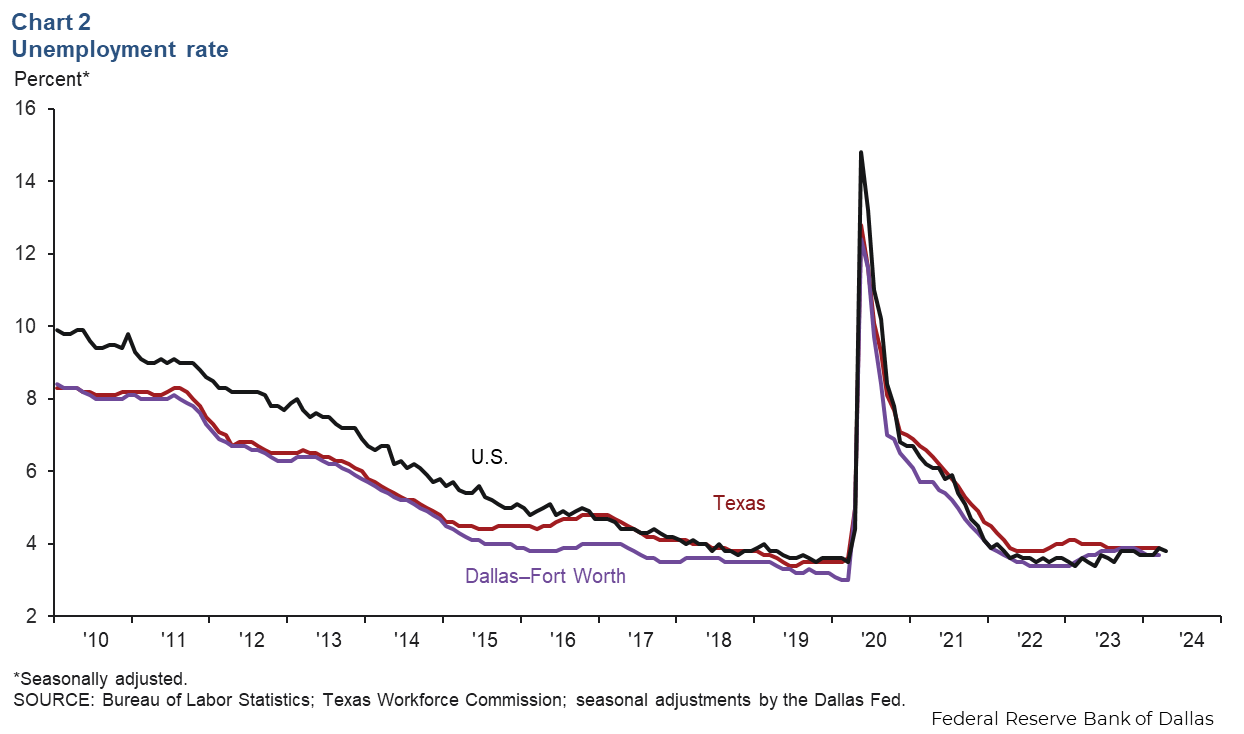
Unemployment stable
The DFW labor market continued to be tight in February. The DFW unemployment rate held steady at 3.7 percent, remaining below both the state’s and nation’s jobless rate of 3.9 percent (Chart 2). The labor force declined an annualized 1.3 percent in DFW from November through February, while it grew 1.0 percent in the state.
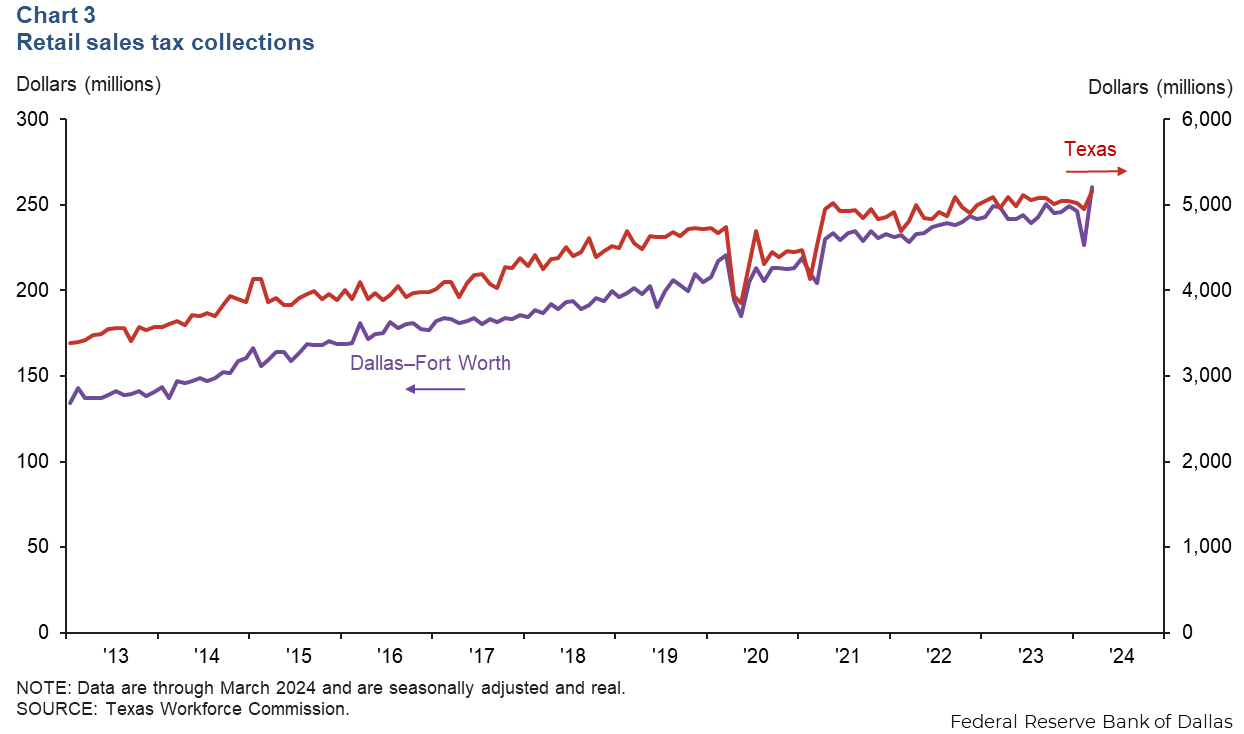
Retail sales tax collections
In March, DFW retail sales tax collections climbed 14.8 percent to $260 million (Chart 3). Sales tax collections were up 15.0 percent in Dallas, 7.9 percent in Fort Worth and 4.2 percent in Texas in March. Year over year, the metroplex’s retail sales tax collections were up 4.6 percent, and Texas’ collections rose 4.0 percent.
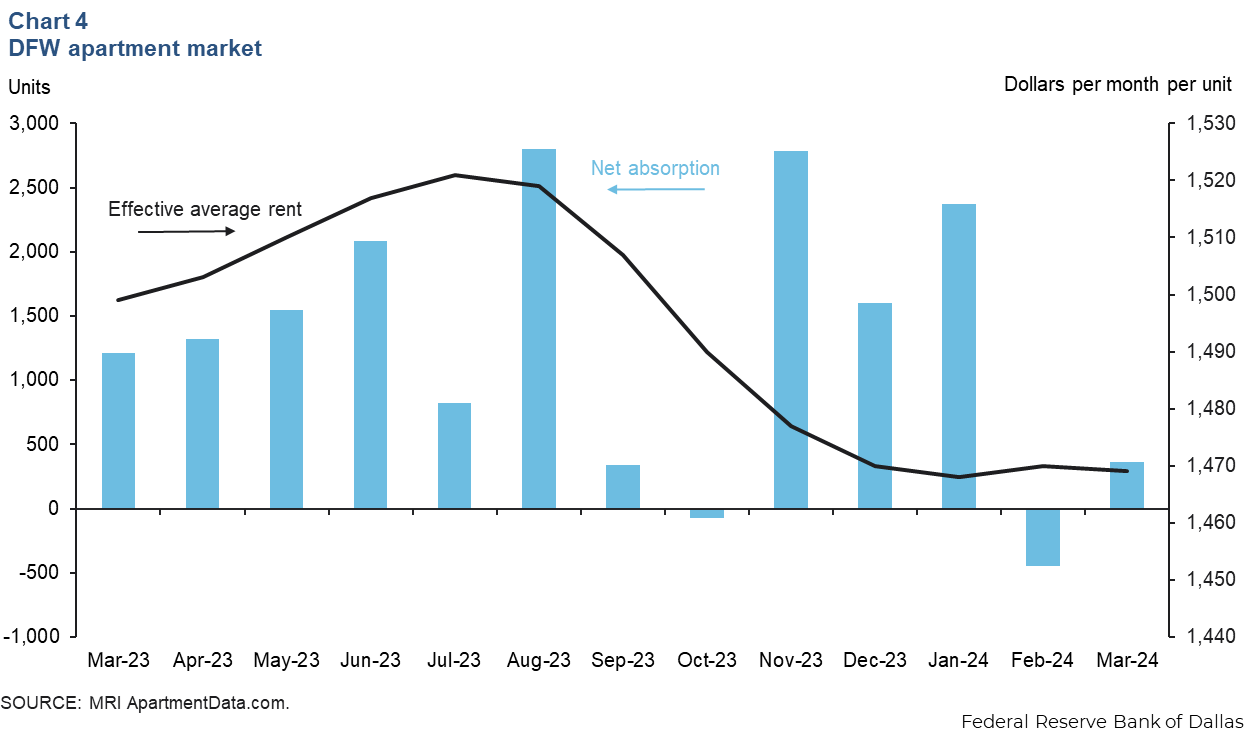
Multifamily housing
DFW apartment absorption moderated in February and March following strong demand in January. Net absorption was nearly 2,300 units in the first quarter this year following an increase of about 4,300 units in fourth quarter 2023 (Chart 4). With demand slowing, effective monthly rents in DFW were relatively flat at $1,469 per unit in March compared with year-end 2023 but were down 2.0 percent from year-ago levels. Occupancy dipped to 89.1 percent and was 1.8 percentage points below March 2023 levels. Contacts noted that an elevated level of apartment completions was weighing down occupancy and rents.
Population
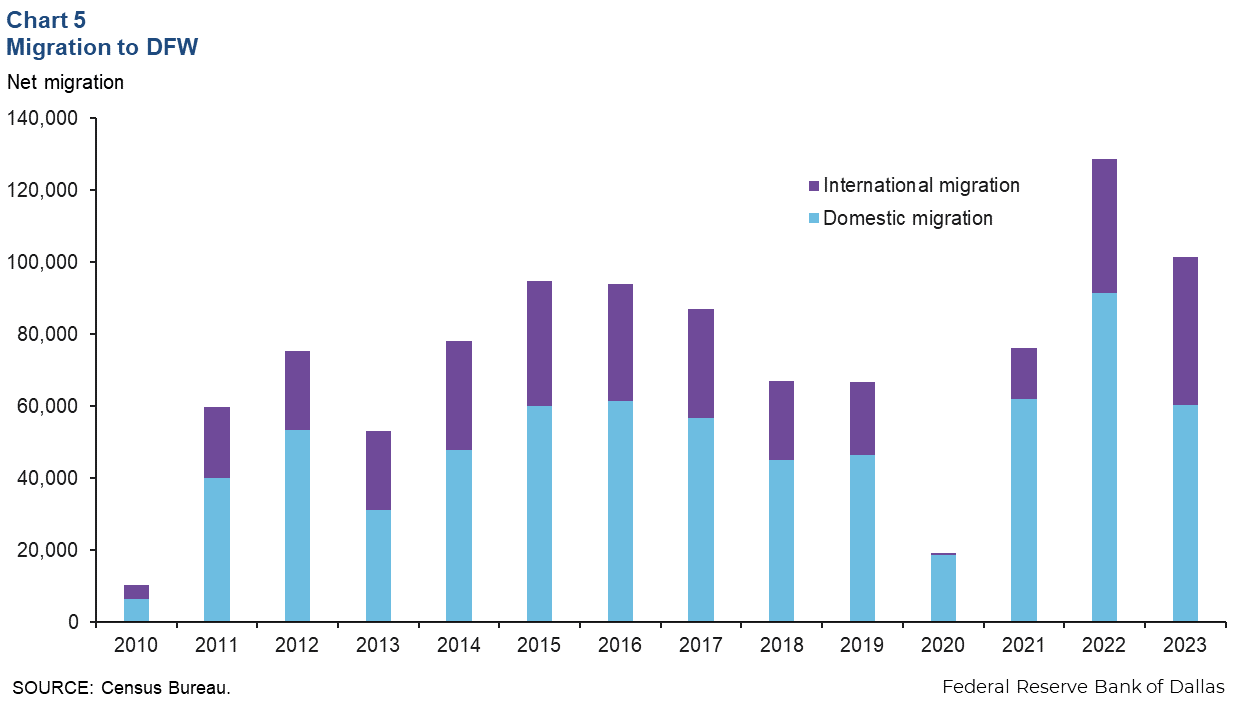
According to recently released census data, DFW’s population increased by 152,600 from July 2022 to July 2023 thanks to continuing strong migration. Domestic migration accounted for 40 percent of the increase (60,500 residents), while 27 percent of the growth (41,000) came from international migration (Chart 5). DFW’s population eclipsed the 8 million mark last year, and growth was 1.9 percent, slightly slower than the 2.2 percent in 2022 but in line with its long-term average of 1.8 percent. In Dallas, population growth moderated to 2.0 percent in 2023 from 2.4 percent in 2022, while in Fort Worth, growth held steady at 1.8 percent. Population growth at the state level was stable at 1.6 percent in 2023.
NOTE: Data may not match previously published numbers due to revisions.
About Dallas–Fort Worth Economic Indicators
Questions or suggestions can be addressed to Laila Assanie at laila.assanie@dal.frb.org. Dallas–Fort Worth Economic Indicators is published every month after state and metro employment data are released.