El Paso Economic Indicators

Trade through the port is unchanged, while maquiladora employment picked up in late 2018. Home sales have slowed, but home affordability remains above average in El Paso. Despite the strong dollar, El Paso retail sales were steady in second quarter 2018.
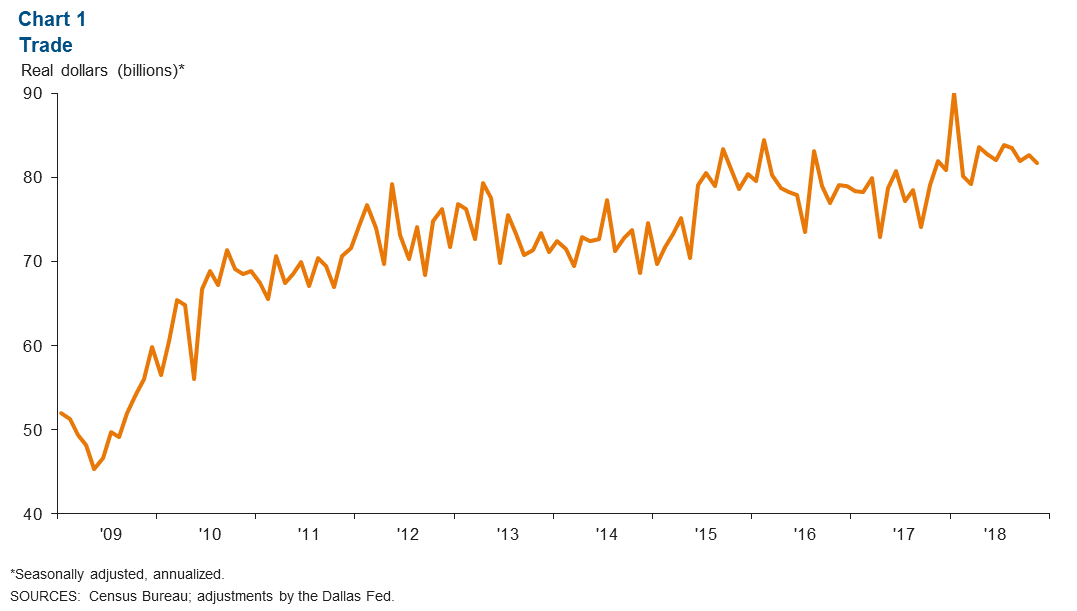
Trade
In November 2018, annualized trade through the port totaled $81.7 billion, nearly unchanged from $82 billion a year earlier (Chart 1). November exports were an annualized $33.2 billion, up 6.1 percent from a year ago. However, gains in exports were offset by a 4.1 percent decline in imports.
Retail Sales
According to the latest estimates available, El Paso retail sales totaled $3.1 billion in second quarter 2018—8 percent more than the same period in 2017 (Chart 2).
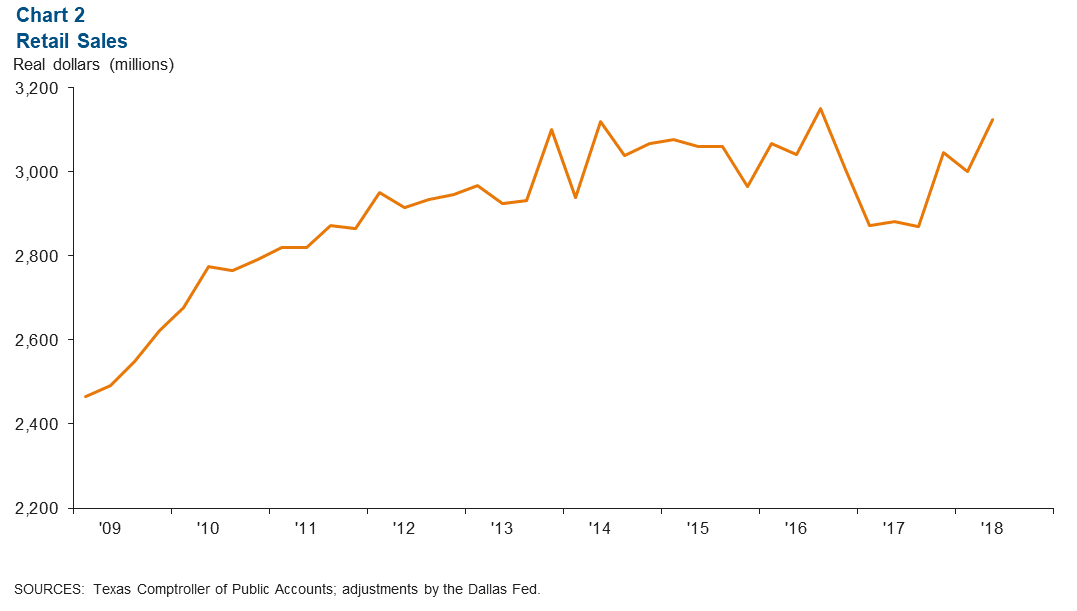
Dallas Fed research shows that Mexican shoppers account for 10 to 15 percent of El Paso's retail sales. Although the strong dollar has eroded Mexican purchasing power, retail sales have been relatively steady since mid-2014.
Housing
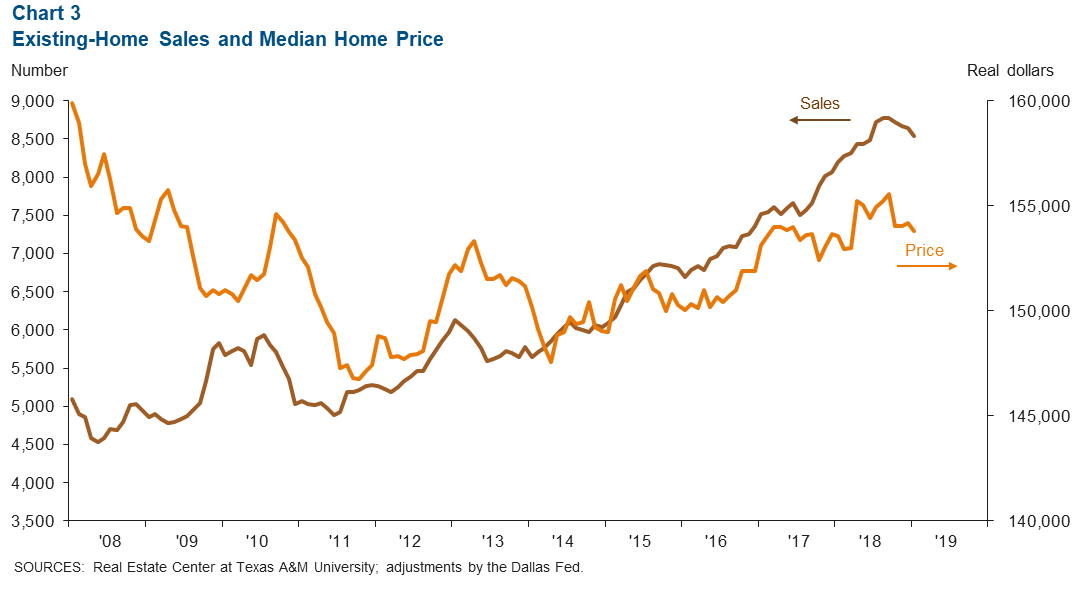
Home Sales Slow
El Paso existing-home sales peaked at 8,777 (annualized) in August 2018 but have slowed down since. In January, annualized sales totaled 8,541, slightly below December's figure of 8,636 (Chart 3). The median home price has also inched down; the January price of $153,804 was 1.1 percent below the most recent peak of $155,577 (September 2018).
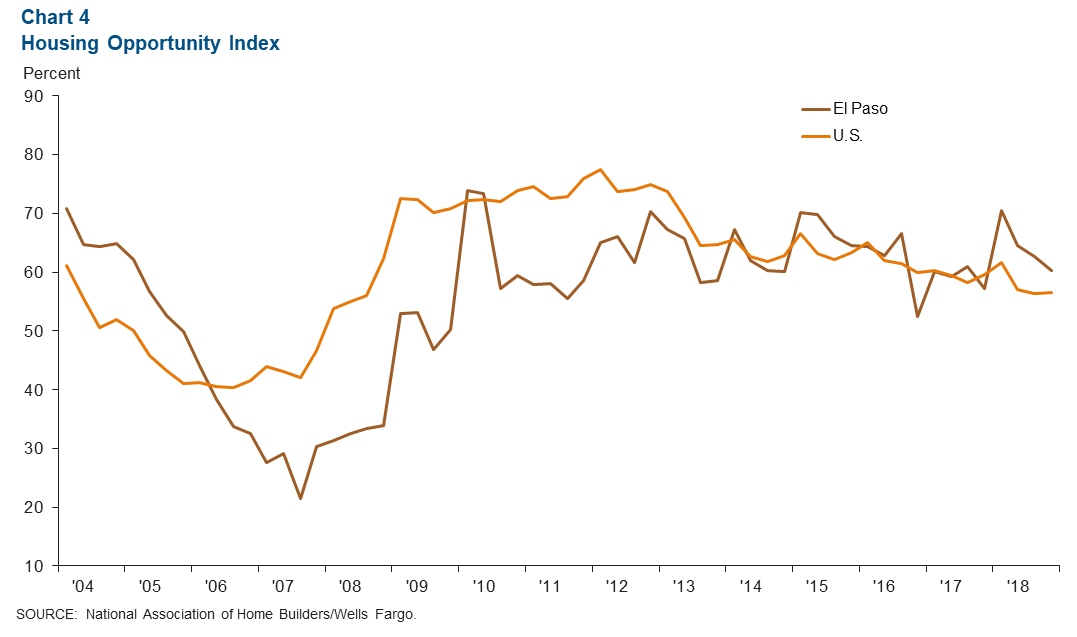
Housing Affordability Remains Above U.S. Average
The National Association of Home Builders Housing Opportunity Index represents the share of homes sold that are considered affordable to a family earning the median income. In fourth quarter 2018, the El Paso reading was 60.2 percent—above the U.S. reading of 56.6 percent (Chart 4). Affordability in El Paso has been above that of the U.S. for the last four quarters. The metro's affordability has increased as growth in income has outpaced home-price appreciation.
Industrial Production and Maquiladora Activity
U.S. industrial production rose 3.8 percent year over year in January (Chart 5). The Institute for Supply Management manufacturing index fell from 56.6 in January to 54.2 in February, but the reading remains above 50, which signals expansion. U.S. manufacturing conditions remain solid. U.S. and Mexican production and manufacturing trends are important to the local economy because of cross-border manufacturing relationships.
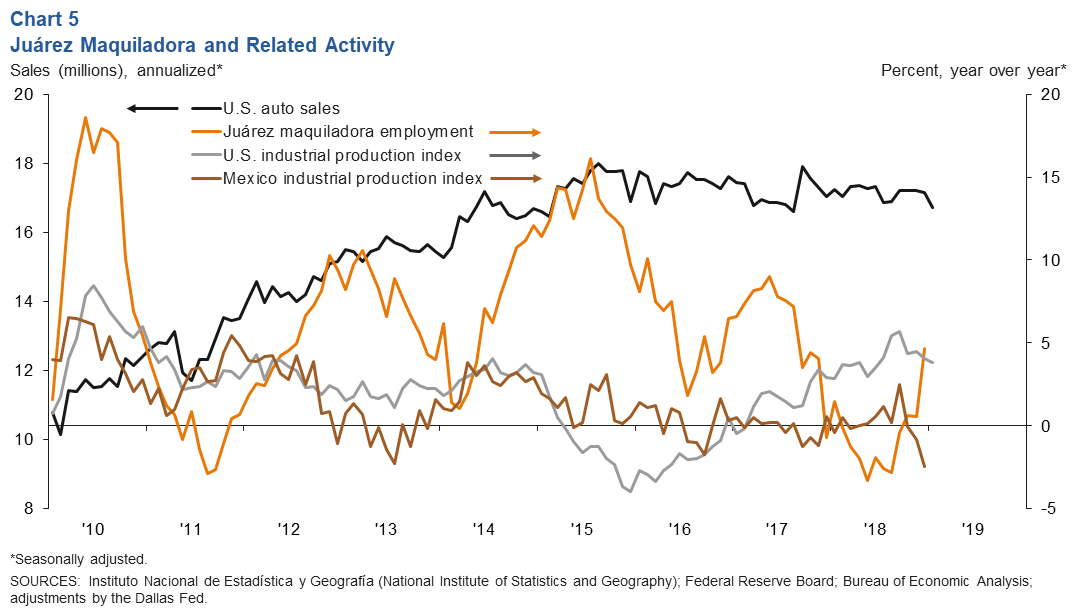
Across the border from El Paso, Juárez maquiladora employment posted year-over-year growth in December. According to Mexico's official series, maquiladora employment rose 4.7 percent in December to 278,315.
U.S. auto and light-truck production was 10.4 million units in January, less than the 10.6 million units produced a year earlier. Meanwhile, monthly auto sales totaled 16.7 million, lower than the 17.3 million sold a year earlier. Auto sales are closely linked to the local economy because roughly half of maquiladoras in Juárez are auto related.
NOTE: Data may not match previously published numbers due to revisions. The El Paso metropolitan statistical area includes El Paso and Hudspeth counties.
About El Paso Economic Indicators
Questions can be addressed to Marycruz De León at marycruz.deleon@dal.frb.org. El Paso Economic Indicators is released on the fourth Wednesday of every month.