El Paso Economic Indicators

The El Paso Business-Cycle Index signaled expansion in the metro. Total nonfarm jobs increased in August. Housing sales continued to weaken, as inventories tightened and prices rose further. Trade volumes were down year over year in July, and industrial activity on both sides of the border showed signs of deceleration.
Business-Cycle Index
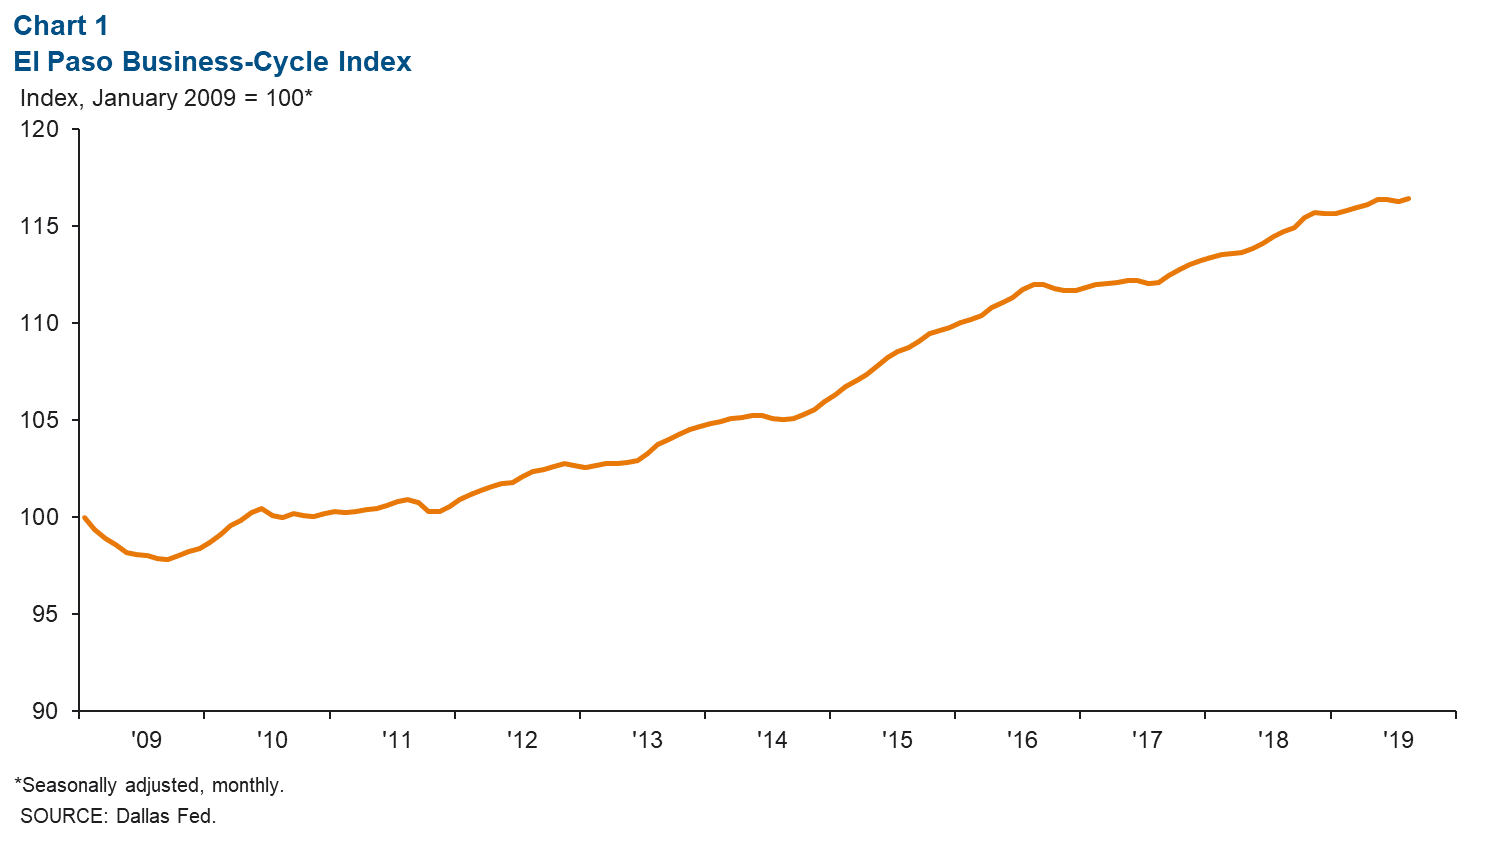
The El Paso Business-Cycle Index increased an annualized 1.6 percent in August (Chart 1). The pickup in job growth helped the index rebound after its decline in June and July.
Labor Market
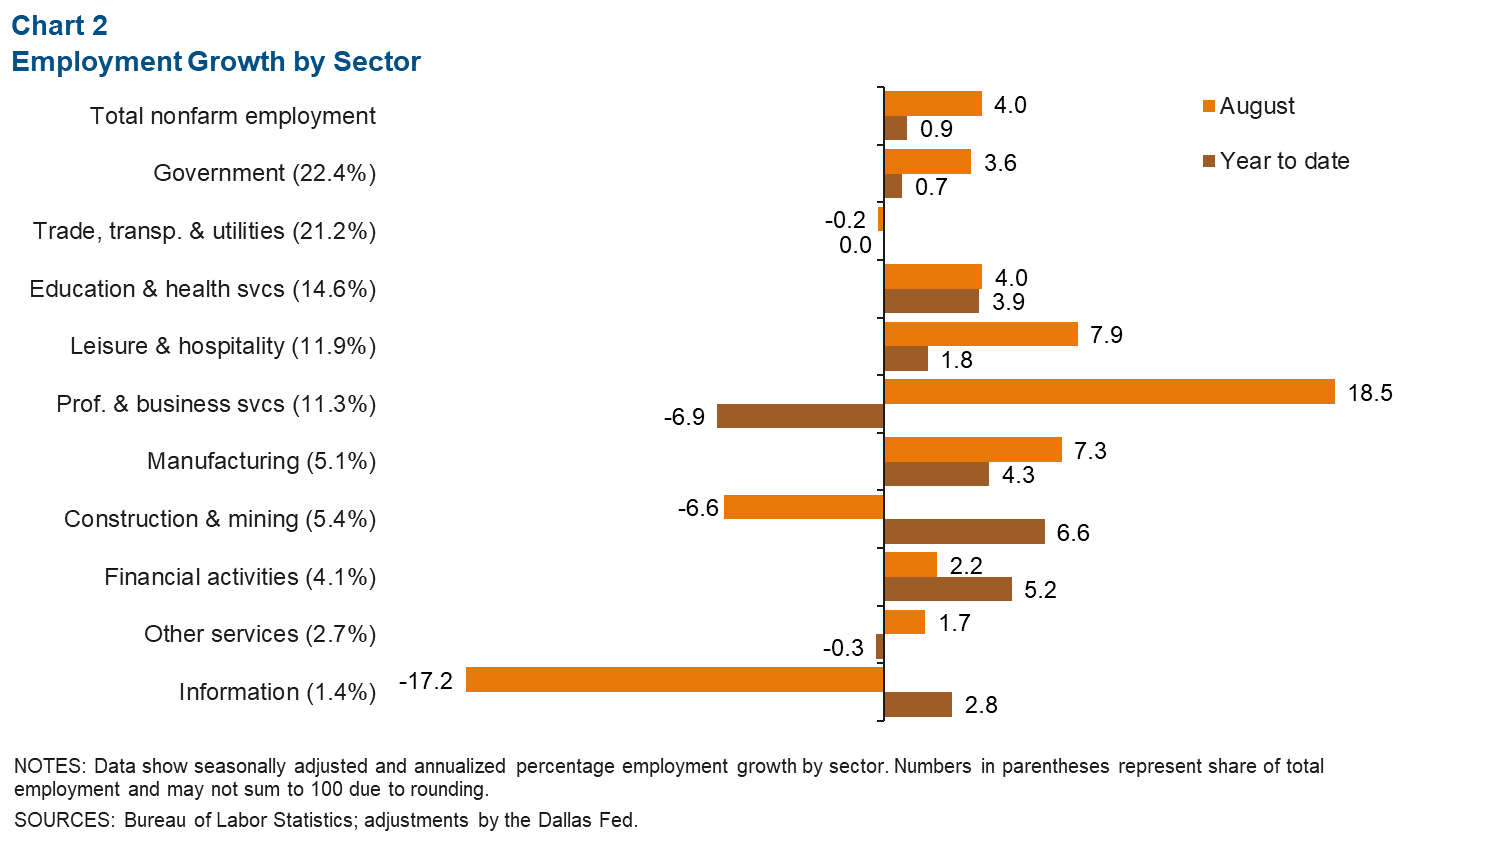
August employment rose an annualized 4.0 percent, or a net addition of 1,052 jobs (Chart 2). Since the start of the year, payrolls have grown at a 0.9 percent annual rate, adding 2,010 jobs. The education and health services sector contributed the most to year-to-date employment gains, adding 1,210 jobs. In contrast, the professional and business services sector has lost the most jobs (1,700) since the beginning of 2019. Even though the professional and business services sector has shed jobs year to date, the sector added 490 jobs from July to August.
The El Paso unemployment rate remained at 3.8 percent in August. The Texas and U.S. monthly unemployment rates also were unchanged for a third straight month at 3.4 percent and 3.7 percent, respectively.
Housing Market
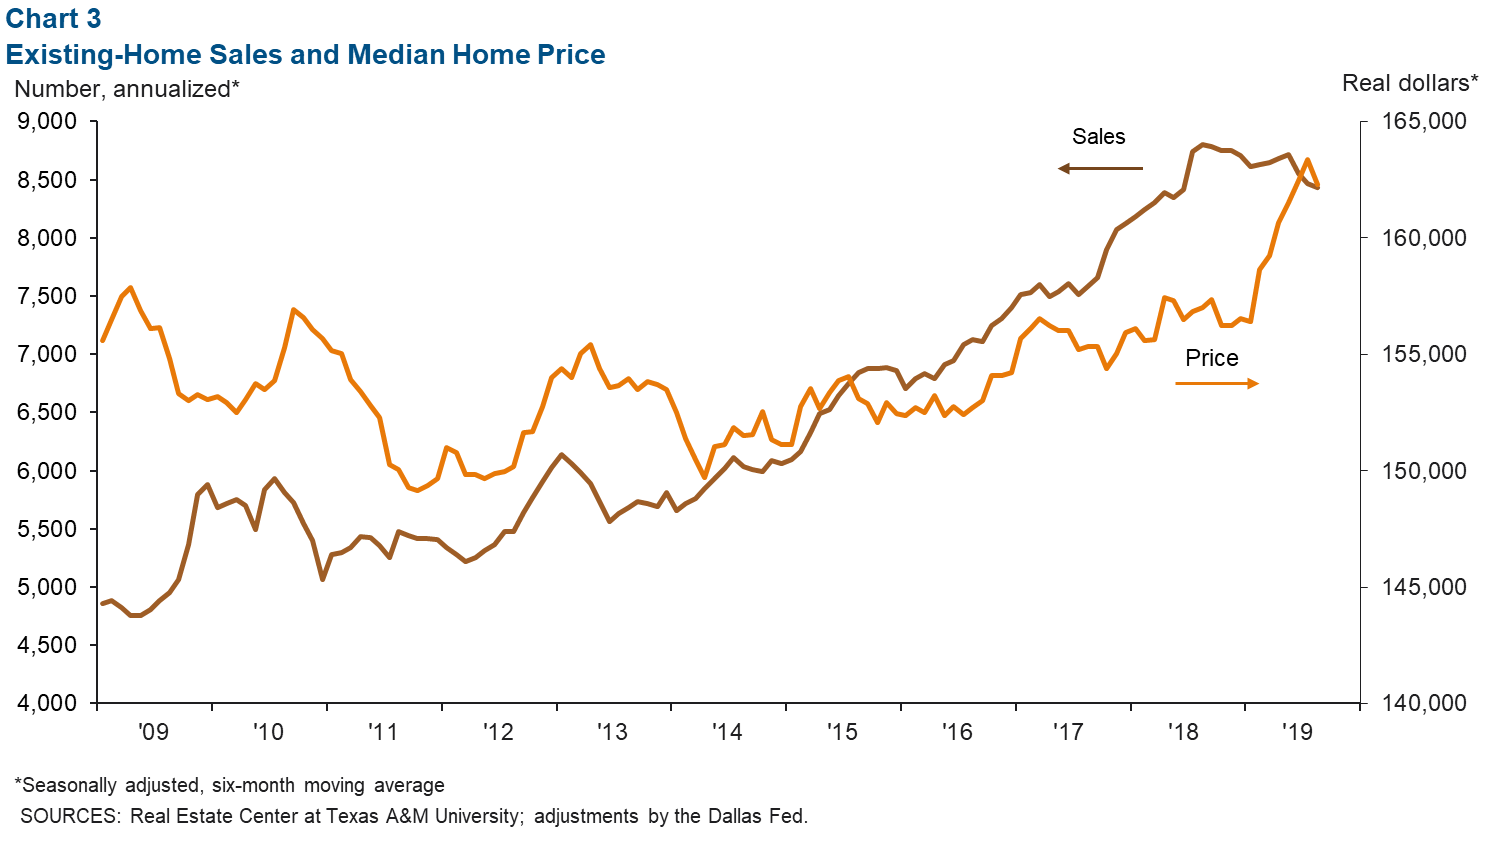
The El Paso housing market experienced a weak sales season in summer 2019. El Paso existing-home sales declined 4.2 percent year to date (annualized) to 8,435 in August, in part due to tight inventories (Chart 3). Housing inventories stood at 3.6 months, well below the six months considered a balanced market. With low inventory, home-price growth has strengthened. The median home price was $162,289 in August, up 3.4 percent from a year ago. According to the Federal Housing Finance Agency, El Paso ranks No. 10 out of 100 metropolitan statistical areas in housing-price growth over the past year (second quarter 2018 through second quarter 2019).
Trade
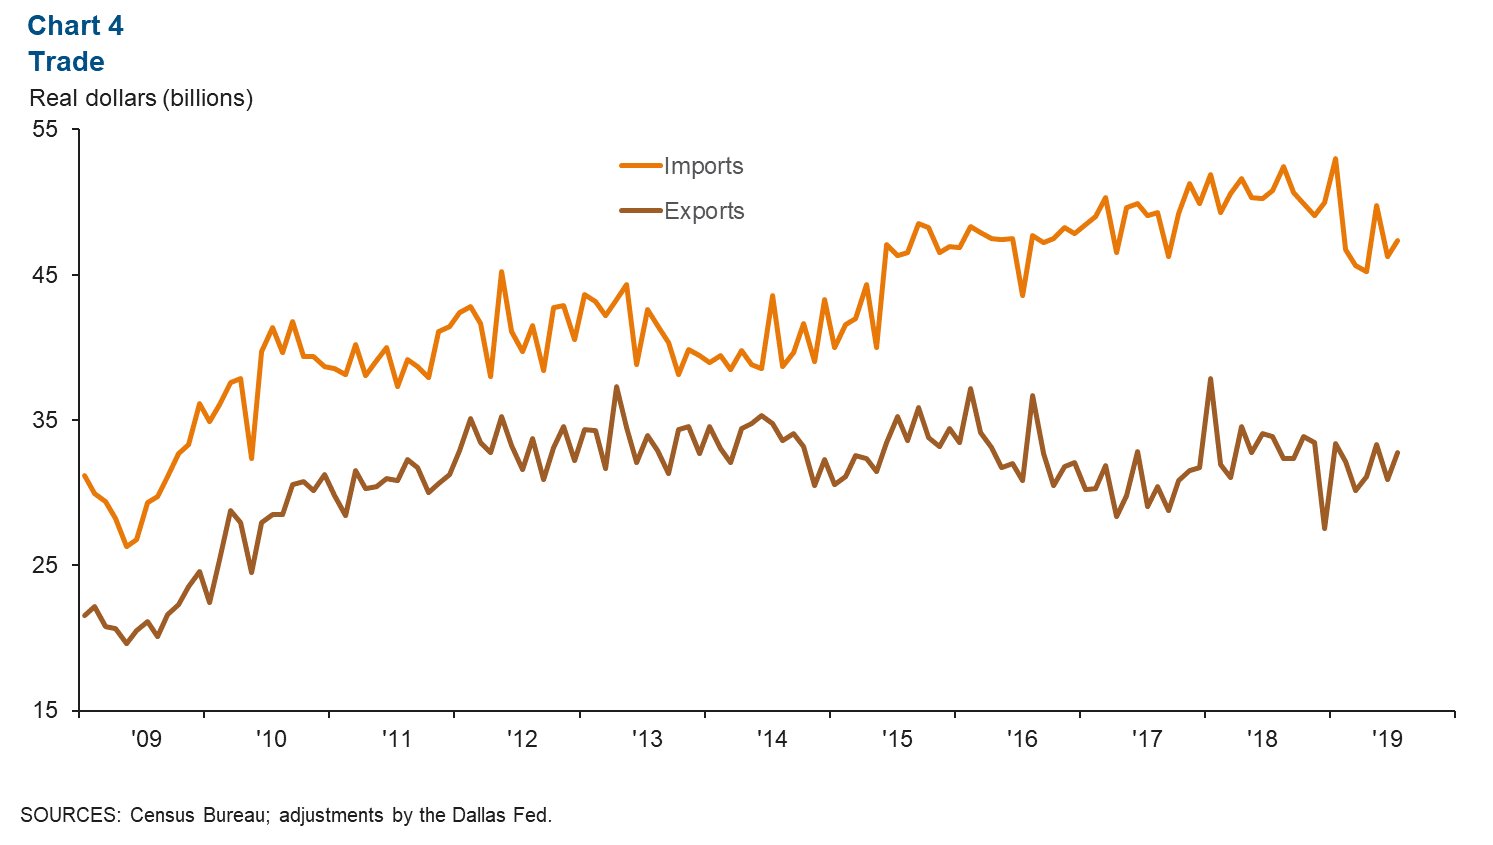
Annualized trade in El Paso totaled $80.2 billion in July, 5.4 percent down from $84.7 billion a year earlier (Chart 4). Diminished imports and exports led to the drop in trade volumes. Imports totaled $47.4 billion in July, a year-over-year decrease of 6.7 percent, while exports totaled $32.8 billion, a decline of 3.3 percent from July 2018.
Industrial Production and Maquiladora Activity
U.S. industrial production was up 0.4 percent year over year in August, its slowest growth since February 2017 (Chart 5). The Institute for Supply Management manufacturing index fell from 51.2 in July to 49.1 in August, signaling a contraction in the manufacturing sector and ending the 35-month expansion streak. U.S. and Mexican production and manufacturing trends are important to the local economy because of cross-border manufacturing relationships.
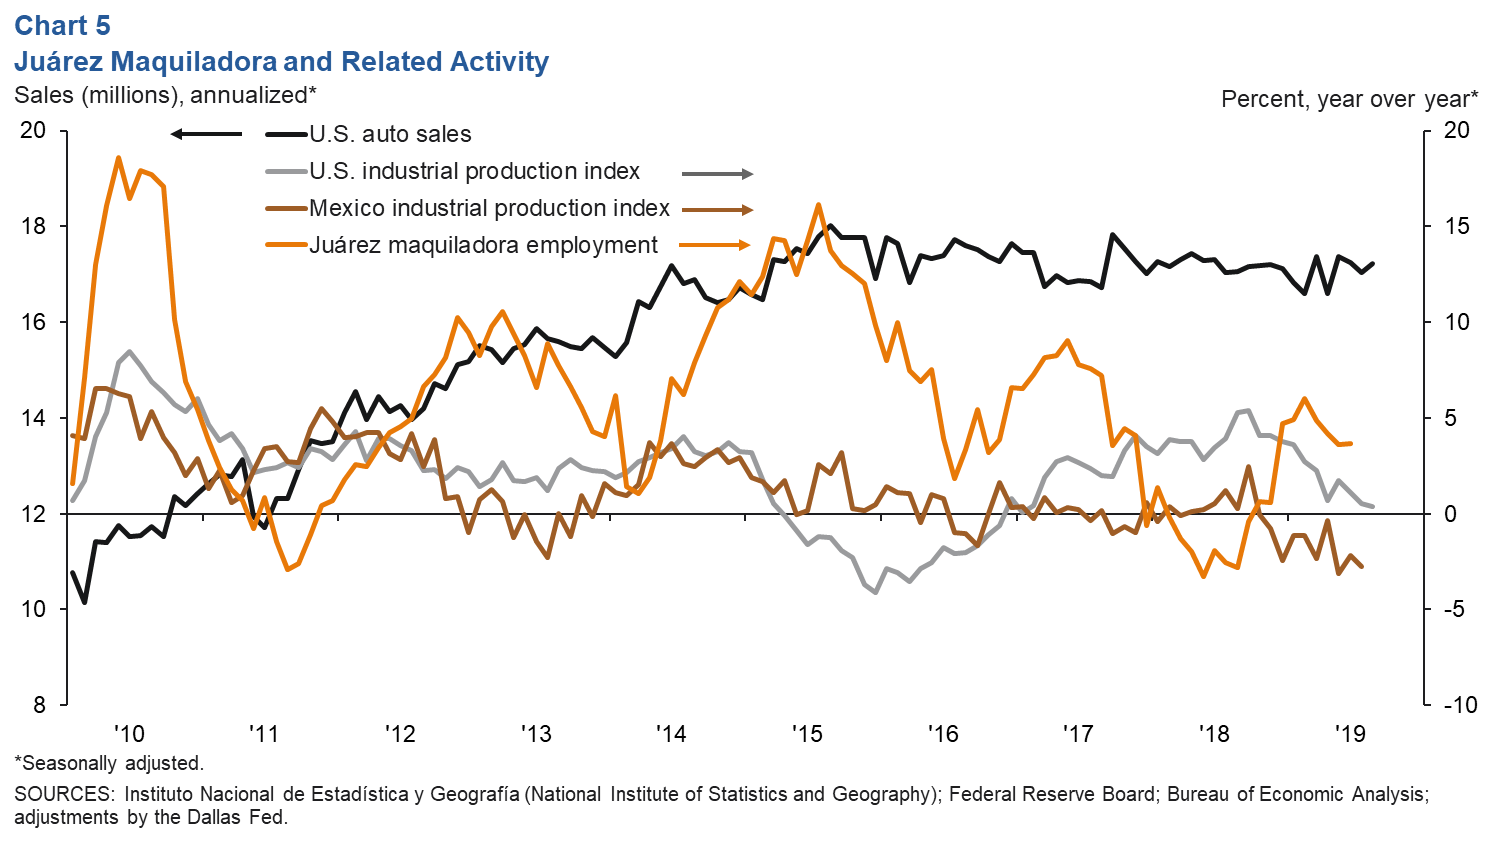
According to Mexico’s official series, maquiladora employment in Ciudad Juárez rose 3.7 percent year over year in June to 278,615. In the first half of 2019, 2,000 jobs were added in the maquiladora sector. U.S. auto and light-truck production was 10.9 million in August 2019, mostly unchanged from the 11.0 million produced a year earlier. Similarly, monthly auto sales were relatively unaffected, with 17.2 million sold in August 2019 versus 17.1 million in August 2018. Auto sales are closely linked to the local economy because roughly half of maquiladoras in Juárez are auto related.
NOTE: Data may not match previously published numbers due to revisions. The El Paso metropolitan statistical area includes El Paso and Hudspeth counties.
About El Paso Economic Indicators
Questions can be addressed to Keighton Allen at keighton.allen@dal.frb.org. El Paso Economic Indicators is released on the fourth Wednesday of every month.