Houston Economic Indicators

Professional services and manufacturing are leading growth in the Houston economy. The energy sector is expanding at an accelerated pace, leading to strong export growth. Lending at local banks has been outpacing the state and the nation. Healthy gains in the Houston Leading Index and the Houston Business-Cycle Index suggest a continued positive outlook.
Business-Cycle and Leading Indexes
Growth in the Houston Business-Cycle Index was 6.2 percent in the three months ending in May 2018—well above its longer-run average of 3.2 percent (Chart 1). The index has been growing at an accelerated rate since November 2017 due to the effects of a growing energy industry, a post-Hurricane Harvey boost, broader global economic strength and continued growth in the U.S. economy.
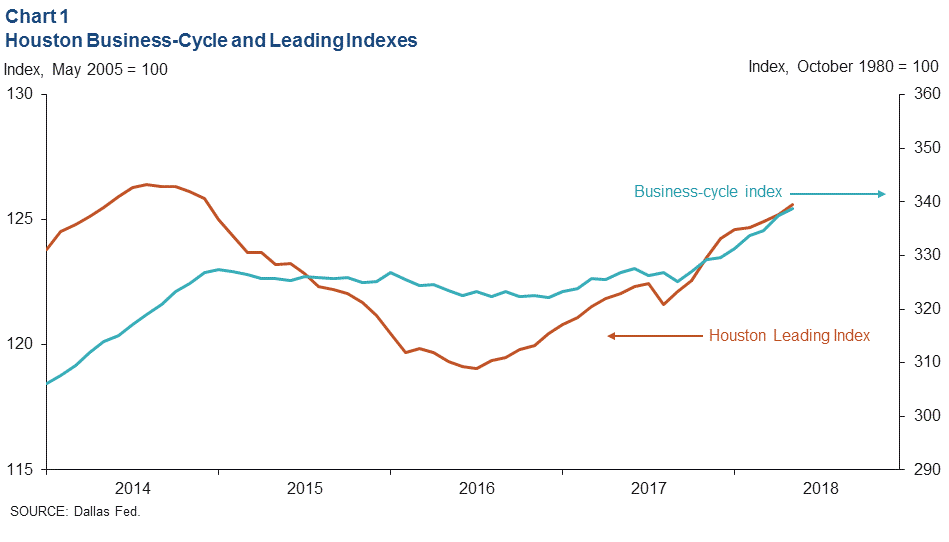
An index of 11 leading indicators for Houston accelerated slightly the last several months. The annualized growth rate of 2.9 percent over the three months ending in May is supportive of Houston job growth in the months ahead.
Employment
Houston jobs grew at a strong annualized pace of 4.0 percent over the three months ending in May (about 30,500 jobs) (Chart 2). The biggest gains were in professional and business services (11,200), followed by manufacturing (4,800) and education and health services (3,000). None of the broad industry groups in Houston logged employment declines over this period.
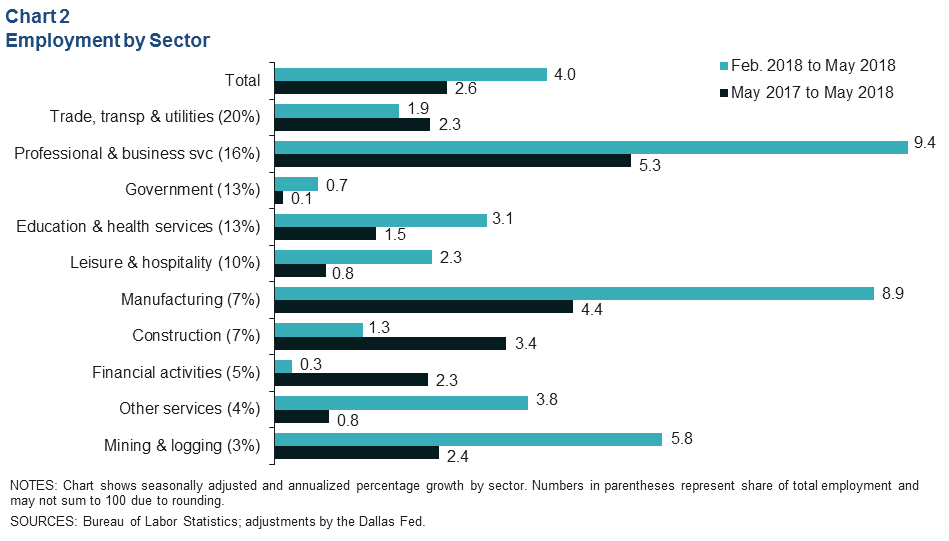
Year-over-year job growth was 2.6 percent in May (77,000), comfortably above Houston’s long-run trend of 2.1 percent. Professional and business services (25,300) and manufacturing (9,700) were the fastest-growing supersectors, though trade, transportation and utilities (14,300) added more jobs than the latter.
The unemployment rate in Houston slipped 0.1 percentage points from April to 4.5 percent in May. For comparison, the unemployment rates in Texas and the U.S. were 4.1 percent and 3.8 percent, respectively, in May.
Early benchmarking of employment data took some of the shine off year-end numbers for 2017. The December 2016 to December 2017 job growth numbers were revised down from 1.9 percent (about 58,000 jobs) to 1.7 percent (51,100). The largest downward revisions were to professional and business services (9,000), mostly from employment services (staffing firms). The largest upward revisions were to health care (3,500) and manufacturing (2,000).
Oil and Gas Industry
Energy Recovery Picks Up Speed
The price of West Texas Intermediate (WTI) crude rose from the low $60s per barrel in the early months of 2018 to an average of $70 in May on falling inventories, production outages and geopolitical risks to supply (Chart 3). Growth in the rig count—which tends to lag changes in the price of WTI by about three months—has picked up. The U.S. rig count reached a near-three-year high in early June with 1,062 rigs. The June price of WTI averaged $65.95 through June 22, well above the price needed to drill new wells in most regions of the United States.
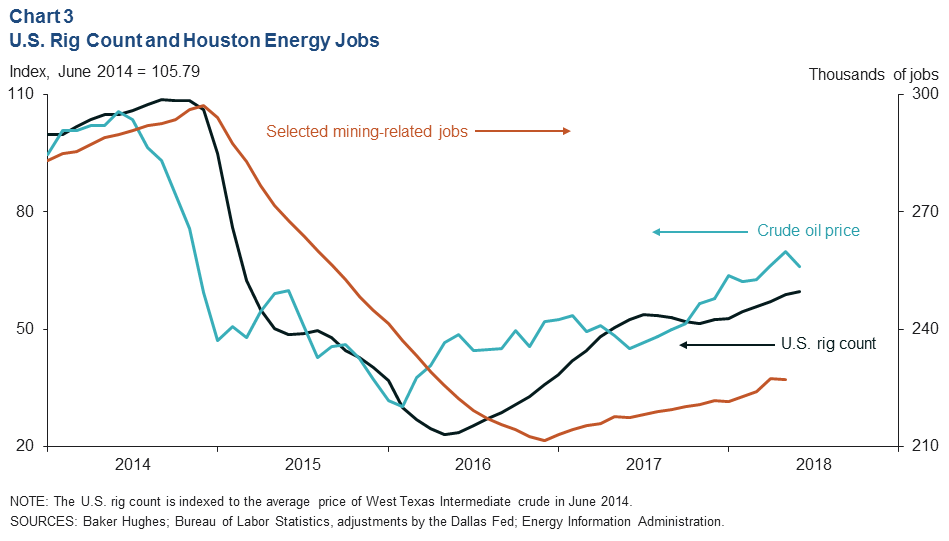
On June 22, OPEC and several other nations agreed to increase crude oil production in the second half of 2018, which should have a moderating effect on oil prices.
Despite a modest one-month decline from April to May, mining-related job growth has been accelerating in 2018 in response to higher oil prices and drilling activity. Altogether, these sectors have added back 18 percent (15,500) of the jobs lost during the 2015-2016 oil bust. That recovery has been concentrated in energy-related manufacturing. The direct mining industry recovery has been more focused in the oilfield, outside of the head offices in Houston.
Mining-Related Job Growth Focused on Services and Supply Chain
Mining-related employment accelerated over the last three months, propelled in part by higher energy prices. Fabricated metals (1,600) added the most jobs over that time frame (Chart 4). At 19.2 percent, agriculture, construction and mining machinery (1,300) saw its fastest three-month growth rate since June 2012, not counting the 21.8 percent logged in April. Support activities for mining (1,000) accelerated to a three-month rate of 10.7 percent, its fastest in nearly a year.
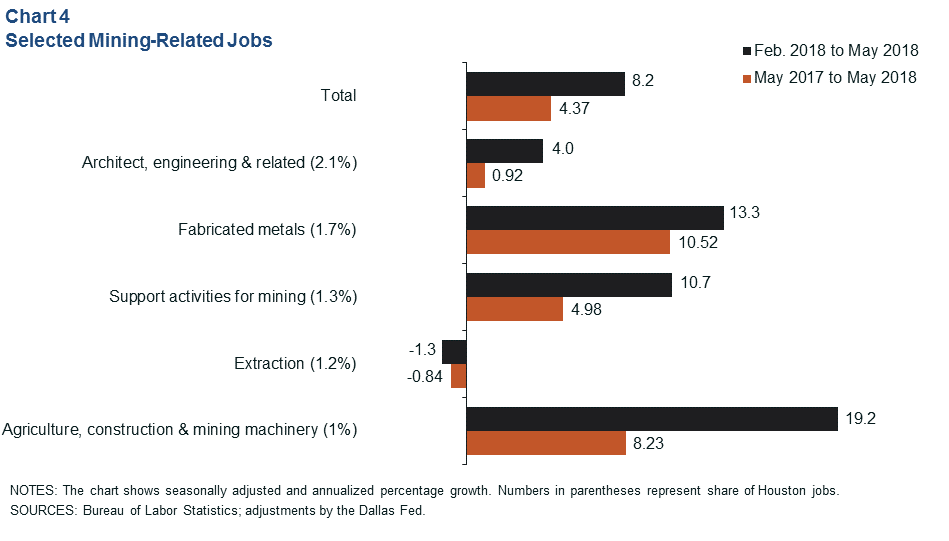
While oil and gas tend to dominate fluctuations in employment for these sectors in Houston, there are other factors at play in recent growth. Engineering services and midstream firms have seen an increase in activity according to the Institute for Supply Management Houston Business Survey, and manufacturing demand has been buoyed more broadly by a healthier economy and a falling value of the Texas trade-weighted value of the dollar.
Energy-Related Exports Rising
Flows of U.S. oil and gas production to local ports are increasing (Chart 5). Nominally, oil and gas, chemicals and petroleum and coal products accounted for three-quarters of the value of 2018 domestic exports from the Houston–Galveston customs district through April. Domestic exports consist of goods produced, altered or enhanced in value in the U.S., including in foreign-trade zones.
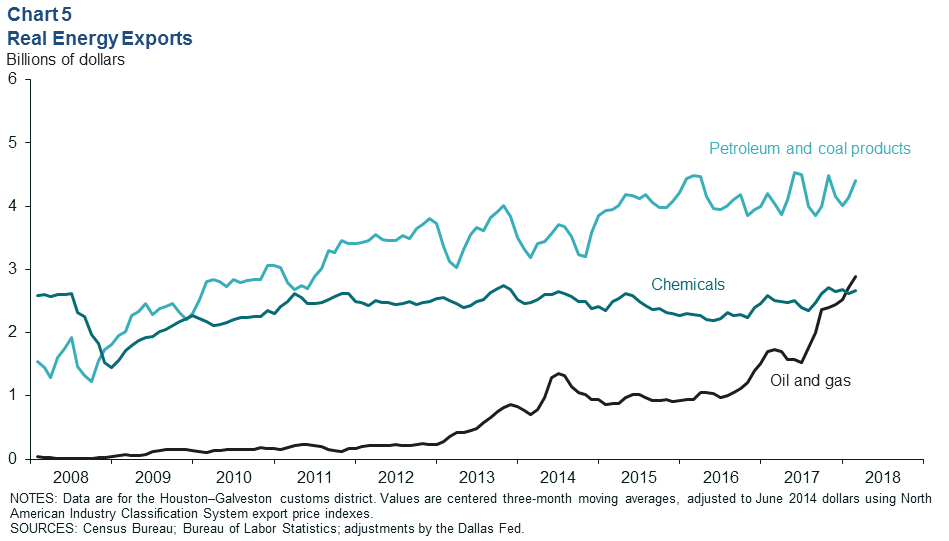
Exports of oil and gas—including liquefied natural gas—were up 67.1 percent from January through April 2018 compared with the same period in 2017 (203.8 percent compared with 2016). By that same measure, petroleum and coal products exports, such as diesel, propane and motor oil, were up 4 percent (down 2.5 percent compared with 2016).
Year-to-year growth in domestic exports of chemicals through April slowed to 5.8 percent in 2018, after rising 10.5 percent in 2017. This category includes a variety of inorganic and organic chemicals and their derivatives, including plastic pellets and other petrochemicals produced from natural gas liquids like ethane and propane.
Houston Area Loan Growth
The outstanding value of loans in the Houston area grew at a faster year-to-year pace (13.4 percent) than in the U.S. and Texas (Chart 6) in first quarter 2018. Commercial and industrial loan growth—loans to businesses used as working capital or to finance equipment purchases—drove Houston’s relative strength. Nonresidential lending and construction and land development loans followed, both logging over 11 percent year-to-year growth, outpacing the state and the nation.
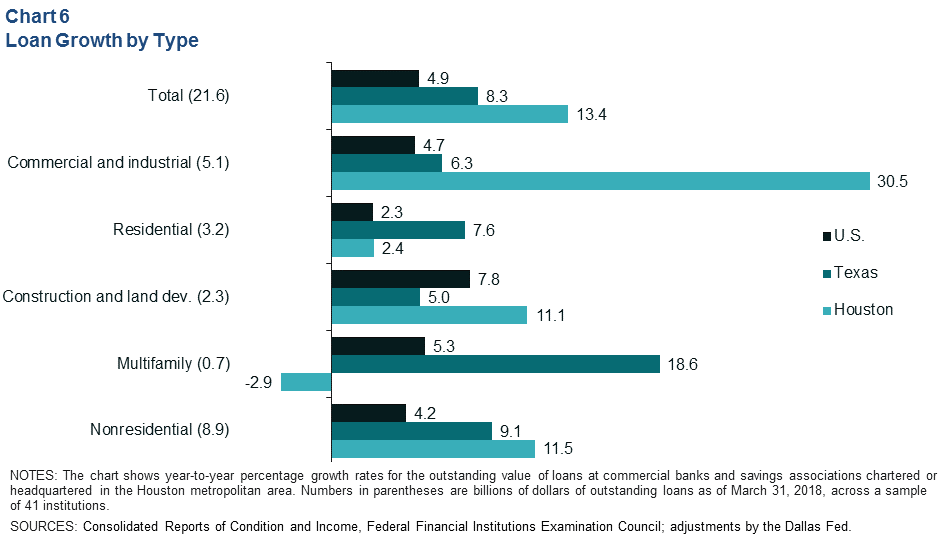
Conversely, residential lending grew at a slower pace than the state average, and the value of multifamily loans on the books at local lenders contracted in part because the pipeline of new projects slowed after the building frenzy of the last few years.
NOTE: Data may not match previously published numbers due to revisions.
About Houston Economic Indicators
Questions can be addressed to Jesse Thompson at jesse.thompson@dal.frb.org. Houston Economic Indicators is posted on the second Monday after monthly Houston-area employment data are released.