Houston Economic Indicators

Recent data for Houston were positive. Coincident and leading indicators logged mostly healthy growth, unemployment was down and employment growth picked up in initial estimates. On the other hand, the local labor force, rig counts and single-family permits slipped. Taken together, these data suggest a healthy near-term outlook for the Houston region.
Business-Cycle Index
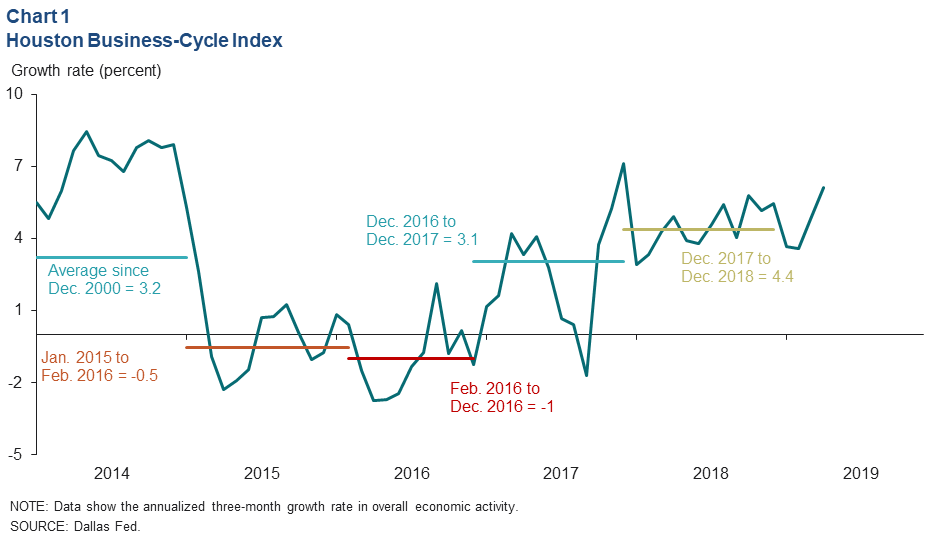
The Houston Business-Cycle Index grew a robust 4.4 percent last year after incorporating revised employment, unemployment, retail sales and real wage data for the fourth quarter of 2018 (Chart 1). While substantially higher than the historical average growth rate of 3.2 percent, this was still a far cry from the 6.5 percent growth the metro saw in 2014 before the 2015–16 oil bust.
Looking at the most recent data, the index accelerated to an annual growth rate of 6.2 percent for the three months ending in April.
Employment by Sector
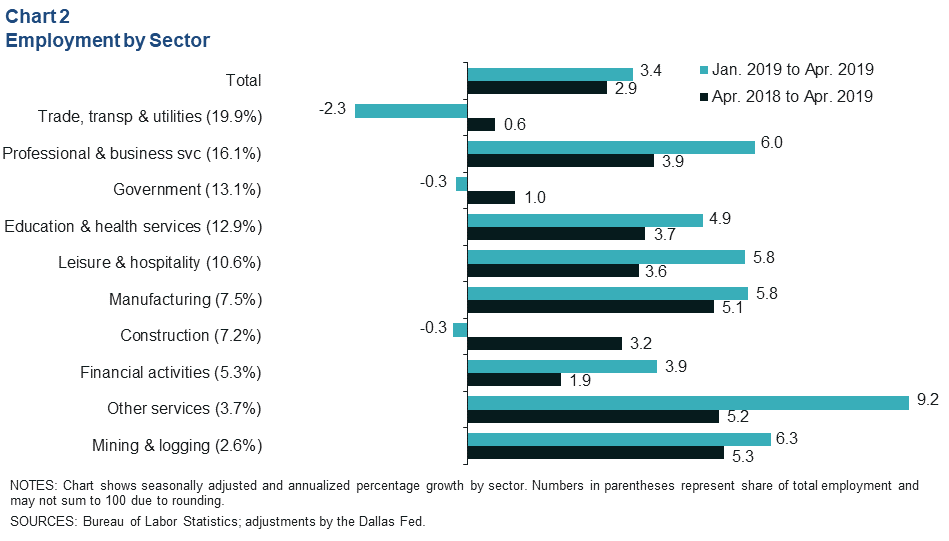
Employment accelerated to a 3.4 percent annual growth rate (26,400 jobs) over the three months ending in April (Chart 2). Professional and business services (7,300), education and health services (4,800) and leisure and hospitality (4,700) added the most jobs over that time frame. Other services (2,500)—including varied services such as auto mechanics and laundromats—had the fastest growth rate. Job losses were concentrated in the trade, transportation and utilities sector (-3,700).
Houston Labor Force and Unemployment
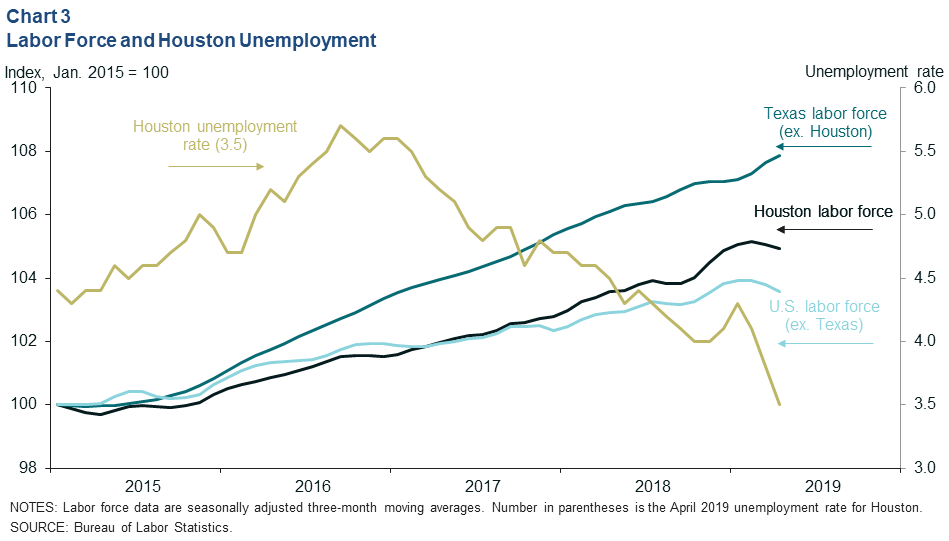
The unemployment rate in Houston fell to 3.5 percent in April, a historic low if it stands up to future revisions (Chart 3). The low unemployment rate occurred as the size of the local labor force slipped. In contrast, the unemployment rate for Texas excluding Houston has been essentially flat, around 3.7 percent for the last three months, despite continued growth in the state’s labor force.
For the U.S. outside of Texas, the most recent data more closely resemble Houston. A decline in the nation’s labor force contributed to a record-low unemployment rate of just under 3.6 percent.
Houston Leading Index
Index of Leading Economic Indicators Accelerates
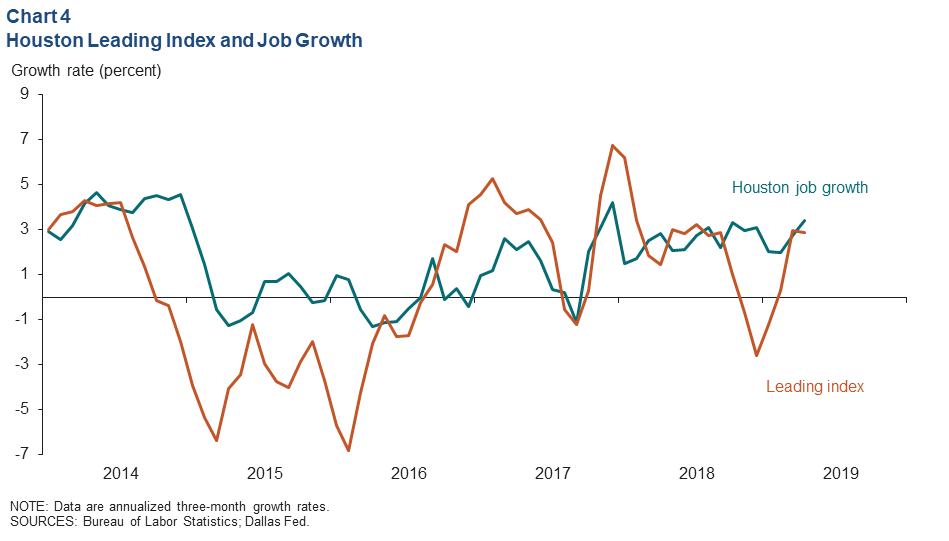
An index of 11 leading indicators for Houston employment grew at an annual pace of 2.8 percent over the three months ending in April (Chart 4). That is slightly slower than the 3 percent growth seen for the three months ending in March but consistent with healthy job growth over the next three to six months. Over its history, this leading index averaged a 1.8 percent annual growth rate.
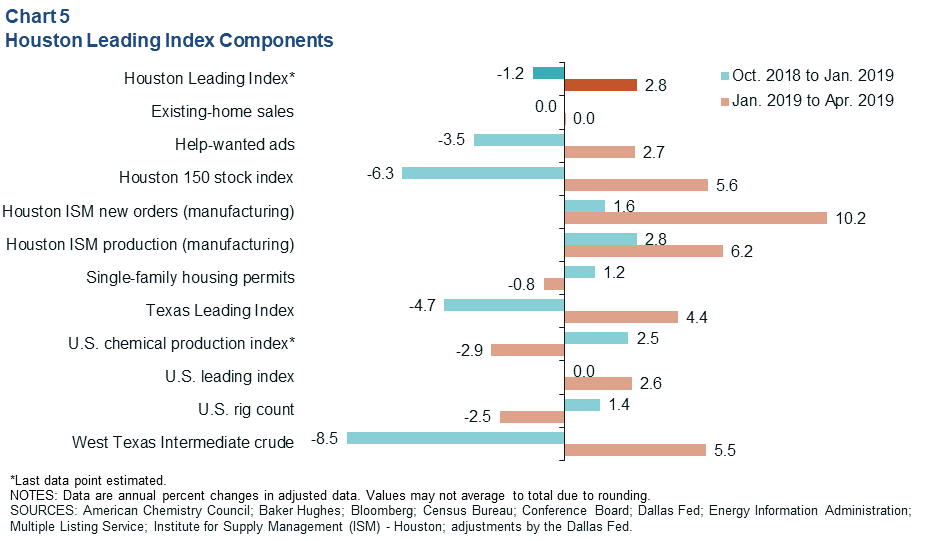
Leading Index Components Show Broad-Based Growth
The January to April growth was a reversal from the -1.2 percent growth rate for the prior three-month period. Looking across leading index components, the main drivers of the improvement were crude oil prices, the stock market and the Texas Leading Index, which all flipped from negative to positive for Houston (Chart 5). The biggest drags on the index were U.S. chemical production, followed by the U.S. rig count and permits for single-family housing construction.
Purchasing Managers Index
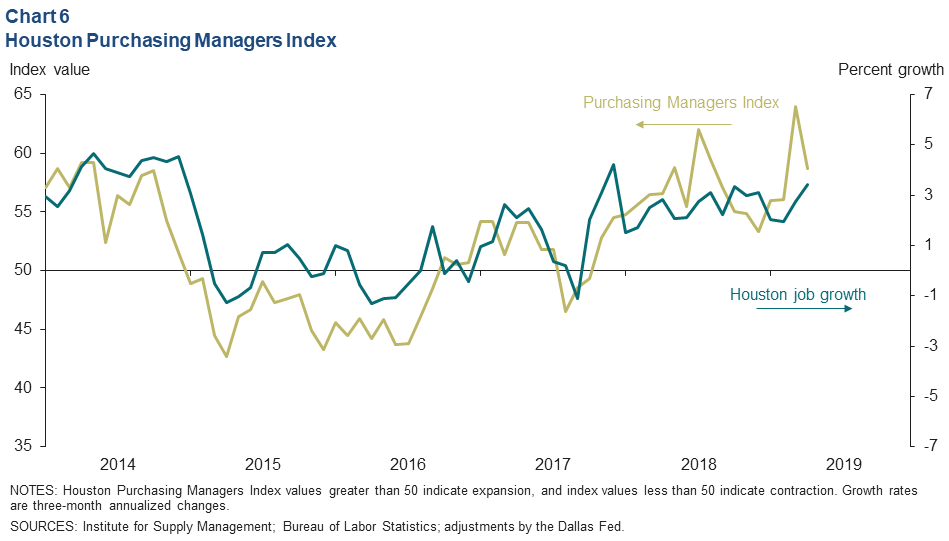
The Purchasing Managers Index produced by the Houston Institute for Supply Management (ISM) registered 58.7 in April, a robust reading that suggests the local economy is expanding and should see healthy job growth over the next three months (Chart 6). Area industries broadly indicated strong to moderate expansion in the May ISM report, including energy sectors, engineering and related services and construction, wholesale trade, health care, and professional and business services.
NOTE: Data may not match previously published numbers due to revisions.
About Houston Economic Indicators
Questions can be addressed to Jesse Thompson at jesse.thompson@dal.frb.org. Houston Economic Indicators is posted on the second Monday after monthly Houston-area employment data are released.