Houston Economic Indicators

July 9, 2021
Economic indicators were mixed for Houston in May and June as jobs data painted an uneven picture of improvement in health, construction, and small businesses in general. The outlook appears positive even as the pandemic, economic reopening and effects of Winter Storm Uri complicate the interpretation of area indicators. Permits for residential construction remain elevated, and all 10 components of an index of leading indicators for Houston are signaling acceleration.
Employment
More Hourly Workers on the Job
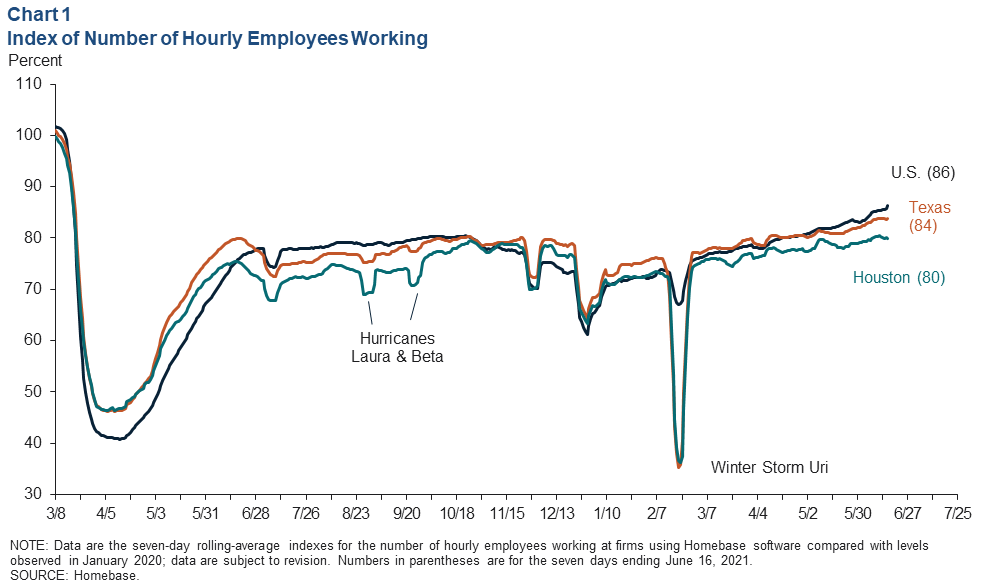
Houston small businesses extended their postfreeze jobs recovery in June. The number of hourly workers clocking in at small businesses climbed in late June to 80 percent of early 2020 levels (Chart 1). Statewide, the number rose to 83 percent. However, the pace of local job growth in Texas slowed in mid-June, consistent with feedback from Dallas Fed business survey respondents, who noted heightened difficulty in hiring, particularly for hourly and lower-skill and lower-wage jobs. The number of hourly workers clocking in nationally surged in June to 88 percent of prepandemic levels.
Social Assistance Recovery Lagging
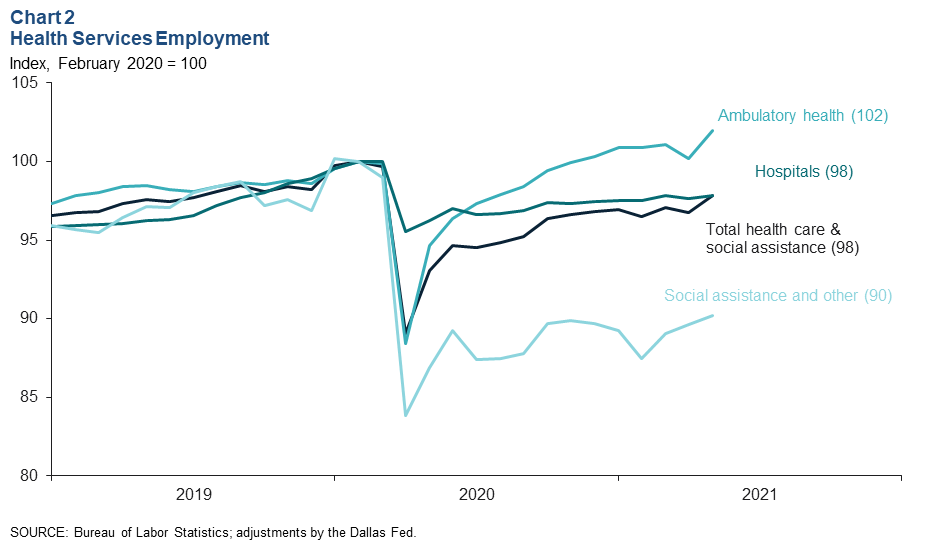
Health care and social assistance employment is at 98 percent of prepandemic levels—short by 7,564 jobs (Chart 2). Jobs in ambulatory health—such as those in physicians’ offices—are up 2 percent from February 2020, while hospital employment is down 2 percent. Jobs in social assistance—which includes child-care and assisted-living facilities—have been trending up over the past year but remain down 10 percent from prepandemic levels.
Construction Jobs Slow to Recover
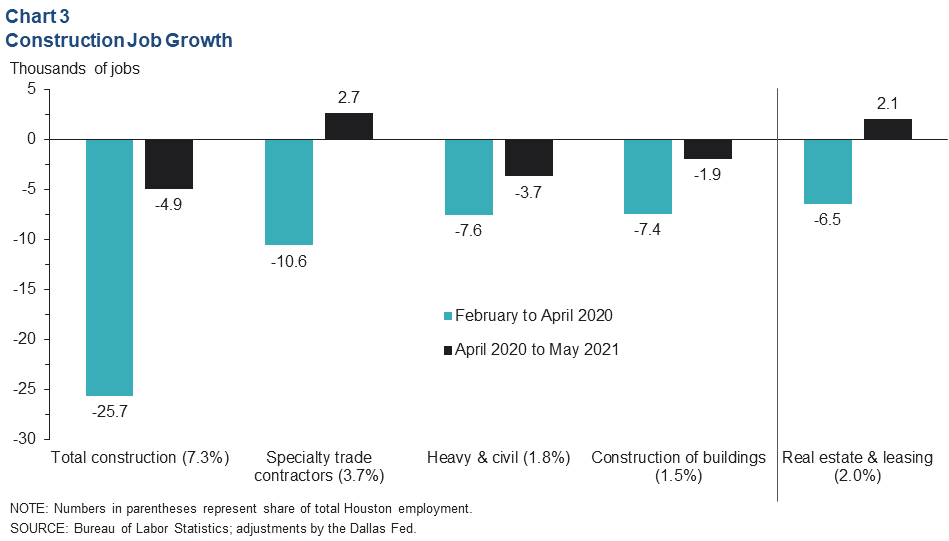
Construction employment is still down a net 4,900 jobs from April 2020 despite improvements over the past year for specialty trade contractors (such as plumbers and electricians) (Chart 3). Heavy and civil construction logged additional heavy losses due in part to the downturn in energy and the completion of several pipelines and petrochemical plants.
While construction lags behind, real estate and leasing businesses are adding back jobs amid the robust demand for new and existing homes.
Residential Housing Permits
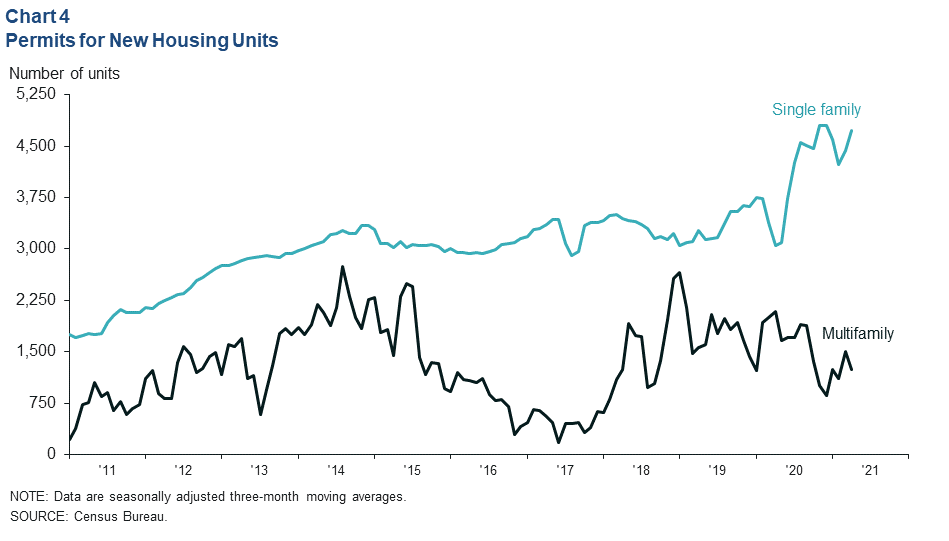
Permits for single-family construction remained elevated in May, though survey and industry feedback suggests that supply shortages and difficulty hiring are constraining activity (Chart 4). Multifamily construction permits were down slightly from year-ago levels but remain elevated compared with the early- and mid- 2010s, when the housing and shale busts, respectively, depressed building activity in the region.
Restaurant Demand
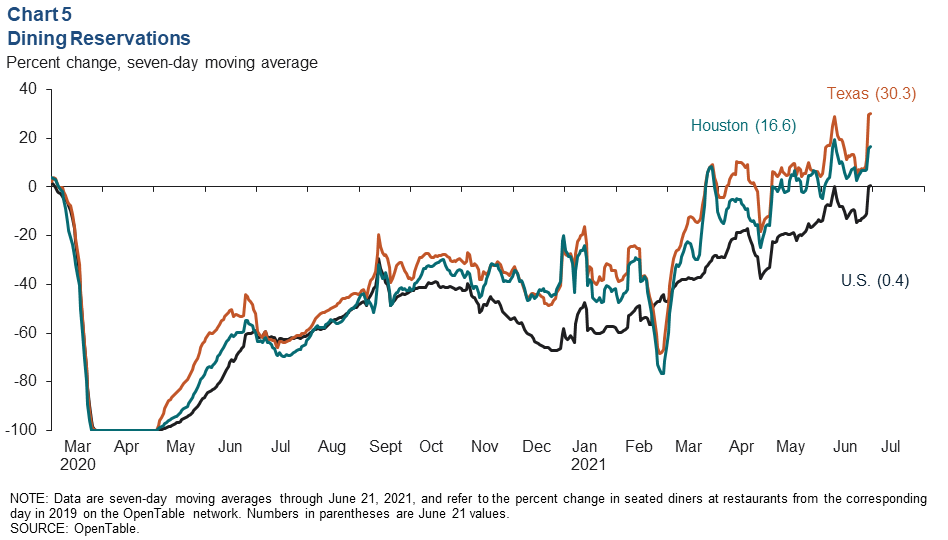
The leisure and hospitality industry has added an estimated 46,600 jobs since April 2020, which is short of prepandemic levels by a net 29,960 jobs. Restaurant demand based on seated dining in Houston was up nearly 17 percent in June from 2019 levels, and demand in the state was up more than 30 percent (Chart 5). Comments from surveys and industry leaders suggest that these numbers could be higher, but the availability of labor and challenges with supply chains and pricing are forcing some firms to limit their capacity and offerings.
Leading Indicators
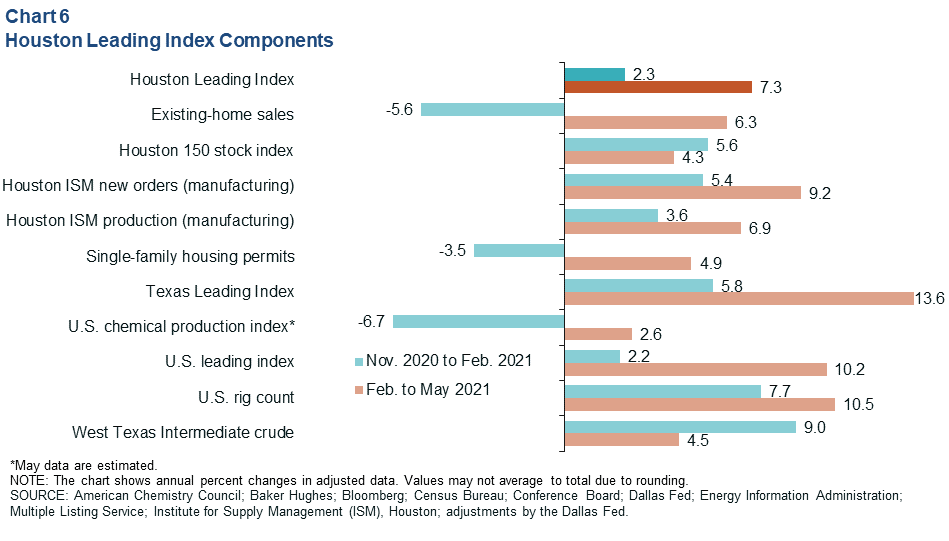
The Houston leading index was up 7.3 percent over the three months ending in May, a sharp increase compared with the 2.3 percent seen the prior three-month period (Chart 6). All 10 components of the index logged strong gains, but existing-home sales saw the biggest jump, shifting from a decline of 5.6 percent to growth of 6.3 percent and boosting the aggregate index. The strong performance was due in part to the recovery from Winter Storm Uri but also to the steady reopening of the broader economy as the pandemic recedes.
NOTE: Data may not match previously published numbers due to revisions.
About Houston Economic Indicators
Questions can be addressed to Jesse Thompson at jesse.thompson@dal.frb.org. Houston Economic Indicators is posted monthly after Houston-area employment data are released.