Houston Economic Indicators

December 6, 2022
| Houston Economy Dashboard (October 2022) | |||
| Job growth (annualized) July–October |
Unemployment rate |
Avg. hourly wages |
Avg. hourly wage growth y/y |
| 3.8% | 4.4% | $31.65 | 5.0% |
Houston has continued to add jobs at a strong pace, with leisure and hospitality leading growth and construction receding slightly in the last three months. Though mortgage rates remain high, home sales, new building permits and home price growth have started to level out. Recent data show positive signs that Houston’s real estate market is stabilizing after the pandemic boom.
Employment
Employment numbers across the state were revised down this month per the Dallas Fed’s quarterly benchmark revision process. This removed 42,600 jobs from Houston’s year-to-date job growth through October.
With those revisions, Houston employment expanded 2.9 percent in the first 10 months of 2022, adding 149,065 jobs (Chart 1). This is below Texas’ 3.4 percent growth and the U.S.’ 3.3 percent growth for that period. The previously hard-hit leisure and hospitality sector grew the most, with employment rising to 362,000 jobs in October.
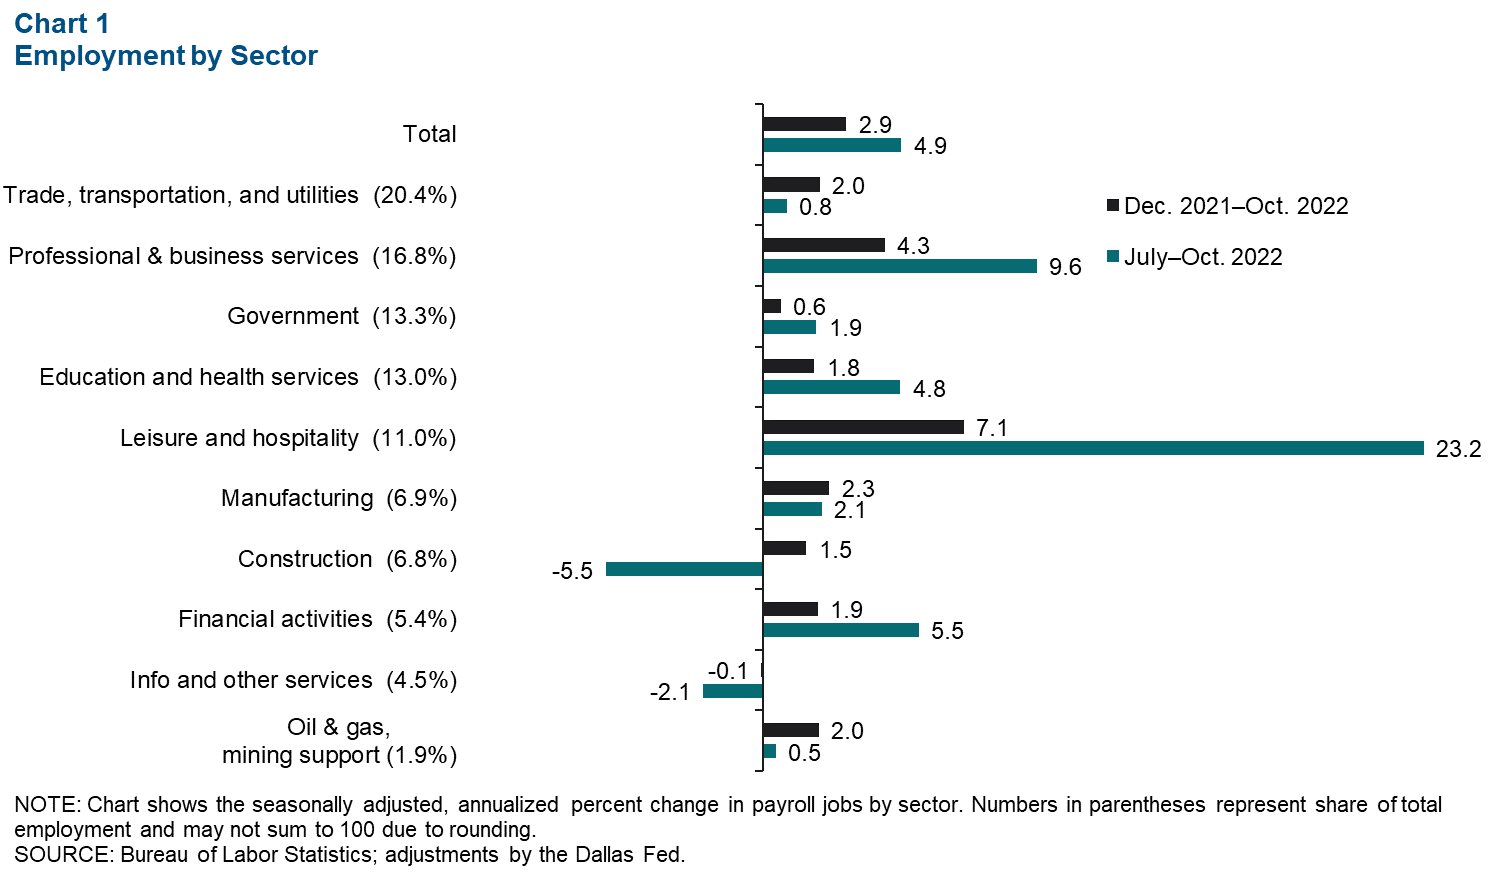
Only two sectors saw a decline in employment in the last three months: information and other services and construction. Construction shed almost 5,200 jobs from August to October, likely in reaction to slowing demand for new housing caused by skyrocketing mortgage rates.
Real estate
Home-price growth slows
After record-high home-price growth in first quarter 2022, Houston’s home-sale price growth slowed to 12.6 percent year over year for the third quarter. This growth was slower than Texas’ (14.3 percent) and similar to the U.S.’ gains (12.4 percent) for the same period. (Chart 2).
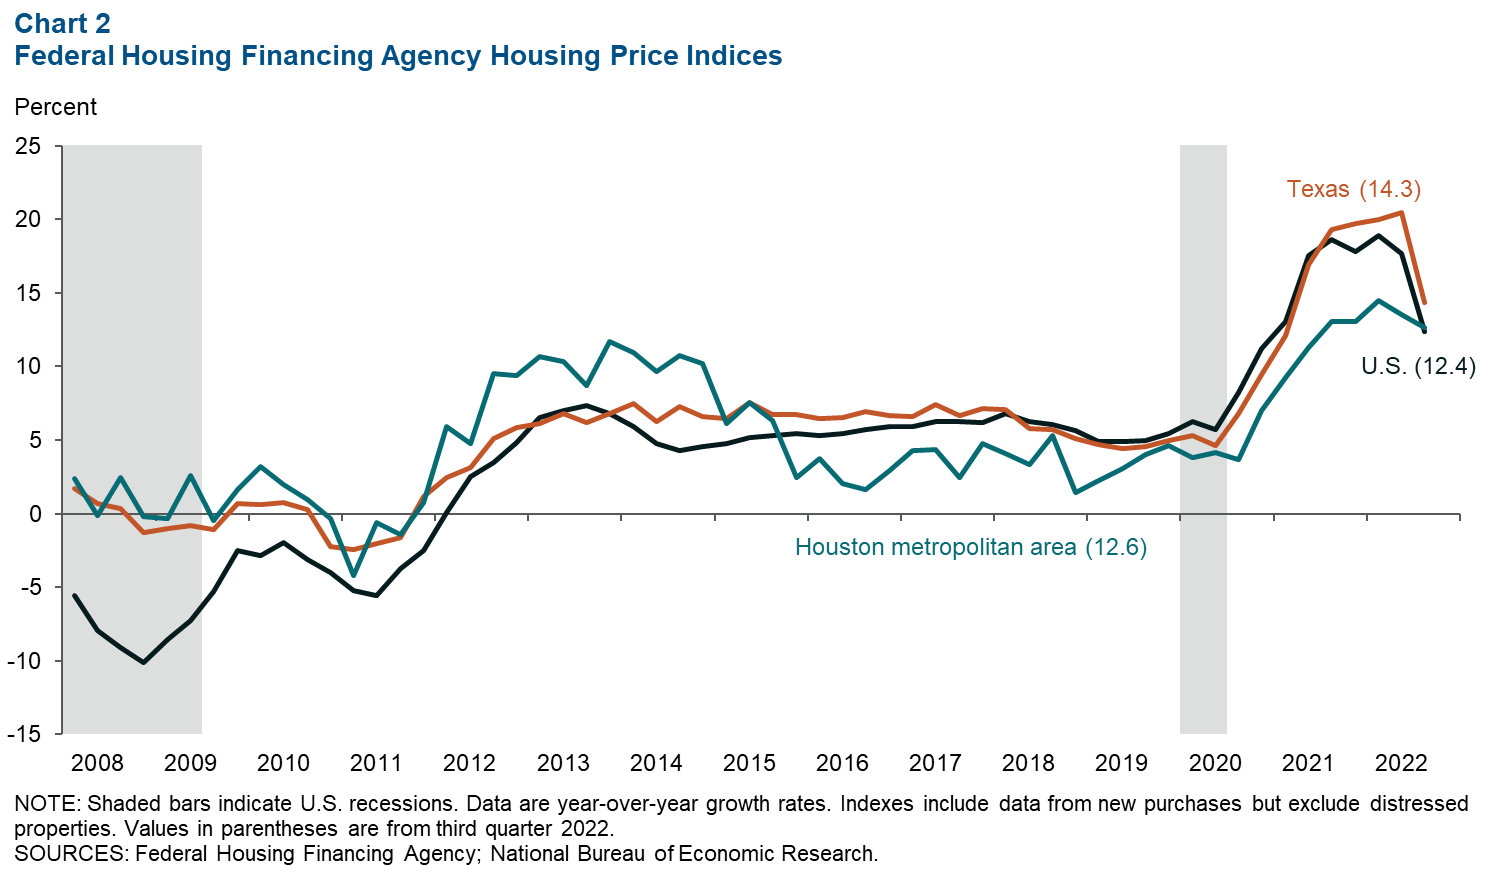
In metros across the state, price growth was much lower in the third quarter than in the second. This was very apparent in Austin, where home-price growth dipped to 8.8 percent year over year in the third quarter from 21.8 percent in the second quarter.
Home sales and inventories level off
Mortgage rates continue to climb, reaching 7.2 percent in October compared with 3.7 percent in January. This soaring cost of interest led home sales to plummet 16.9 percent, stabilizing near prepandemic levels in September. With slower sales and higher listings, inventories plateaued at 2.1 months (Chart 3).
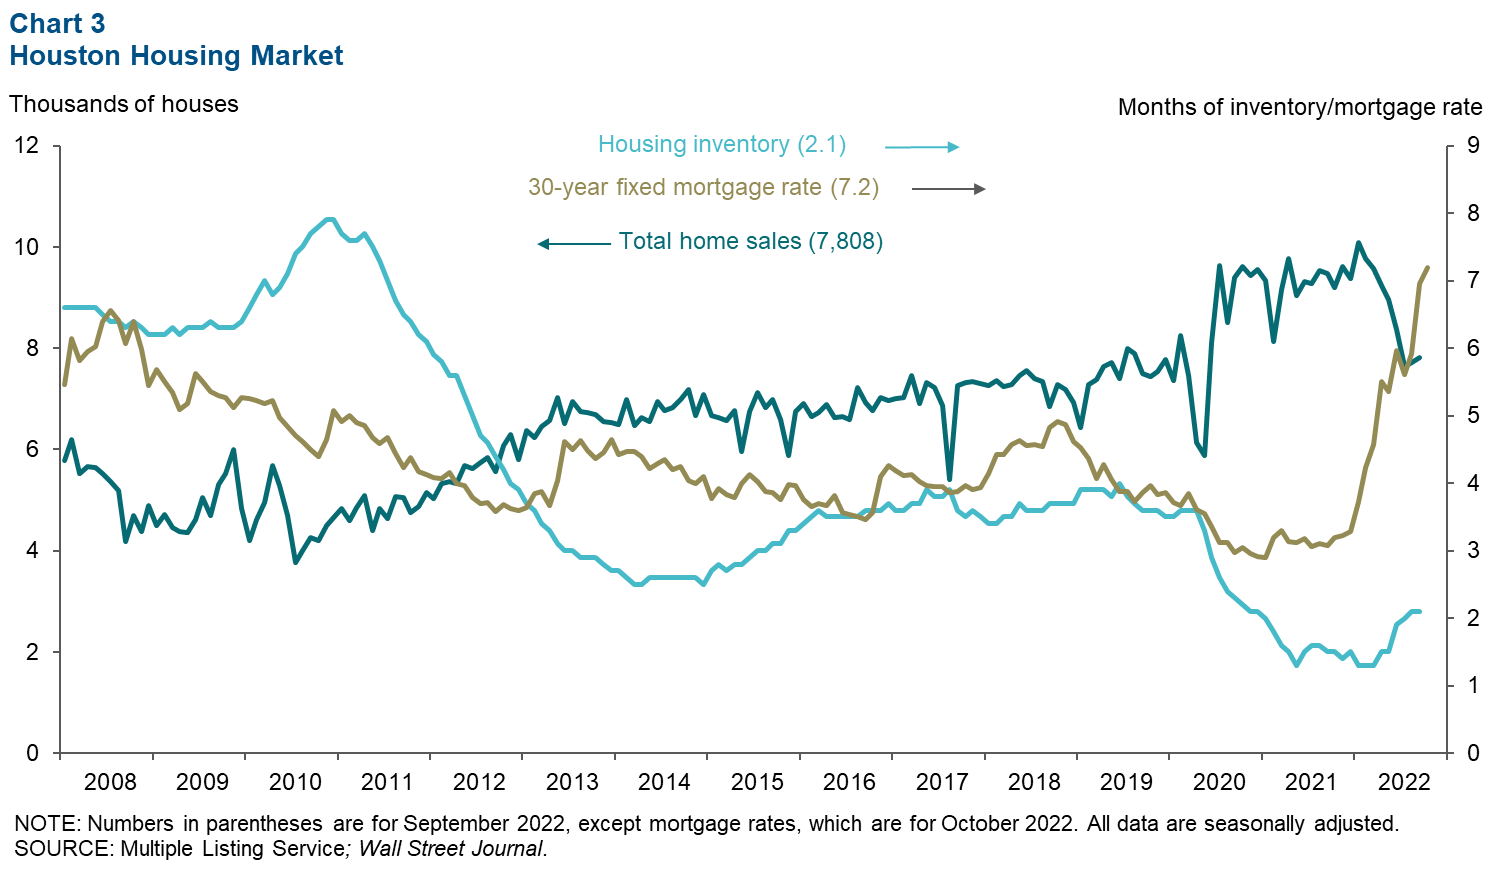
Home sales turned up a bit to 7,808 in September after their all-time peak of 10,075 in January and trough of 7,643 in July. In addition, new construction has slowed, leaving the inventory of houses available for sale in the metro mostly unchanged from July to September. Even so, the low level of inventory indicates continued tightness in the housing market.
Single-family permits still falling
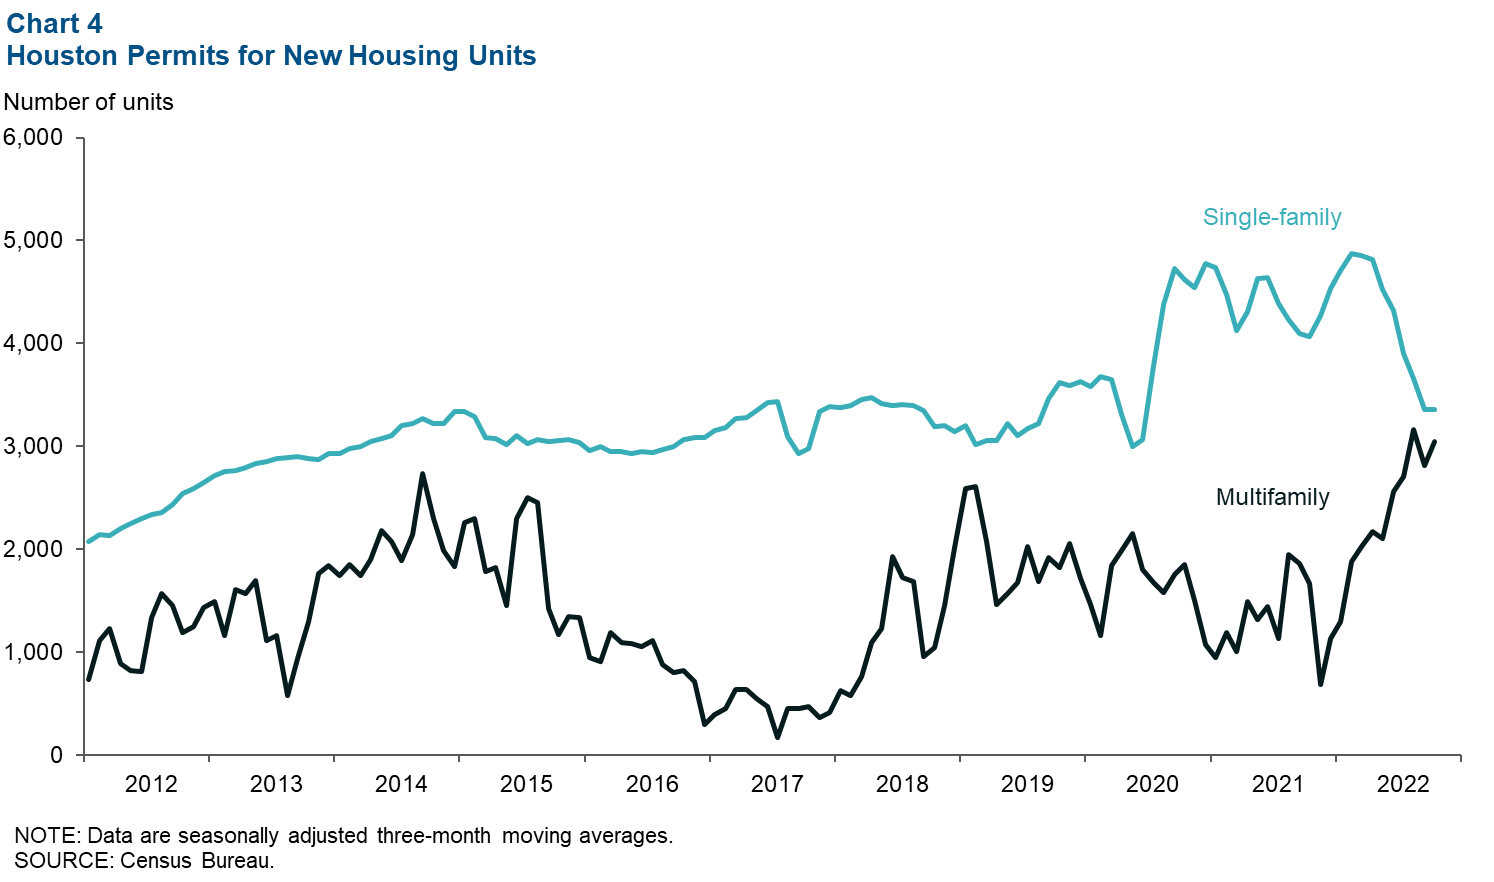
New permits to build single-family houses have been dropping, with the three-month-moving average falling from 4,703 in January to 3,359 in October (Chart 4). Single-family permits were still above 2019 levels, pointing toward a more optimistic outlook for residential construction than their steep decline might suggest. On the other hand, permits to build multifamily buildings were on the rise at 3,050 in October compared with 1,297 in January.
Apartment vacancy rises; office and industrial vacancies show small changes
The Houston apartment vacancy rate spiked to 6.3 percent in third quarter 2022, up 2.6 percentage points from the second quarter, while office and industrial vacancies did not show such dramatic changes (Chart 5). Rents per apartment unit are up 8.0 percent year over year, a slower pace than last quarter’s reading of 8.8 percent.
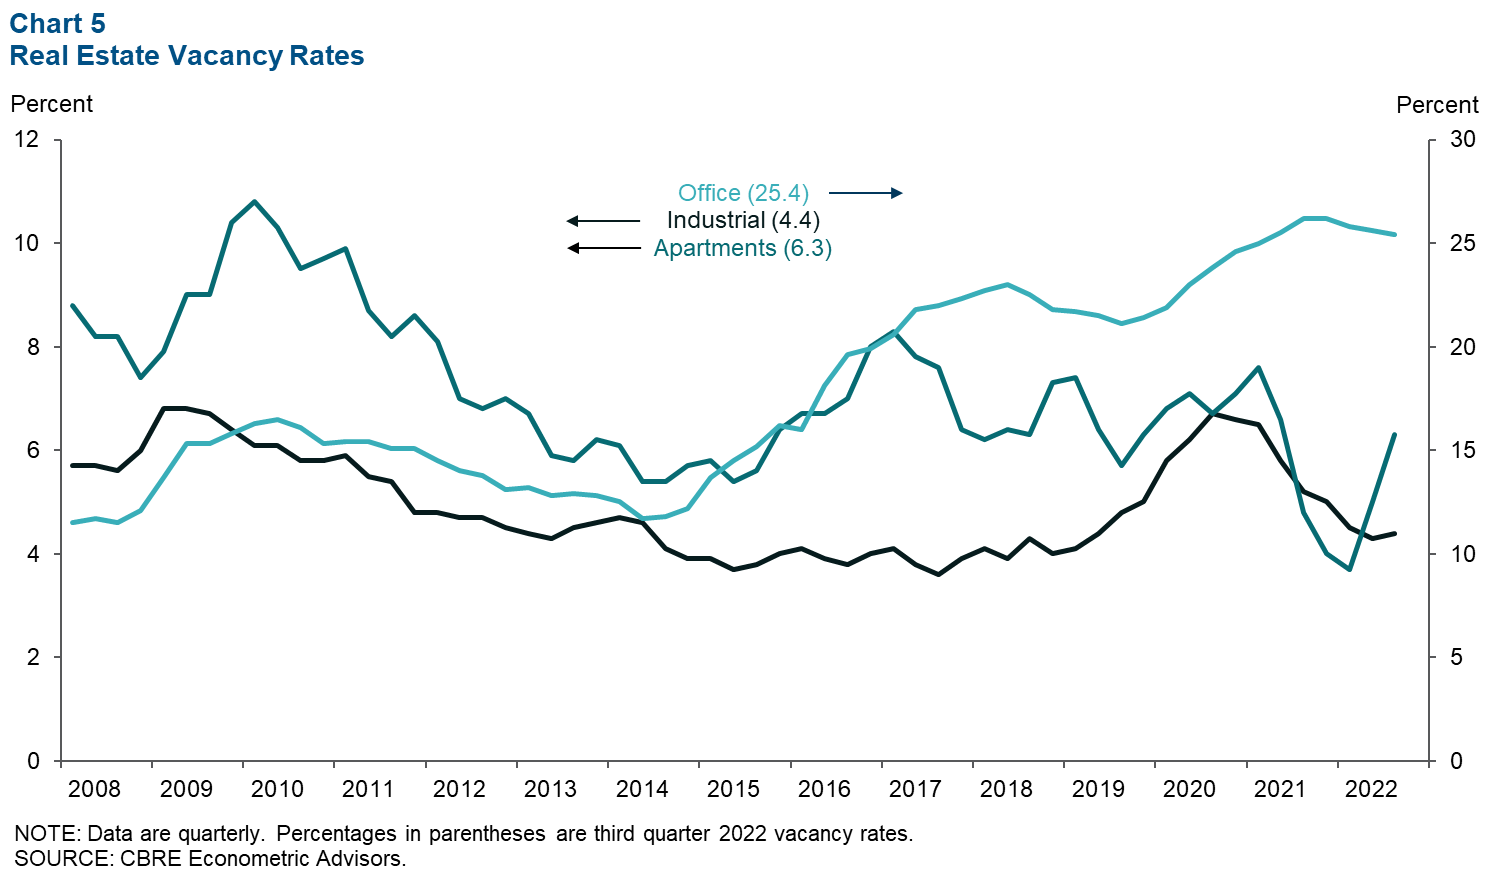
Industrial vacancies ticked up a bit after falling for seven straight quarters. The third-quarter rate of 4.4 percent was higher than the second quarter’s 4.3 percent but still well below the pandemic high of 6.7 percent in third quarter 2020. Warehousing drove this change, as it makes up the vast majority of Houston’s industrial space and saw an uptick in vacancies to 4.8 percent in the third quarter from 4.5 percent in the second.
Office vacancies are still elevated at 25.4 percent but down from their peak of 26.2 percent in fourth quarter 2021. Strong job growth in office-based sectors combined with economic worries and uncertainty around working from home means the outlook for office demand remains uncertain.
NOTE: Data may not match previously published numbers due to revisions.
About Houston Economic Indicators
Questions or suggestions can be addressed to Ana Pranger at ana.pranger@dal.frb.org. Houston Economic Indicators is posted on the second Monday after monthly Houston-area employment data are released.