Houston Economic Indicators

January 31, 2023
| Houston Economy Dashboard (December 2022) | |||
| Job growth (annualized) Sept.–Dec. '22 |
Unemployment rate |
Avg. hourly earnings | Avg. hourly earnings growth y/y |
| 3.6% | 3.9% | $31.99 | 6.5% |
Houston-area mining jobs and national rig counts are not as reactive to oil prices as they used to be. Houston’s oil and gas jobs still lag behind the state’s and the country’s even as fuel prices tick up—and despite strong employment growth in most sectors. The service sector drove employment growth in the fourth quarter of 2022. Manufacturing indicators show signs of either no growth or slight contraction globally, including for Houston’s main trading partners.
Energy
Oil prices drop; rig counts and mining jobs rise
The price of West Texas Intermediate (WTI) crude was down $38 from its June 2022 peak at an average of $76.44 in December 2022 (Chart 1). The U.S. rig count, slow to respond to the run-up of oil prices during the pandemic, rose steadily through mid-2022 before plateauing in the back half of the year. Even so, Houston mining-related jobs increased through year-end.
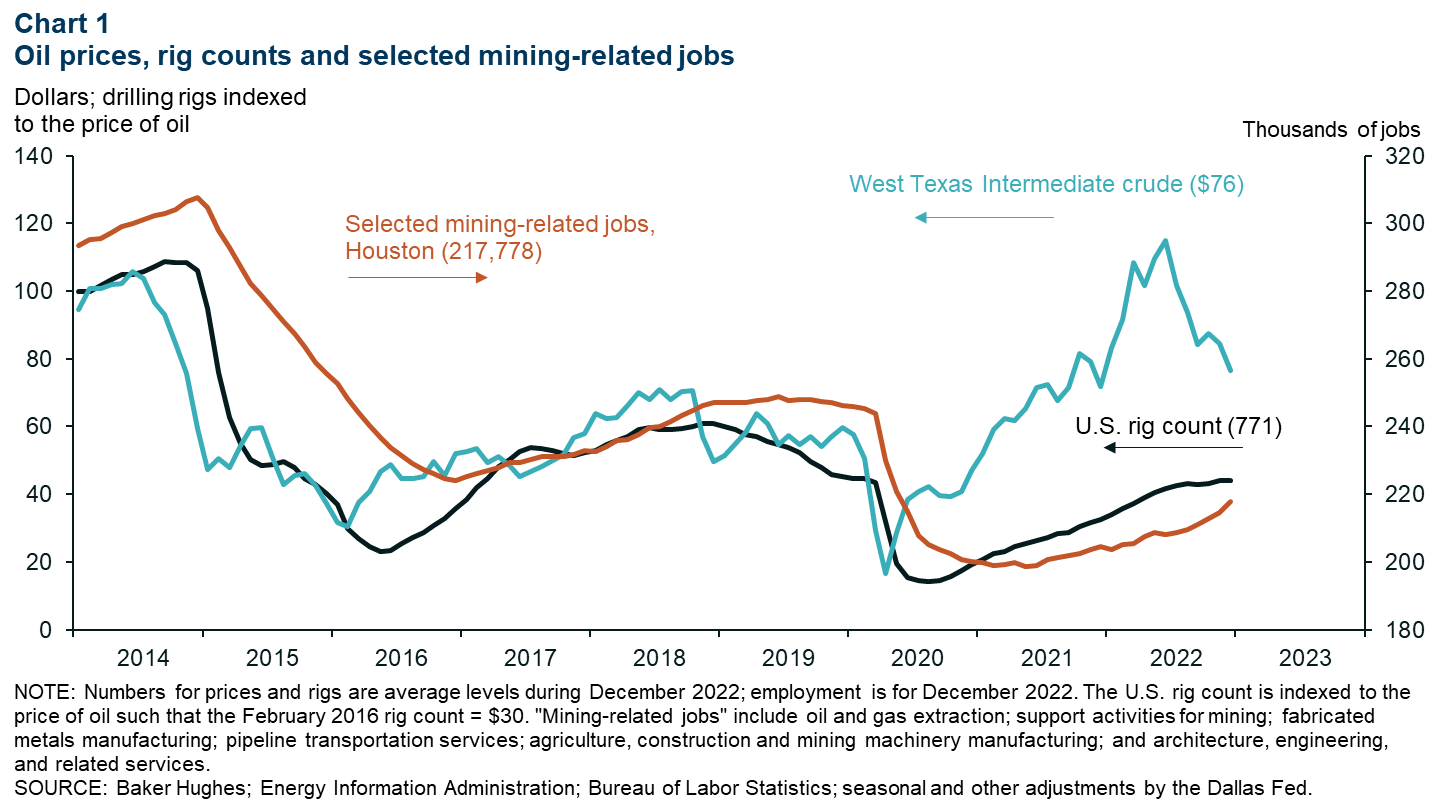
However, both rig counts and mining jobs have been anemic relative to the price of oil. The last time crude was nominally priced around $76 prior to the pandemic was November 2014, when there were 306,402 mining-related jobs in Houston and the U.S. rig count was 1,925, well above the current levels of 217,778 and 780, respectively. Sharp improvements in efficiency and productivity have reduced the industry’s demand for rigs and personnel. Furthermore, recent supply-chain bottlenecks, increases in oilfield costs, challenging capital and labor markets, and the relocation of cash flow from investment in production growth to investor and lender returns have constrained the industry's ability to respond to current prices.
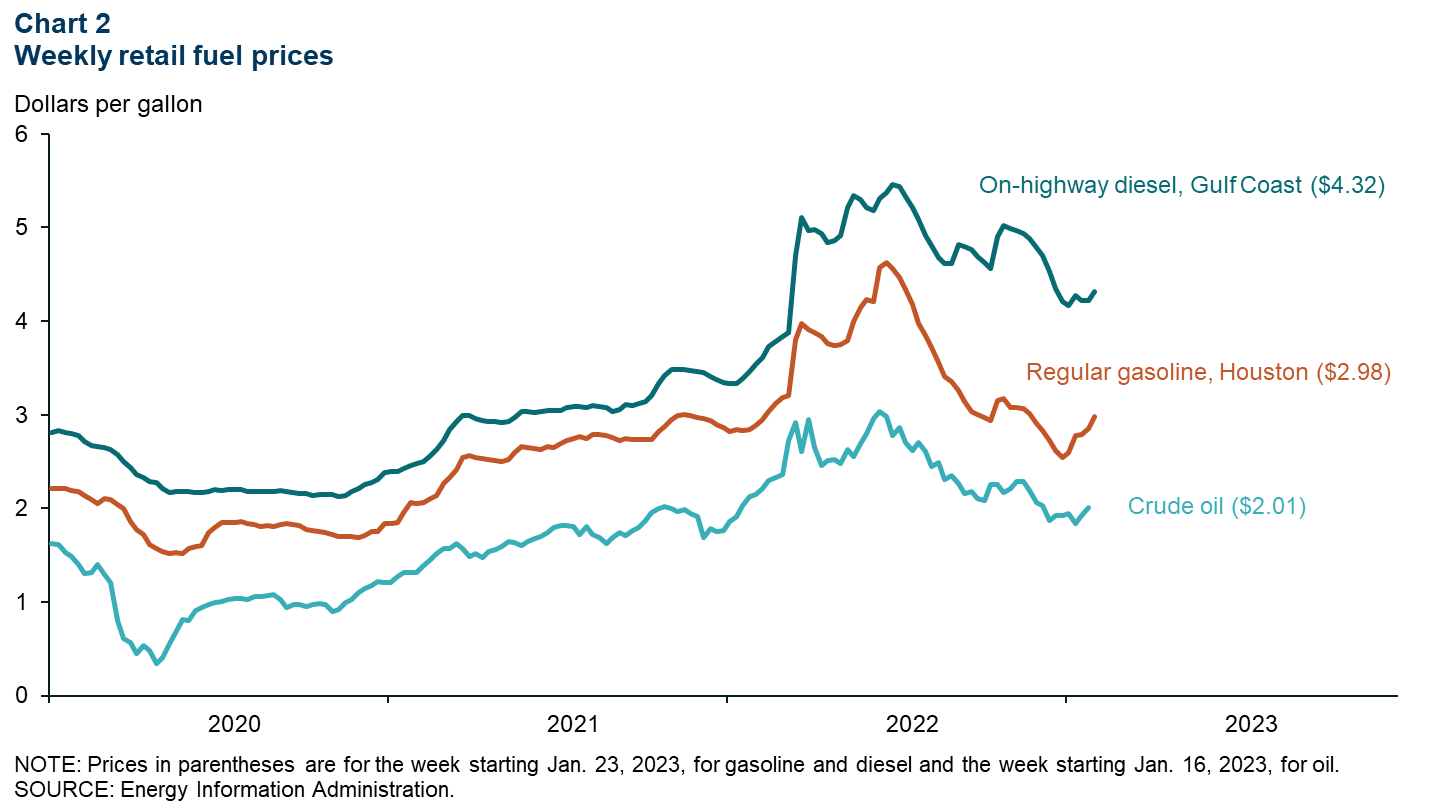
Fuel prices tick back up in 2023
The latest fuel price readings show a slight increase in the first weeks of 2023, though not to the levels experienced in the summer of 2022 (Chart 2). Diesel and oil saw minor increases, while Houston gasoline prices rose 39 cents (17 percent) between the weeks of Dec. 19 and Jan. 23.
As Texas oil and gas jobs recover, Houston lags behind
Houston has recovered a smaller share of lost oil and gas jobs than the country and state since the COVID-19 pandemic began (Chart 3). In November (the most recent data available), U.S. oil and gas jobs were at 91.7 percent of February 2020 levels, while, in December, Texas had recovered to 93.0 percent and Houston to 81.8 percent of prepandemic levels.
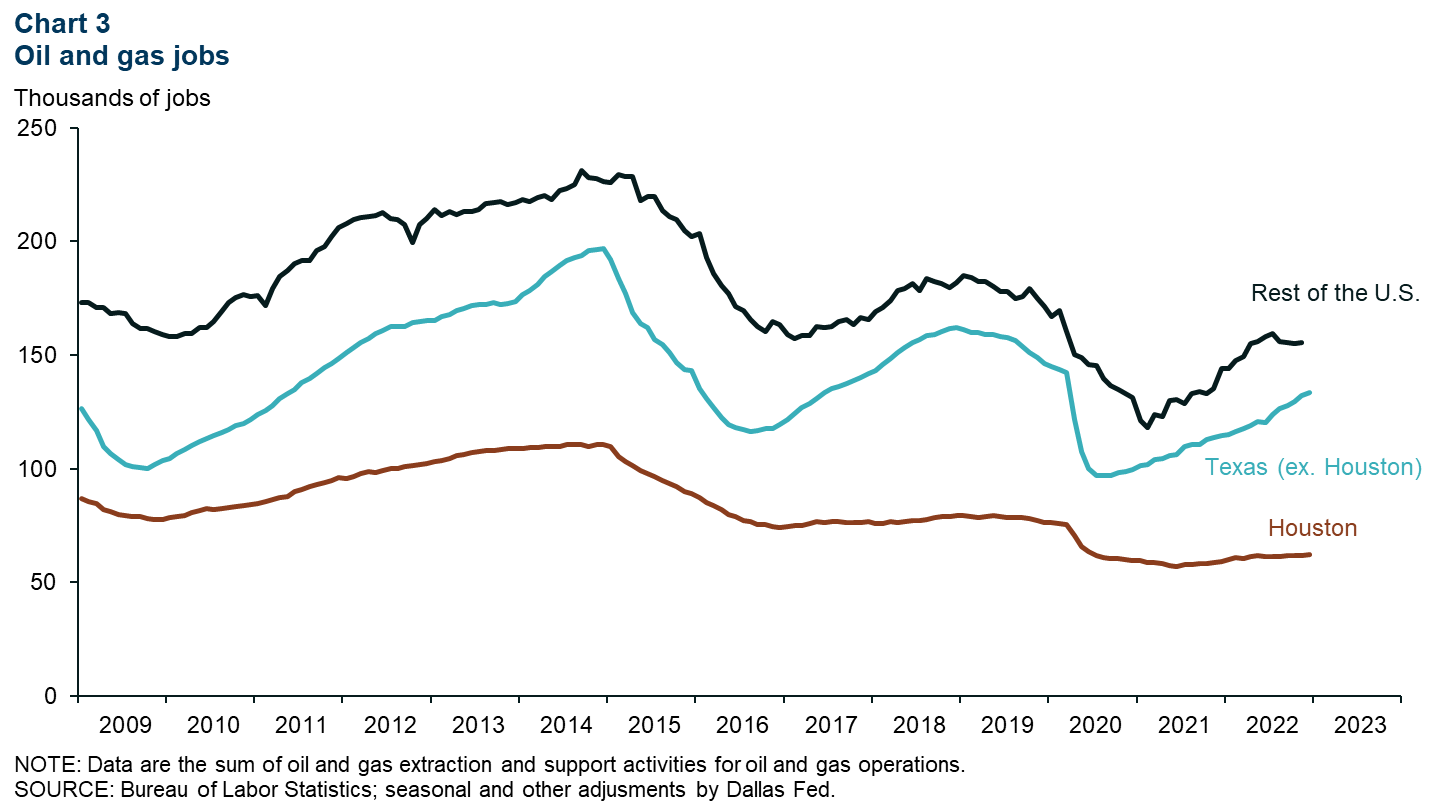
Behind this gap is the makeup of oil and gas jobs. Houston has a much higher share of extraction jobs (46.0 percent of total oil and gas jobs in December 2022) than the state as a whole (24.2 percent), while the remaining support activities share is lower. Statewide, support jobs have returned to 91.8 percent of prepandemic levels, while extraction jobs are back to only 83.6 percent of February 2020 levels. Extraction jobs are found mostly at exploration and production firms and tend to be more white-collar, while support activities jobs are found at oilfield services firms that employ more skilled trades workers who go to production sites.
Employment
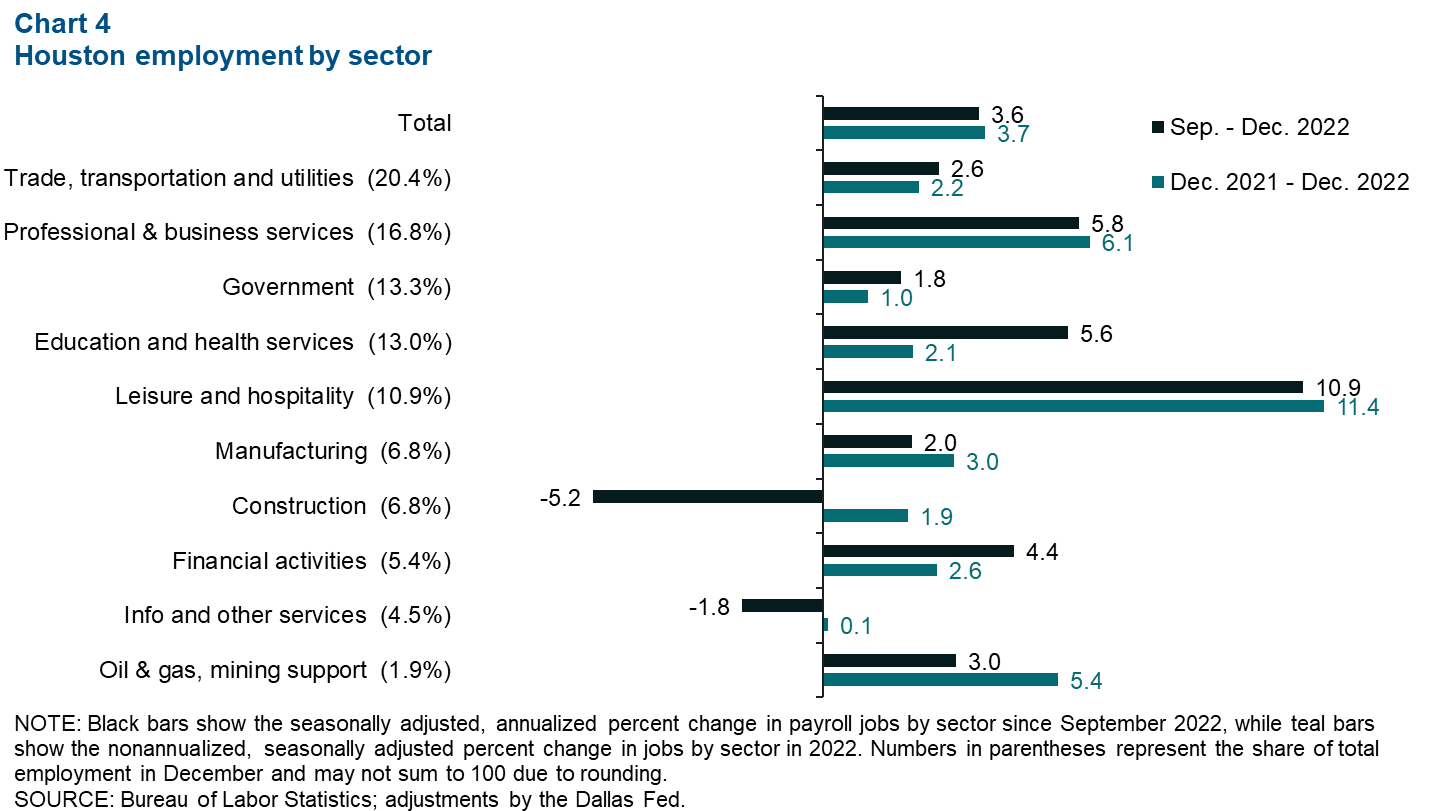
Houston added 28,603 jobs on net in the fourth quarter of 2022, bringing the year’s total to 117,394 (Chart 4). Leisure and hospitality, professional and business services, and education and health services led the charge in the quarter, adding 22,972 jobs combined. Construction saw the largest decline, shedding 3,004 jobs in the fourth quarter. Overall unemployment ticked down to 3.9 percent in December from 4.0 percent in November.
Manufacturing and trade
Indicators for global manufacturing suggest a slight slowdown in activity through the end of 2022 (Chart 5). This is relevant to Houston because manufacturing-related goods account for a large share of exports through the Houston–Galveston customs district. Global purchasing managers indexes (PMIs) are still in contraction, with developed markets struggling more than emerging ones. In nominal terms, 12.3 percent of U.S. exports passed through the Houston–Galveston customs district for the 12 months through November 2022. The main exports are energy and intermediate goods used in other countries’ manufacturing, like chemicals, machinery and oil products. If manufacturing declines globally, global demand for many of these intermediate goods is also likely to decline.
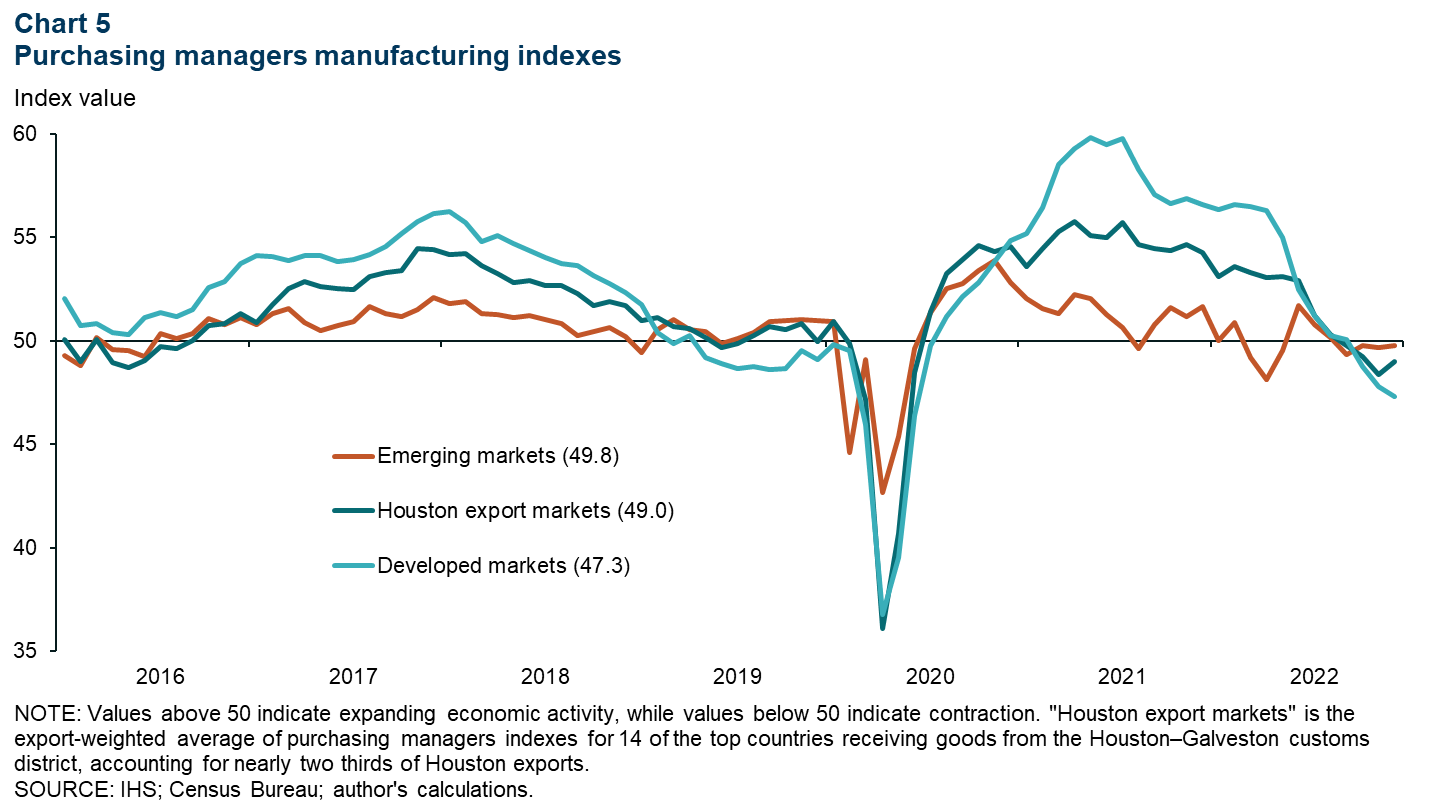
Houston’s biggest trading partners are firmly in the middle, doing better than developed markets but worse than emerging ones. Using exports through the Houston–Galveston customs district to weight the PMIs of Houston’s top export destinations results in an average PMI of 49.0, indicating a fairly even split between managers reporting expansion and those reporting contraction.
NOTE: Data may not match previously published numbers due to revisions.
About Houston Economic Indicators
Questions or suggestions can be addressed to Ana Pranger at ana.pranger@dal.frb.org. Houston Economic Indicators is posted on the second Monday after monthly Houston-area employment data are released.