Houston Economic Indicators

| Houston economy dashboard (May 2023) | |||||
| Job growth (annualized) Feb. –May '23 |
Unemployment rate |
Avg. hourly earnings | Avg. hourly earnings growth y/y |
||
| 2.4% | 4.7% | $33.33 | 7.8% | ||
Houston employment grew 2.4 percent in the three months ending in May—slower growth than both the state’s and the nation’s. Houston’s construction sector has not rebounded to prepandemic levels and lags Texas and the U.S. In fact, construction experienced steep employment declines though May in the metro after mortgage rates climbed, home sales dropped, and construction permits slumped. Home-price pressures moderated, and first-quarter vacancies in commercial buildings remained elevated.
Employment
Job growth slowing but still above trend
Houston gained 33,496 jobs in the first five months of 2023—2.5 percent annual growth (Chart 1). One of the slowest periods for job growth since the pandemic recovery began, it was still significantly faster than the prepandemic trend rate of 1.7 percent.
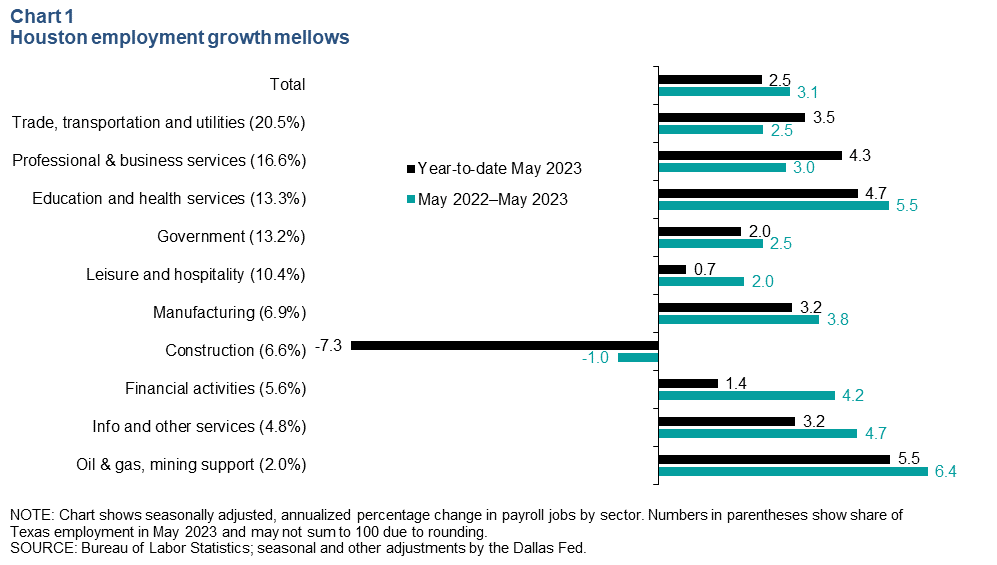
Service-providing industries led year-to-date growth, driven by trade, transportation and utilities (9,683 jobs), professional and business services (9,739), and education and health services (8,480). The smaller oil and gas sector logged the fastest growth rate at 5.5 percent year to date, annualized (1,493 jobs).
Notably, the interest-rate-sensitive construction sector posted steep declines, losing 7,027 jobs from December 2022 to May 2023.
Houston construction jobs have not recovered from pandemic and lag state and nation
In May, Houston employment in the construction sector was still 7.1 percent below February 2020 levels (Chart 2). State construction employment recovered by July 2022 and was 3.0 percent above prepandemic levels in May 2023, while U.S construction employment recovered in February 2022 and was 4.2 percent above those levels.
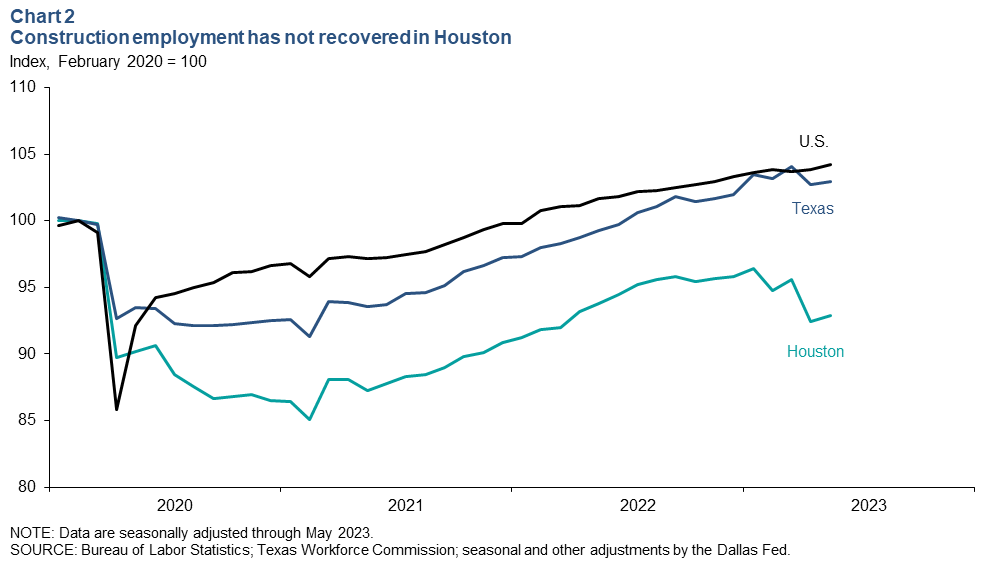
This sluggish aggregate construction rebound is likely due in part to Houston’s slower recovery early in the pandemic; hard-hit energy sectors that employ a lot of “heavy and civil” construction workers didn’t see employment stabilize until mid-2021. Home-construction inflation, rising interest rates and worker shortages compounded challenges in the sector in the second half of 2022.
Houston has seen a relative dearth of new nonresidential project spending since the 2015–16 shale bust. Big commercial and industrial projects have boosted—or are expected to boost—demand for construction labor in other parts of the state. These include the Tesla lithium refinery plant in Robstown, the Goldman Sachs tower in Dallas and Samsung’s semiconductor factory near Austin.
Real estate
Single-family permits rise as multifamily permits fall
Homebuyer demand for new housing is proving resilient as builders reportedly buy down interest rates using savings gained from easing material input costs (like lumber). Permits for single-family housing construction rebounded to 3,781 in April, their highest level in nine months (Chart 3). Single-family permits are now 22.4 percent below their February 2022 peak but still 15.1 percent above the 2019 average.
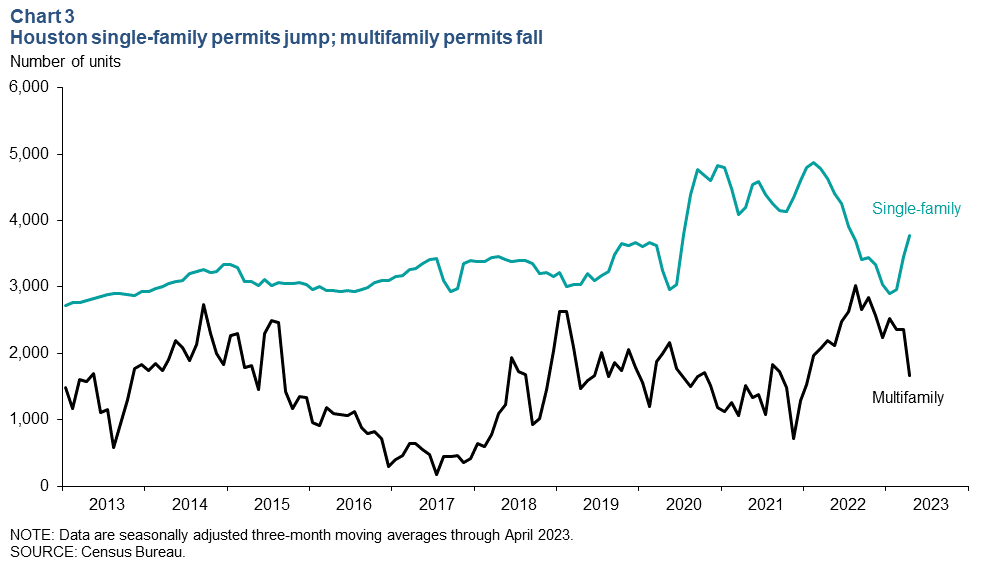
Permits for multifamily housing projects—which tend to have much longer production timelines than single-family—peaked in August 2022 and dropped to 1,661 in April, their lowest level since January 2022. The completion of new projects is putting downward pressure on rents in the sector.
Home sales down, home inventories flat in April
Seasonally adjusted existing-home sales in the Houston metro slipped in April to 7,216 as mortgage rates kicked up to 7.2 percent (Chart 4). Home sales were down 28.8 percent from their peak in January 2022. However, that’s only 4.3 percent below the 2019 monthly average, despite a 3.2-percentage-point hike in the 30-year fixed mortgage rate.
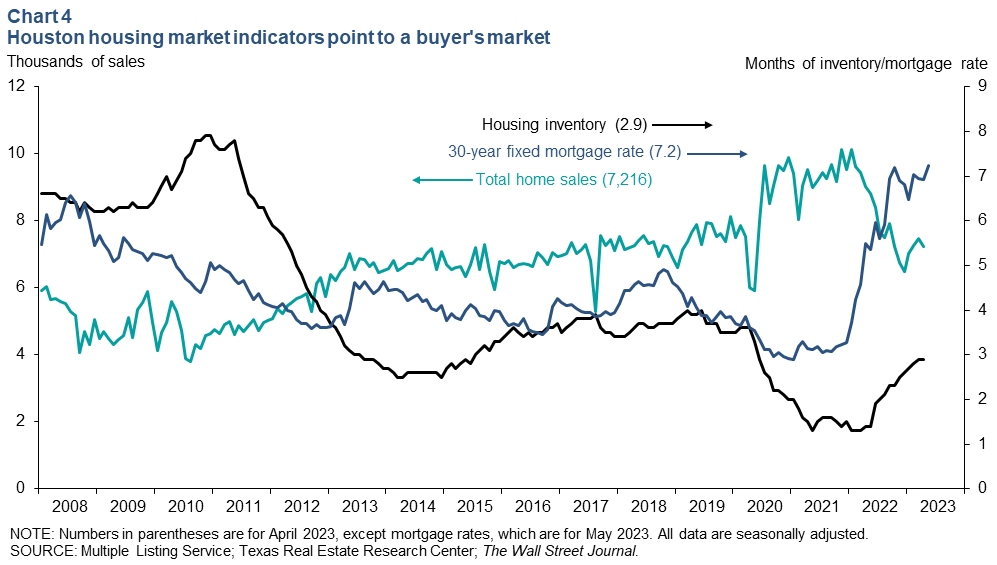
The months of housing inventory—which factors in both the number of homes for sale and the pace of sales—was unchanged in April from March at 2.9 months. Industry experts regard around 4.5 to 5 months of inventory as a balanced market today, with higher values denoting a sellers’ market and vice versa. Though inventories have expanded from last year’s historic lows, they are still short of 2019 levels, which was well within the buyers’ market range.
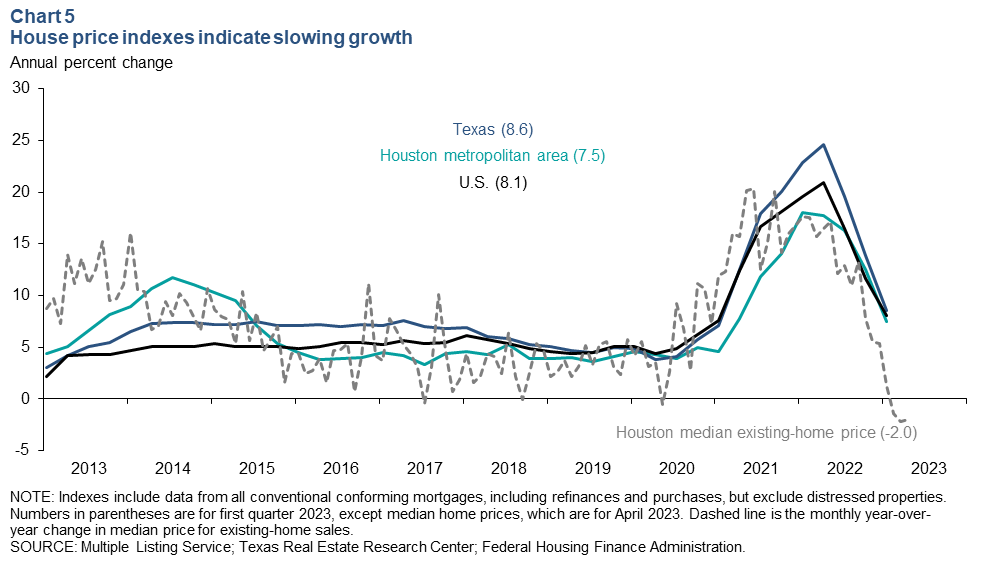
Home-price pressures softening
The value of existing homes sold or refinanced in Houston slowed in first quarter 2023, but the growth rate remained elevated compared with prepandemic rates. However, the median price of existing homes sold posted its third straight month of year-over-year declines, falling 2.0 percent over the 12 months ending in April to a nominal $329,117 (Chart 5). By comparison, the median prices of homes sold in Dallas–Fort Worth fell 6.0 percent over that same time frame and dropped a whopping 15.3 percent in Austin.
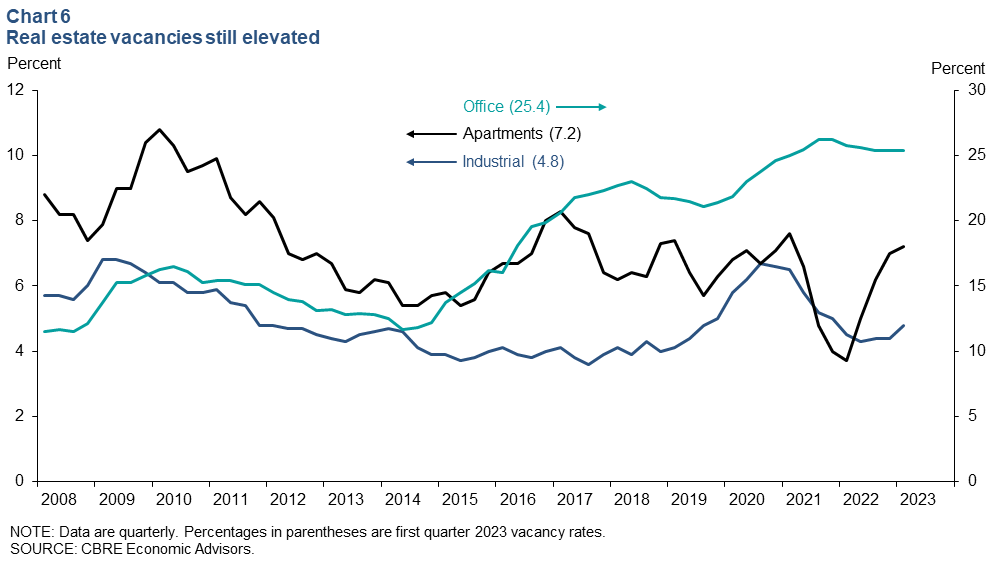
Commercial vacancies remain elevated
More than 25 percent of office space was vacant in first quarter 2023 (Chart 6). Downtown, office vacancies were 30.6 percent, while suburban office space was only 24.1 percent vacant. The high office vacancy rate is being sustained by hangovers of supply from the 2015–16 oil bust and persistent remote and hybrid work arrangements.
Industrial vacancies ticked up to a still-low 4.8 percent, and apartment vacancies rose to 7.2 percent—putting pressure on rental rates. There are still 33,656 apartment units under construction and likely to be delivered through 2024, which may continue to push up vacancy rates and push down rental rates.
NOTE: Data may not match previously published numbers due to revisions.
About Houston Economic Indicators
Questions or suggestions can be addressed to Ana Pranger at ana.pranger@dal.frb.org. Houston Economic Indicators is posted on the second Monday after monthly Houston-area employment data are released.