Houston Economic Indicators

| Houston economy dashboard (March 2025) | |||||
| Job growth (annualized) Dec. '24–March '25 |
Unemployment rate |
Avg. hourly earnings | Avg. hourly earnings growth y/y |
||
| 2.2% | 4.2% | $36.15 | 4.3% | ||
Houston’s labor market continued to expand moderately with employment increasing 2.2 percent in the first quarter. Unemployment remained stable in March. Despite strong employment data, leading indicators of local economic activity are signaling a potential slowing of the regional economy over the remainder of 2025. Fourth-quarter home price indexes showed slow growth in home prices over the past year. Port activity similarly declined, with imports falling and exports flat year-over-year.
Labor market
Houston’s job growth in the first quarter of 2025 came in at a moderate 2.2 percent annualized (18,542 jobs).
Jobs grew month over month in March at an annualized 1.9 percent, and jobs contracted in February, with the data revised up from -0.9 percent to -0.5 percent.
Taking a slightly longer view, job growth from December 2024 to March 2025 was broadly strong across sectors. Leisure and hospitality grew the fastest at 4.4 percent (4,002 jobs) over the three months ending in March. Education and health services was the second strongest sector, growing an annualized 3.9 percent (4,407).
However, there was weakness in construction, which declined an annualized 3.0 percent (-1,779 jobs), and in professional and business services, down 2.7 percent (-3,903) (Chart 1). Professional and business services is a huge sector in Houston’s economy, but weakness in that sector was mostly driven by declines in administrative , waste management and remediation services, particularly the employment services subsector.
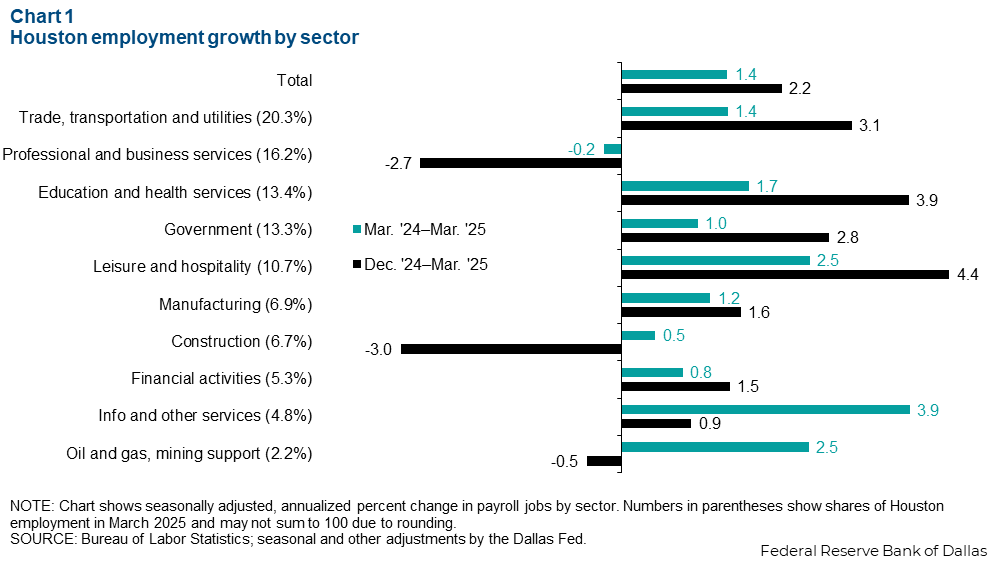
Year over year, jobs grew 1.4 percent (48,924 jobs) in March 2025 compared with one year ago. All sectors except professional and business services experienced growth over the past year. Information and other services grew the fastest at 3.9 percent (6,253). Trade, transportation and utilities added the greatest number of jobs, hiring 9,967 more Houstonians from March 2024 to March 2025. Professional and business services declined slightly, with jobs contracting -0.2 percent (-1,370).
Leading indicators
Purchasing Managers Index remains flat while the leading index contracts
The Houston Purchasing Managers Index (HPMI) was essentially unchanged, dropping fractionally from 50.0 in February 2025 to 49.7 in March (Chart 2). Index values above 50 generally indicate growth in the industries surveyed while those below 50 indicate contraction. The index dipped just below 50 in September and October 2024 but resumed growing in the fourth quarter of 2024.

The Houston Leading Index (HLI) further decelerated from February’s 0.4 percent growth (revised from 0.3 percent ) to -1.3 percent in March 2025.
Flat readings from the HPMI suggest local job growth was probably slower than initially estimated in March and may slow further over the next three months. This is likely due, in part, to firms adopting wait-and-see postures in response to heightened levels of uncertainty, especially with respect to trade policy. This is corroborated by comments from the Texas Business Outlook Surveys . With a negative reading on the HLI, the local economy is likely to slow over the remainder of 2025.
Houston Leading Index turns negative
The deceleration of growth in HLI from 1.2 percent over the three months ending December to -1.3 percent in March was the result of broad-based deceleration across its components (Chart 3). Weakness in single-family housing permits, lower oil prices and the recent decline in equity values are contributing significantly to the drop-off in the headline reading. The Houston Leading Index suggests job growth over the next three to nine months is going to decline, though how much remains highly uncertain.

Home prices
Year-over-year growth in the Houston Federal Housing Finance Administration (FHFA) home-price index declined from 1.4 percent in third quarter to 1.0 percent in the fourth quarter (Chart 4). Houston’s home-price growth was below the state’s 1.7 percent growth in the fourth quarter and the nation’s 5.2 percent growth. Home prices typically appreciate more slowly in Texas than the nation due to the relative ease to bring new supply to market.

The median home sale price in Houston fell 1.8 percent year over year in February 2025 after adjusting for inflation and seasonality. On a nominal basis, the median sale price in the metro area was $332,323 in February.
The FHFA price index is a repeat sales index that tracks the purchase prices of the same homes over time and gives a more accurate but less timely view of how much the average price of a home is changing. In contrast, the median home selling price tracks whichever homes happen to have sold in a given month. It is more timely but can be skewed based on the changing composition of the homes selling at that time.
Port activity
From January to February, exports from the Houston-Galveston port district increased from 29.2 million metric tons (mmt) to 30.1 mmt (Chart 5). Over the same period, imports declined from 6.1 mmt to 5.7 mmt. Imports have been sliding since November, when they reached 7.3 mmt.
Exports are flat year over year, declining 0.4 percent from February 2024 to February 2025. Imports fell 23.7 percent over the same period.

NOTE: Data may not match previously published numbers due to revisions.
About Houston Economic Indicators
Questions or suggestions can be addressed to Robert Leigh at robert.leigh@dal.frb.org. Houston Economic Indicators is posted on the second Monday after monthly Houston-area employment data are released.