Houston Economic Indicators

| Houston economy dashboard (May 2025) | |||||
| Job growth (annualized) Feb.–May '25 |
Unemployment rate |
Avg. hourly earnings | Avg. hourly earnings growth y/y |
||
| 0.3% | 4.5% | $35.68 | 2.3% | ||
Houston’s labor market stalled during the three months ending in May with employment increasing an annualized 0.3 percent. Unemployment ticked up to 4.5 percent in May. Vacancy rates in both office and industrial space ticked up the last quarter but both declined year over year. Commercial real estate rents increased over the past year with stronger growth in industrial space.
Labor market
Following two months of modest growth, Houston payrolls contracted in May, netting just 0.3 percent job growth in the metro area over the three months ending in May (Chart 1). Growth across sectors over that time was mixed.

Oil and gas and mining support grew the fastest at 10.6 percent (1,916 jobs). Education and health services was the second strongest sector, growing an annualized 3.3 percent (3,817).
However, weakness in professional and business services persisted, declining an annualized 2.5 percent (-3,512) from February to May 2025 especially in the employment services and services to buildings and dwellings subsectors. Construction payrolls fell an annualized 1.2 percent (-706) driven by specialty trade contractors.
Year over year, jobs grew 0.9 percent (31,619 jobs) in May 2025 compared with one year ago. Most industries experienced growth over the past year except financial activities and professional and business services. Education and health services grew the fastest at 1.9 percent (8,872). Professional and business services, which accounts for 16.3 percent of employment in Houston, remained essentially unchanged, declining 0.1 percent (-783).
Houston’s unemployment rate ticked up to 4.5 percent in May, driven by both an increase in the number of unemployed people and a slight tick down in the labor force. For context the unemployment rates in Texas and the U.S. held steady at 4.1 and 4.2 percent, respectively.
Purchasing Managers Index
The Houston Purchasing Managers Index (HPMI) declined from 48.5 in April 2025 to 48.2 in May as a larger share of respondents reported contracting economic conditions (Chart 2). Index values above 50 generally indicate growth in business activity while those below 50 indicate contraction. The index is now at its lowest level since July 2020, but still above the breakeven value of 45, the level below which Houston’s aggregate economy is likely contracting according to measures such as the Houston business-cycle index.
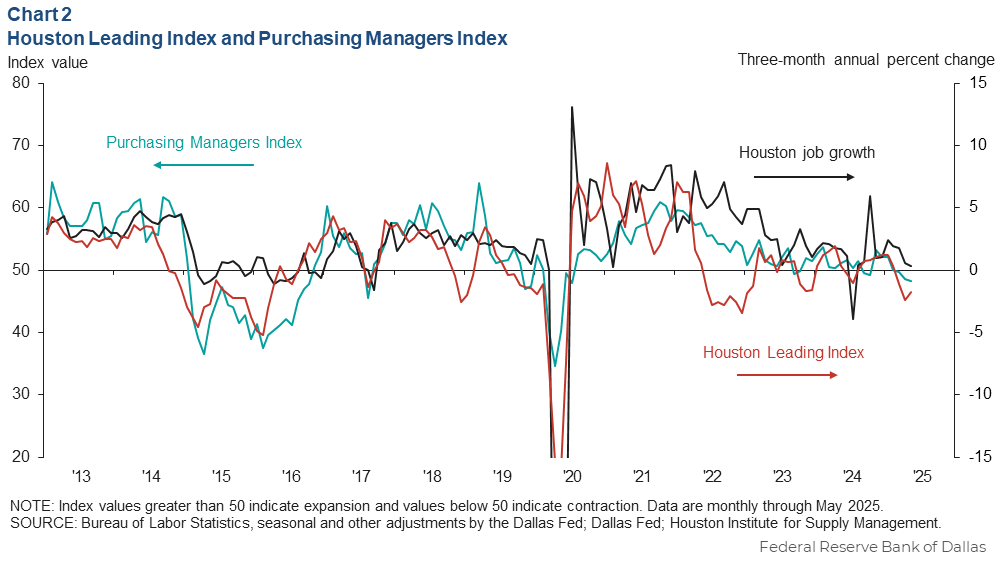
The subcomponents of HPMI showed contraction in employment and production and a resumption of input price growth. Sales and lead times were flat. Inventories of intermediate and final goods declined.
The Houston Leading Index (HLI) declined an annualized 1.8 percent over the three months ending in May. This is a slight pickup from April’s 2.4 percent decline, but the year-to-date deceleration has been broad based across the 10 components of the index.
Continued weakness in both the HLI and HPMI suggest job growth and economic activity over the next three to nine months will be slower compared with the past three months.
Commercial real estate
Office vacancies tick up
The vacancy rate for office space in Houston was 23.9 percent in the first quarter of 2025 (Chart 3). This is slightly higher than 23.4 percent in fourth quarter 2024, but a slight improvement from the year-ago rate of 24.3 percent. Post-pandemic office vacancy rates peaked at 26.2 percent in third quarter 2021.
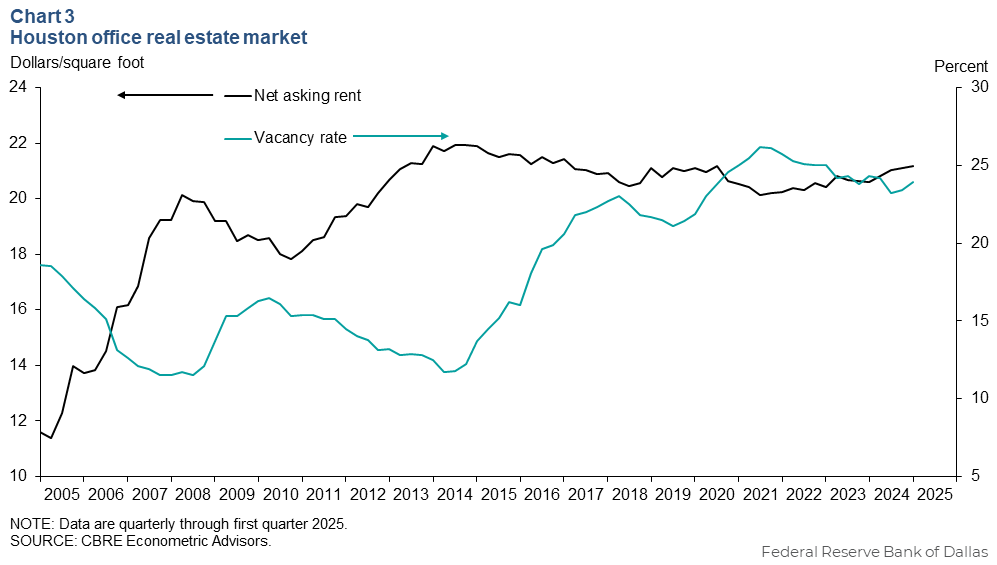
Net asking rents for office space in the metro area were $21.16 per square foot in first quarter 2025. Year over year, Houston office rents are up 2.7 percent.
Industrial rents continue to increase
The vacancy rate for industrial real estate in Houston was 5.7 percent in the first quarter 2025 (Chart 4). This is slightly higher than 5.5 percent last quarter but lower than 6.1 percent a year ago. Vacancy rates appear to have stabilized following a sustained rise through 2023 and the first half of 2024.
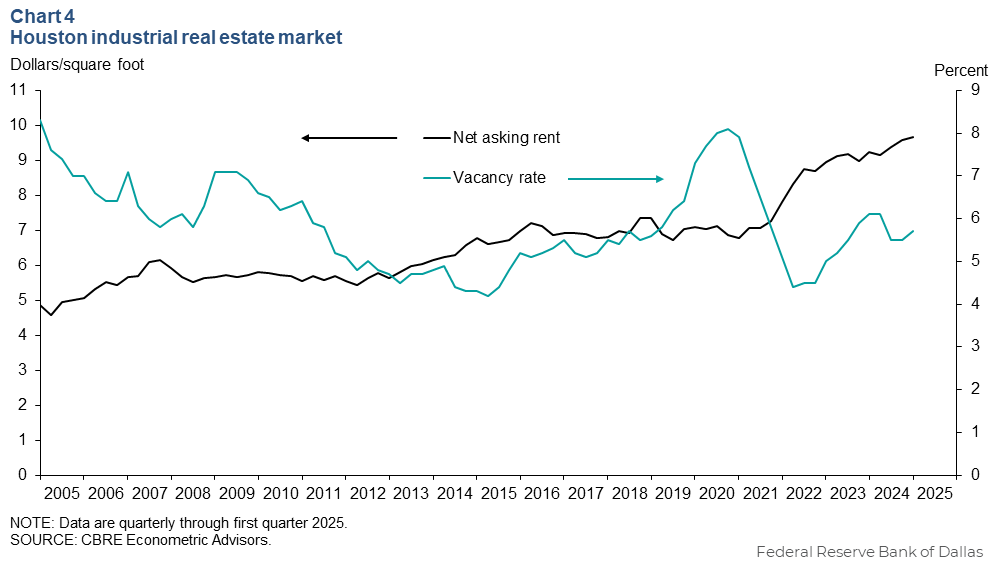
Rents have continued to increase. The net asking rent for industrial space was $9.66 per square foot in the first quarter of 2025. Year over year, rents have increased 4.7 percent in the metro area.
NOTE: Data may not match previously published numbers due to revisions.
About Houston Economic Indicators
Questions or suggestions can be addressed to Robert Leigh at robert.leigh@dal.frb.org. Houston Economic Indicators is posted on the second Monday after monthly Houston-area employment data are released.