Permian Basin Economic Indicators

Overall, economic indicators show a robust Permian Basin economy with expanding employment and a tight labor market. Though oil production continues to rise, drilling activity has leveled off somewhat amid concerns over pipeline capacity. Single-family housing permits and home prices continue to grow.
Labor Market
Permian Basin employment increased from just under 182,900 to about 184,000 between July and August (Chart 1). Year-over-year growth has decelerated to 8.5 percent in recent months but remains well above the Texas average.
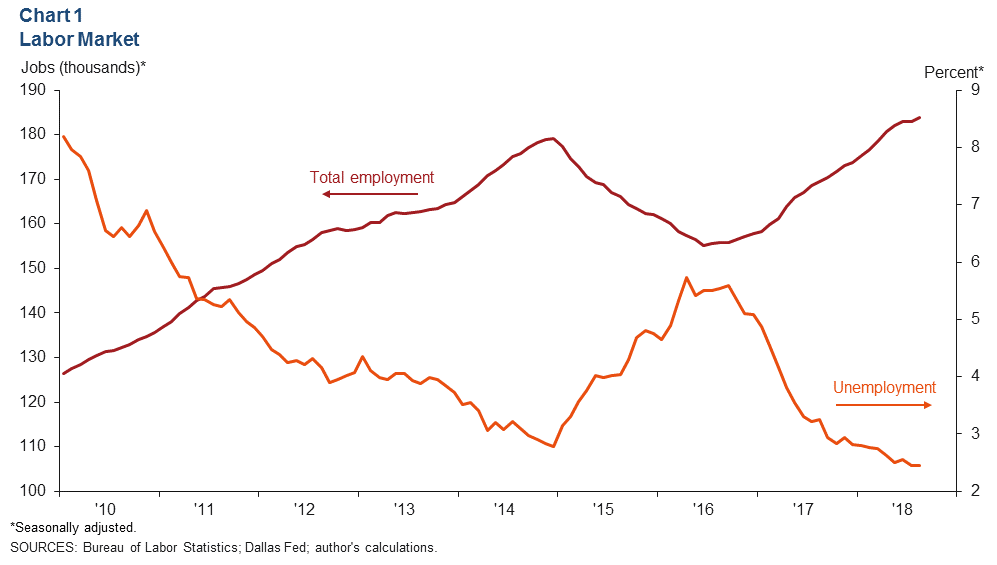
The unemployment rate stayed flat at 2.4 percent between July and August. In its most recent release, the Dallas Fed’s Beige Book reported that energy firms in the Permian are experiencing upward wage pressure.
Energy
Rig Count Levels Off; Production Grows at Slower Rate
The Permian Basin rig count inched up between July and August, growing by seven rigs to 486 (Chart 2). September’s latest rig count fell to 483. The most recent Beige Book reported that drilling activity has flattened as pipeline constraints put downward pressure on prices received for oil in the Permian.

Permian oil production advanced for the seventh month in a row in August, growing to 3.39 million barrels per day. However, August’s month-over-month increase of 1.4 percent was the slowest so far this year. Beige Book contacts reported receiving lower prices for oil in the Permian but noted that the discount has not been enough to shut in production.
Price of West Texas Intermediate Ticks Up in September
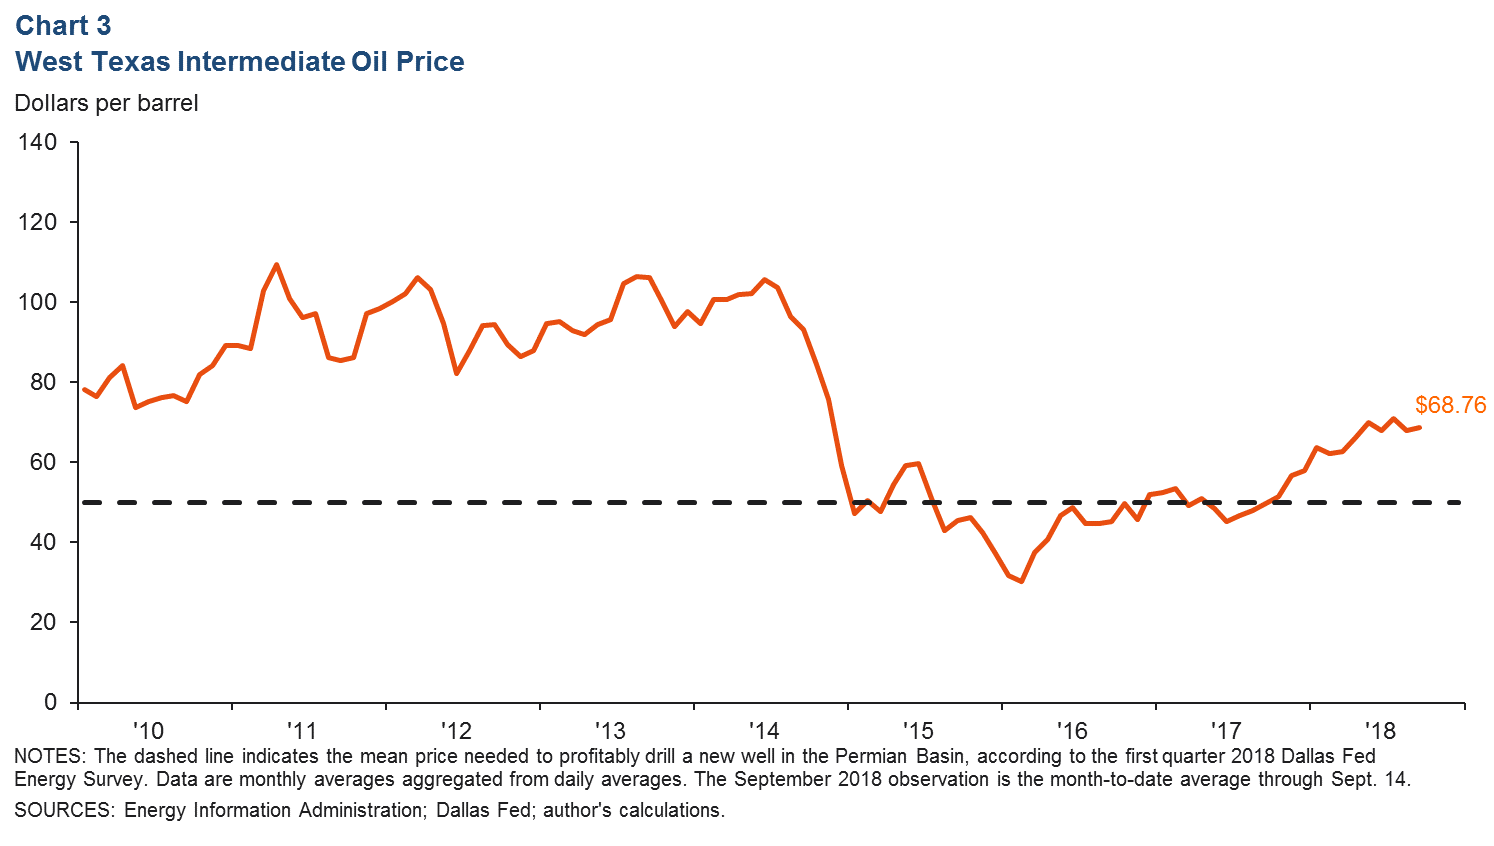
The average daily spot price per barrel of West Texas Intermediate crude has averaged around $68.76 during September (Chart 3). This is up from $68.05 during August. Though prices have hovered around $70 per barrel, prices received by some producers were reported to be $10 to $17 lower, according to the Beige Book report.
Permian’s Drilled but Uncompleted Wells Still on the Rise
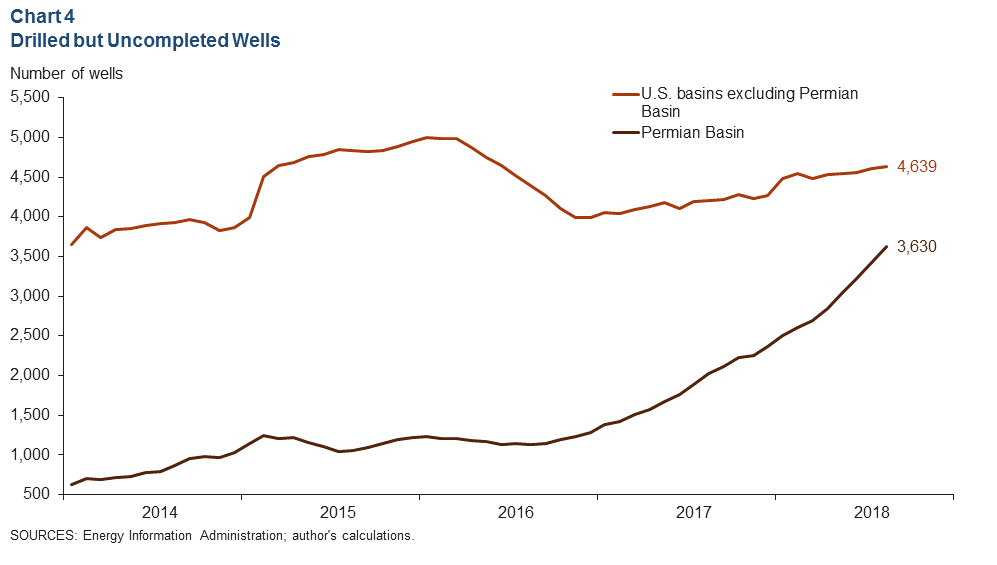
The Permian Basin’s drilled but uncompleted (DUC) wells increased 6 percent to 3,630 between July and August (Chart 4). Outside the Permian, uncompleted wells inched up to 4,639 in August from 4,612 in July. The Permian DUC count has risen 53 percent year to date, while DUCs in basins outside the Permian have risen about 9 percent.
Housing
Permits Continue Upward Trajectory
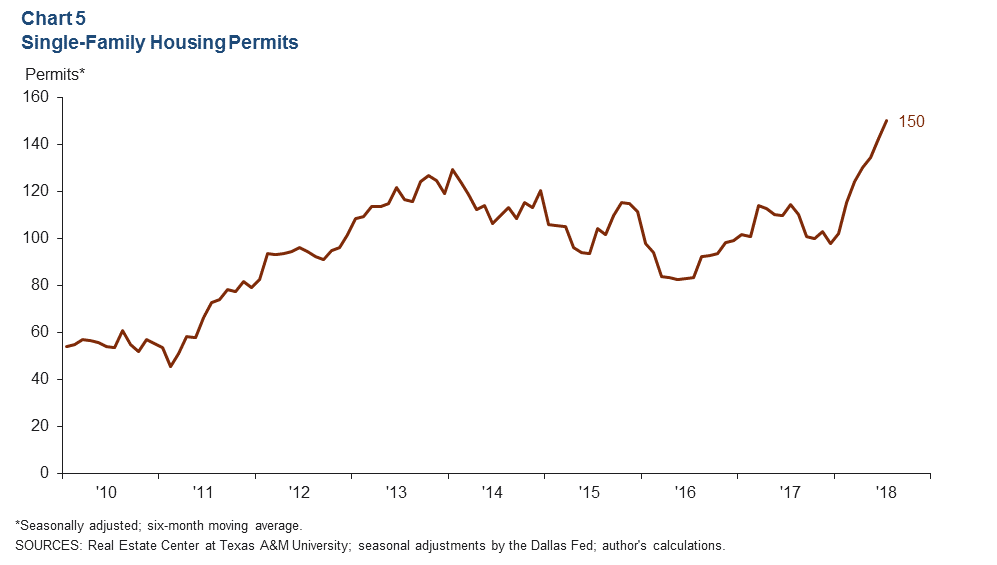
The six-month moving average for single-family permits in Midland and Odessa increased to 150 in July 2018—31 percent higher than in July 2017 (Chart 5). Permits issued between January and July 2018 are ahead of 2017 totals, with monthly growth averaging 6.4 percent. Midland makes up the bulk of the permits issued this year.
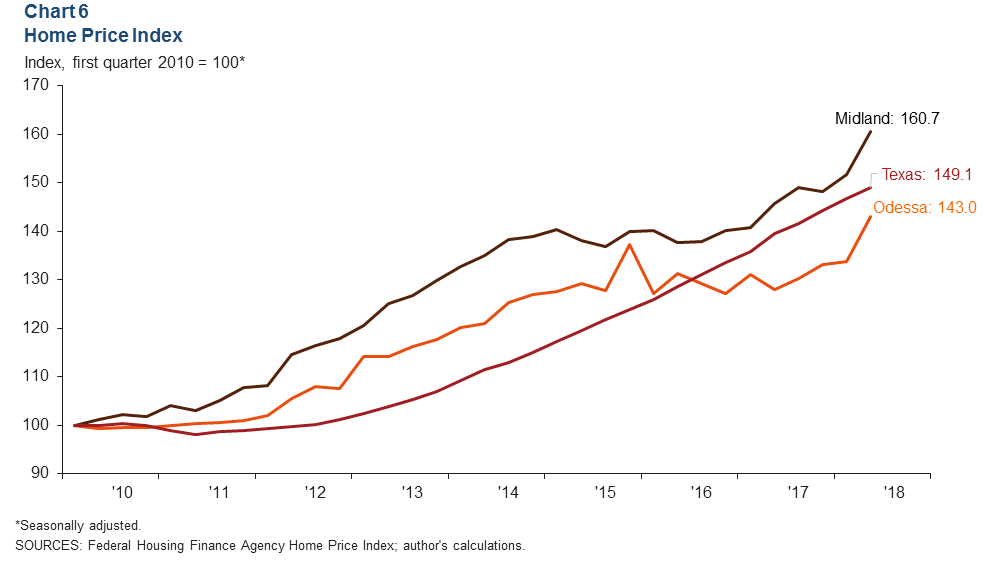
Midland–Odessa Home Price Increases Outpace the State’s
Home prices in Midland and Odessa have risen considerably in 2018 (Chart 6). Growth between fourth quarter 2017 and second quarter 2018 was 10.2 percent in Midland and 11.7 percent in Odessa, compared with the Texas average of 3.4 percent.
NOTES: Data are for the Midland–Odessa metropolitan statistical area (Martin, Midland and Ector counties), except for energy data, which cover the 55 counties in West Texas and southern New Mexico that make up the Permian Basin region. Data may not match previously published numbers due to revisions.
About Permian Basin Economic Indicators
Questions can be addressed to Dylan Szeto at Dylan.Szeto@dal.frb.org. Permian Basin Economic Indicators is released on the third Wednesday of every month.