Permian Basin Economic Indicators

Production growth in the Permian Basin continued to rise even as the rig count fell. The gap in prices between West Texas Intermediate (WTI)–Midland and WTI–Cushing closed as transportation constraints eased; however, the natural gas price spread for Waha Hub and Henry Hub increased due to pipeline constraints. Employment growth in the Permian in 2018 was strong in the majority of sectors.
Production
Oil Output Continues to Soar
The Permian Basin produced an average of nearly 4 million barrels per day (mb/d) of crude oil in February, a 1.2 percent increase since January (Chart 1). Production growth in the shale basin averaged 18 percent per year from 2010 to 2018, with the region accounting for 32.7 percent of U.S. oil production in December 2018.
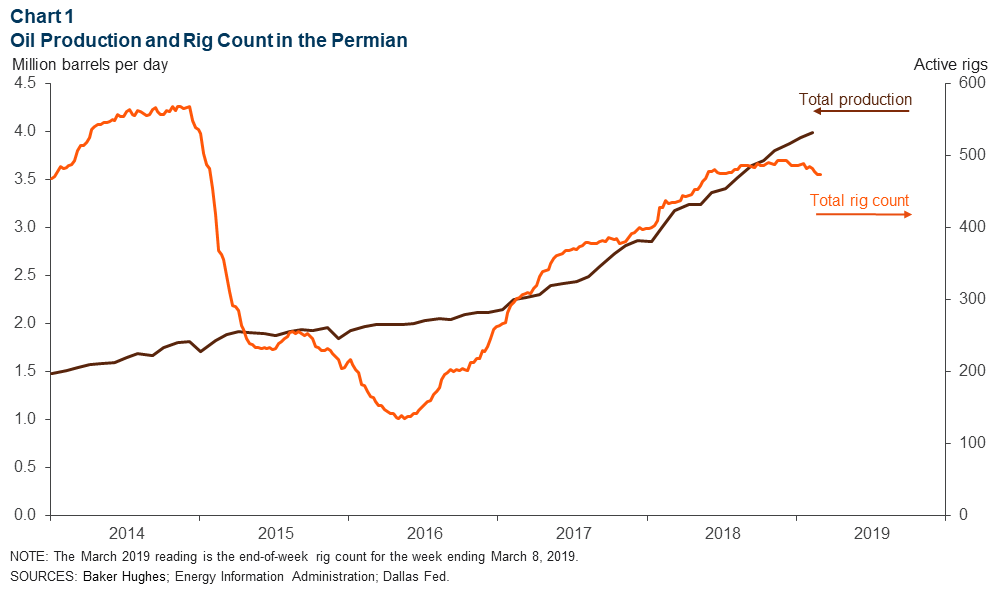
The in-basin rig count dropped from an average of 485 rigs in January to 476 in February, extending the downward trend that began in October 2018. Recent earnings calls indicate that operators are lowering their capex expectations for 2019 due to more conservative price outlooks, which could explain the rig decline.
Tight Oil Production Up in Three Subsections
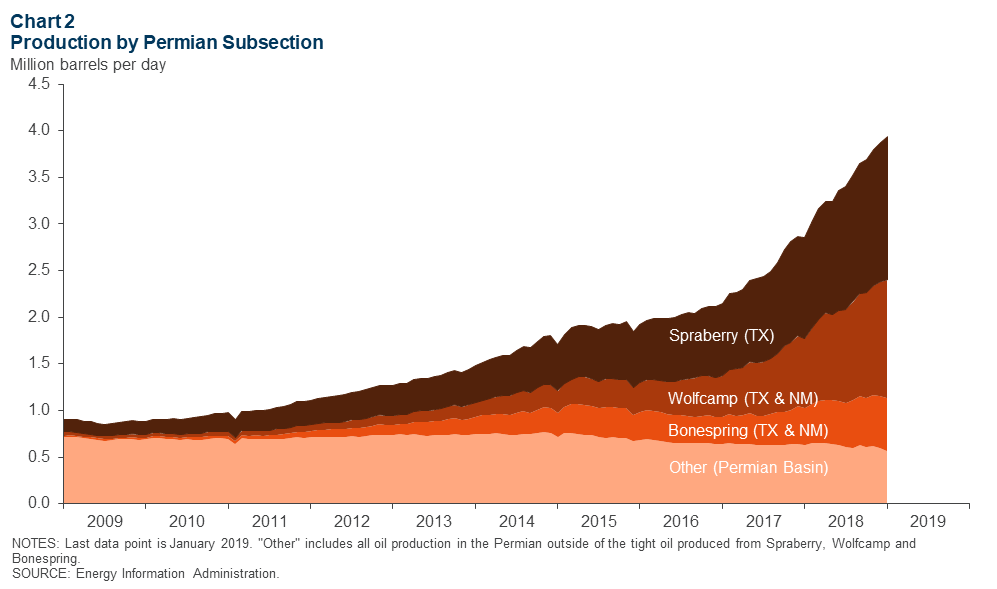
In January, the U.S. produced almost 7.5 mb/d of tight oil, also known as unconventional oil. Three geologic subsections within the Permian Basin have made outsized contributions to U.S. tight oil production: the Spraberry, Wolfcamp and Bonespring formations (Chart 2). Spraberry produced over 1.5 mb/d on average in January, an increase of 42 percent from January 2018. Bonespring output rose 40 percent over the same period while Wolfcamp production grew 71 percent, reaching nearly 1.3 mb/d in January.
Pricing
West Texas Intermediate Spread Closes
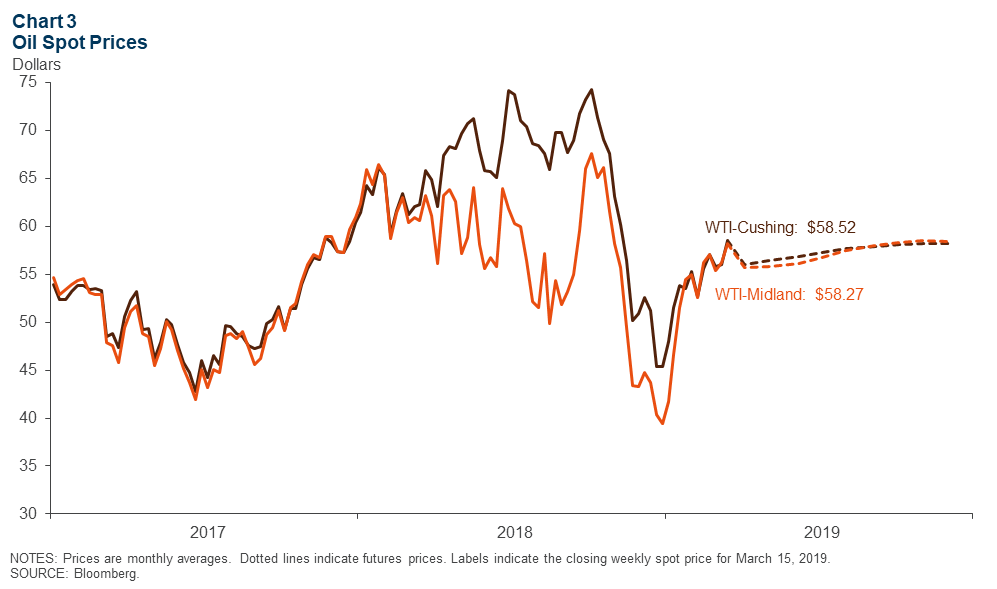
The gap between spot prices of WTI crude oil priced in Midland and in Cushing, Oklahoma, narrowed as 2018 came to an end (Chart 3). The largest spread in 2018 ($17.90) was seen in August, when Permian production increased and pipeline capacity was insufficient to meet the demand. As transportation constraints eased, the spread diminished. For the week of March 15, closing spot prices for WTI–Midland and WTI-Cushing were $58.27 and $58.52, respectively. Futures contracts for Midland and Cushing crudes show the market expects their prices to stay in the mid-$50 range through the end of 2019.
Price Gap Increases for Waha and Henry Hub
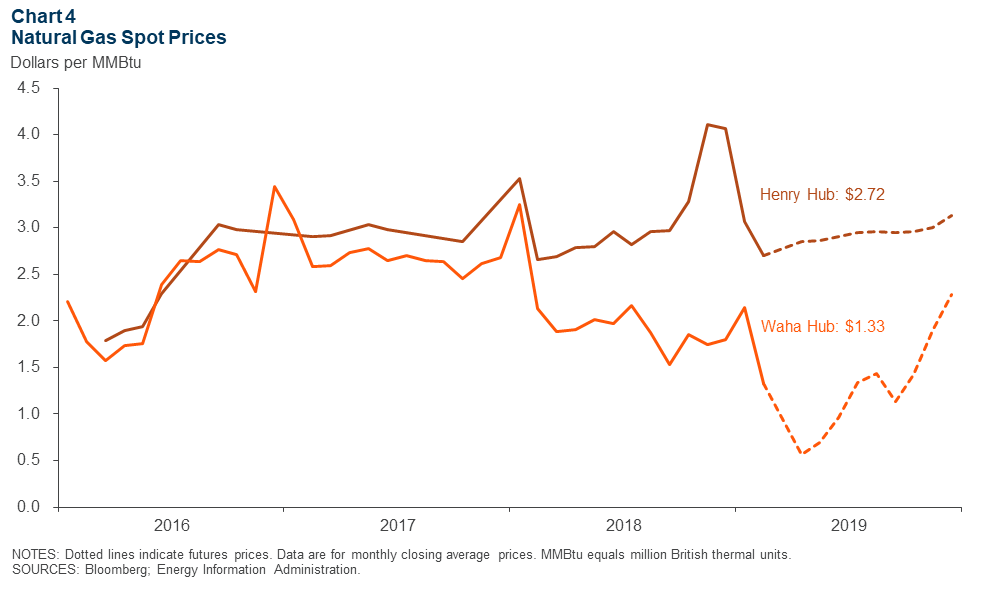
Waha Hub’s monthly average closing spot price, a marker for natural gas prices in West Texas, dropped to $1.33 per million British thermal units (MMBtu) in February (Chart 4). This marked its lowest monthly closing average in the past four years and coincided with an increase in the spread between Waha and the Henry Hub natural gas benchmark price in Louisiana. Futures contracts suggest the Waha spot price will drop to $0.58 per MMBtu in April as a result of continued pipeline constraints. The spread is expected to ease in late 2019 when new pipelines are built. The market expects a Waha spot price of $2.25 per MMBtu by the end of the year.
Employment
Job Growth Strong in 2018
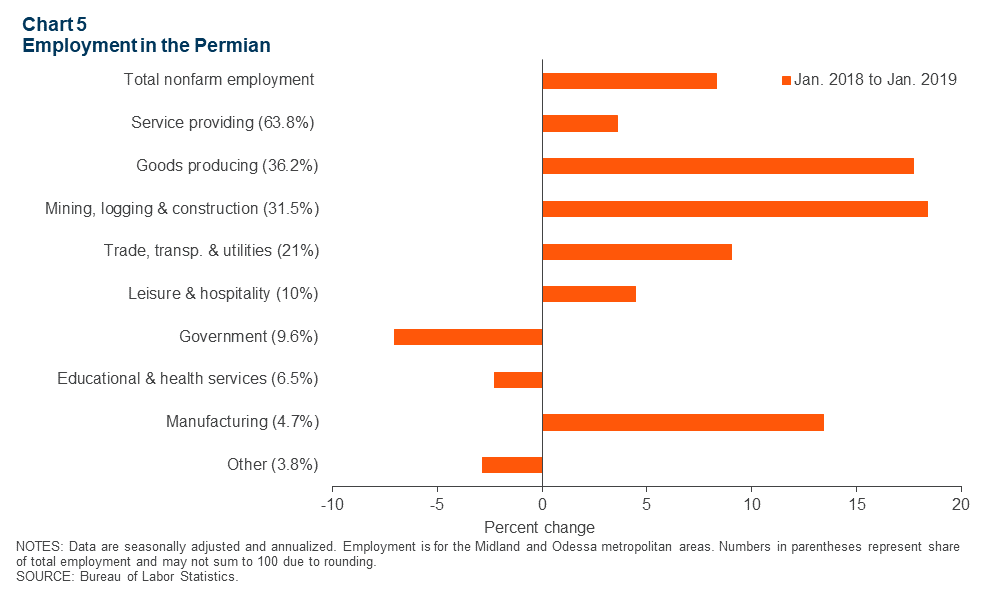
Employment growth accelerated in Midland and Odessa, the two largest metropolitan areas in the Permian Basin region, from January 2018 to January 2019 (Chart 5). Mining, logging and construction employment had the largest growth (18.4 percent), expanding from 51,760 to 61,280 employees over that period, while government employment dropped 7 percent. The goods-producing sectors—which include agriculture, mining, construction and manufacturing—saw the largest net gain of employees, adding 10,600 to their labor force.
Permian Oil Jobs Outpace Texas Overall
Texas’ overall employment grew at an annual rate of just 2.5 percent from third quarter 2017 to third quarter 2018. Over that same time, Permian oil industry jobs increased at a blistering rate of 25 percent, reaching 87,200 workers, based on a broad definition of oil industry data from the Quarterly Census of Employment and Wages (Chart 6).
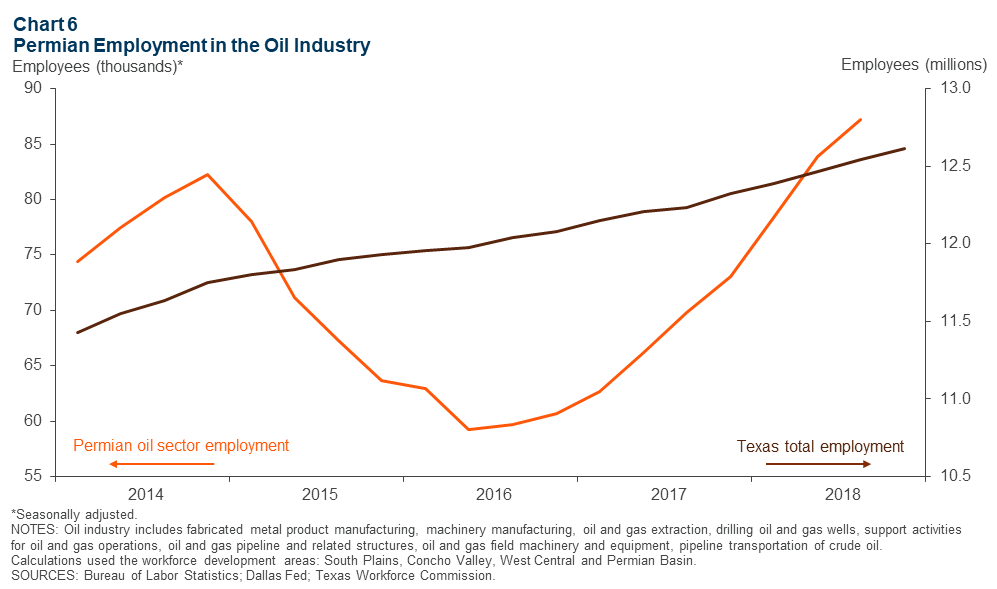
Among industry subsectors, support activities for oil and gas operations, held the largest share of industry jobs in third quarter 2018, with 45,100 employees. Oil and gas pipeline and related structures construction outpaced all others in the Permian with a growth rate of 55 percent year over year in third quarter 2018.
NOTES: Employment data are for the Midland–Odessa metropolitan statistical area (Martin, Midland and Ector counties), unless otherwise specified. Energy data includes the 55 counties in West Texas and southern New Mexico that make up the Permian Basin region. Data may not match previously published numbers due to revisions.
About Permian Basin Economic Indicators
Questions can be addressed to Emma Marshall at emma.marshall@dal.frb.org or Jesse Thompson at jesse.thompson@dal.frb.org. Permian Basin Economic Indicators is released on the third Wednesday of every month.