Permian Basin Economic Indicators

| Midland–Odessa economy dashboard (first quarter 2023) | |||||
| Job growth (annualized) Dec. '22–Mar. '23 |
Avg. unemployment rate |
Avg. hourly earnings | Avg. hourly earnings growth y/y |
||
| -0.2% | 3.3% | $33.05 | 1.0% | ||
Permian Basin employment slipped 0.2 percent over the first three months of 2023 even though the mining, logging and construction sector grew 8.5 percent. The region’s rig count is down as the price of oil has declined from its peak last summer. Wages fell in the first quarter in Midland but rose in Odessa. Home prices inched up, while the number of sales shot up.
Energy
Rig count flat; oil prices fall but mining jobs increase
The price of West Texas Intermediate (WTI) crude was down 32 percent from its peak in June 2022, averaging $77 per barrel in first quarter 2023 (Chart 1). The oil rig count declined 4.7 percent in the U.S. but only 0.9 percent in the Permian during the quarter. The Permian rig count has been seesawing within a limited range of 337 to 353 over the past year.
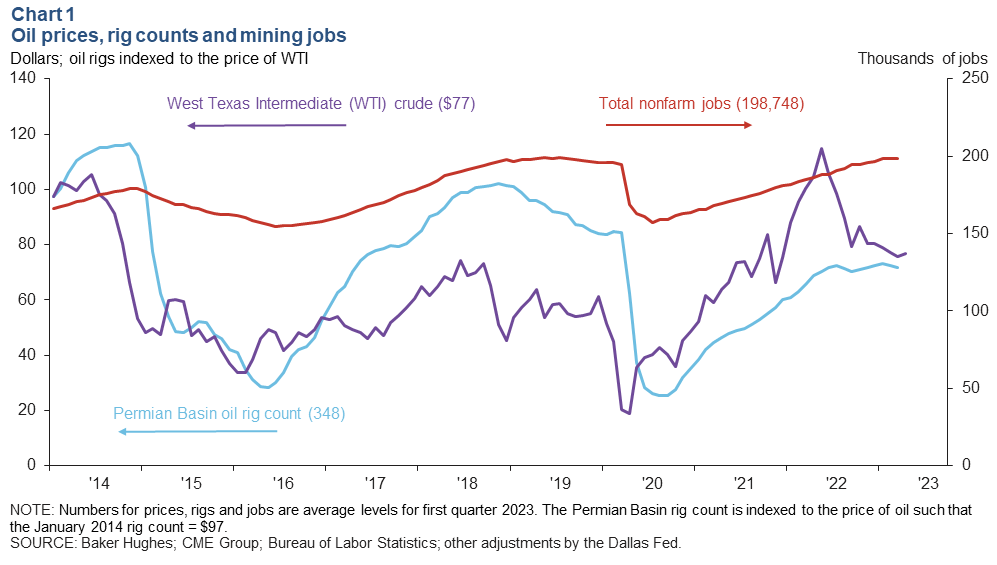
The oil and gas industry continues to add jobs, helping to fuel workforce growth in Texas. Oil and gas extraction and support activities for mining added 2,763 workers in Texas during the first quarter, mostly in Houston, Midland and Odessa. Mining, logging and construction jobs in Midland and Odessa increased by 1,300 in the quarter. However, analysts expect employment growth to slow in the coming months given the decline in the rig count since the start of 2023.
Oil production climbs
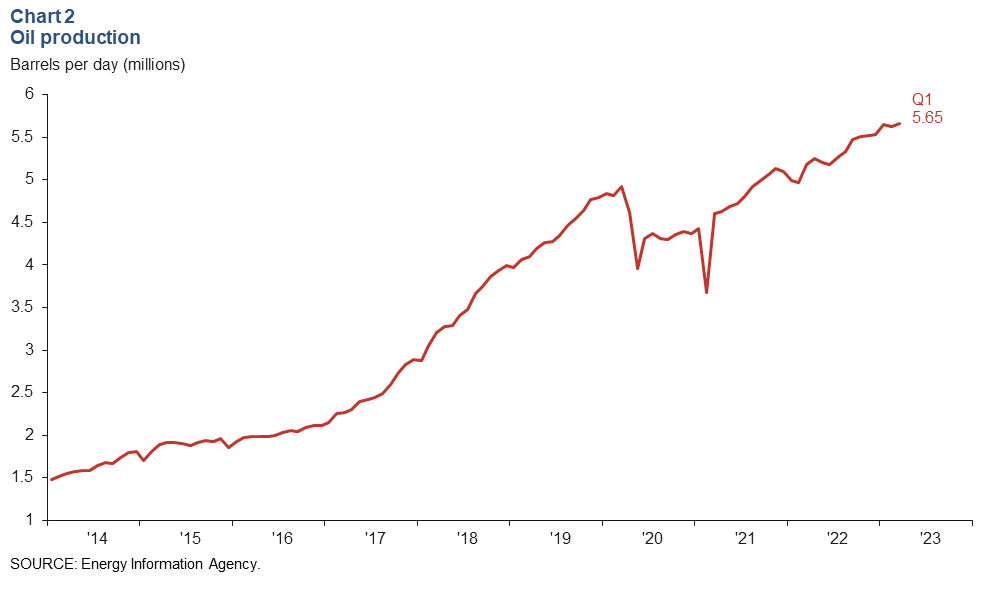
Permian Basin oil production continued to rise in the first quarter, reaching another all-time high of 5.65 million barrels per day (Chart 2). The basin has been in the spotlight recently for merger and acquisition deals among many top oil producers. One of the largest was Vital Energy’s $540 million deal to buy Forge Energy II Delaware’s assets in the basin.
Employment
Employment growth cools
While the Permian region saw strong year-over-year employment growth in the first quarter, the pace of growth started to slow (Chart 3). Total nonfarm employment growth was relatively flat in the quarter, declining 0.2 percent, after rising 6.9 percent in fourth quarter 2022. By comparison, Texas at 3.9 percent and the U.S. at 2.3 percent saw stronger employment growth in the first quarter.
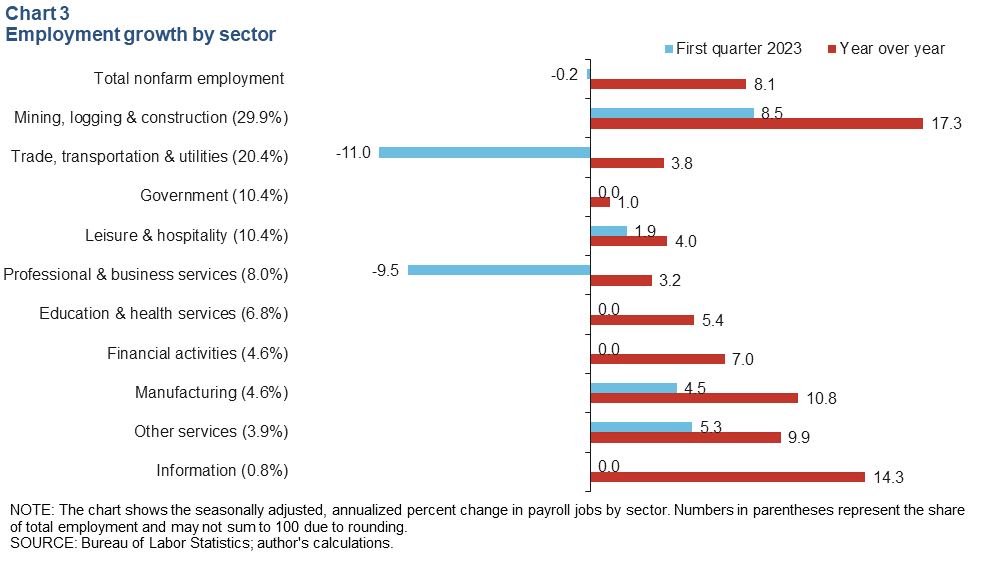
Trade, transportation and utilities (down 11.0 percent) and professional and business services (down 9.5 percent) experienced the most notable slowdowns in job growth during the first quarter.
The energy boom seen over the past year led to a 17 percent increase in the metro’s largest industry, mining, logging and construction. The surge in oil production in the Permian initially spurred a need to hire workers for even non-oil and gas jobs, but it appears the hiring frenzy is slowing.
Unemployment rate changes little
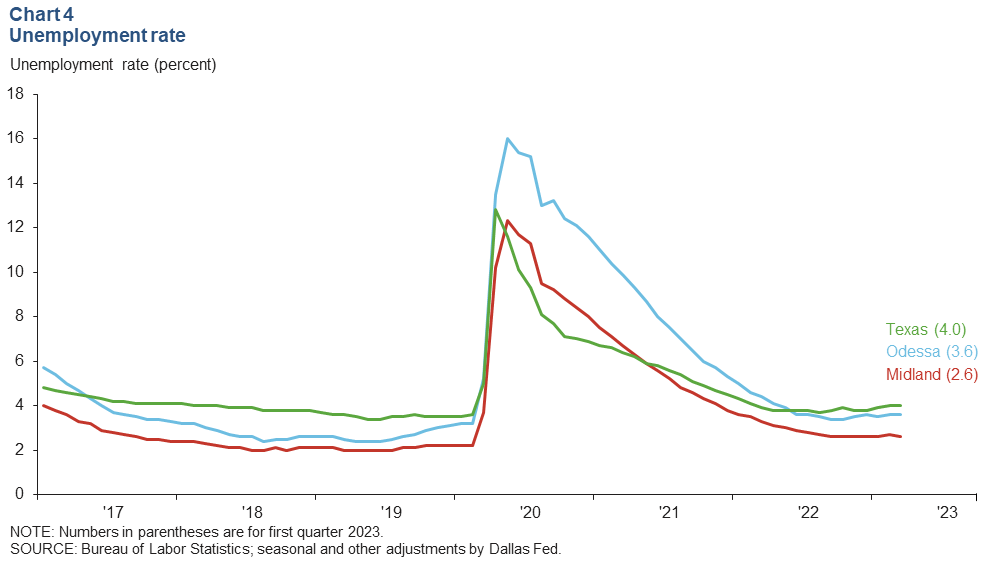
The unemployment rate was flat in Midland at 2.6 percent and only rose slightly in Odessa to 3.6 percent on average in during the first quarter (Chart 4). This compares with the state’s jobless rate of 4.0 precent and the nation’s rate of 3.5 percent.
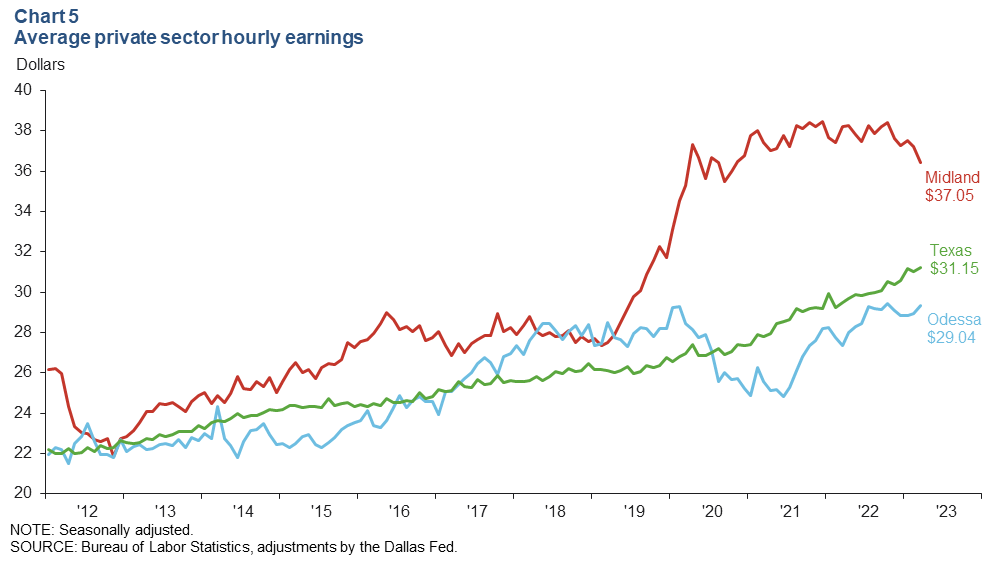
Wages in Midland fall
Hourly earnings fell 2.3 percent in Midland but rose 1.6 percent in Odessa during the first quarter (Chart 5). The gap between wages in Midland and Odessa declined significantly, by 34.9 percent, year over year as of March. The labor market remains tight in Odessa because the oil and gas sector routinely suffers from boom-and-bust cycles, making it difficult to attract and retain talent for oilfield service jobs. In the Dallas Fed Energy Survey, many exploration and production companies cited labor shortages as headwinds for increases in production.
Housing
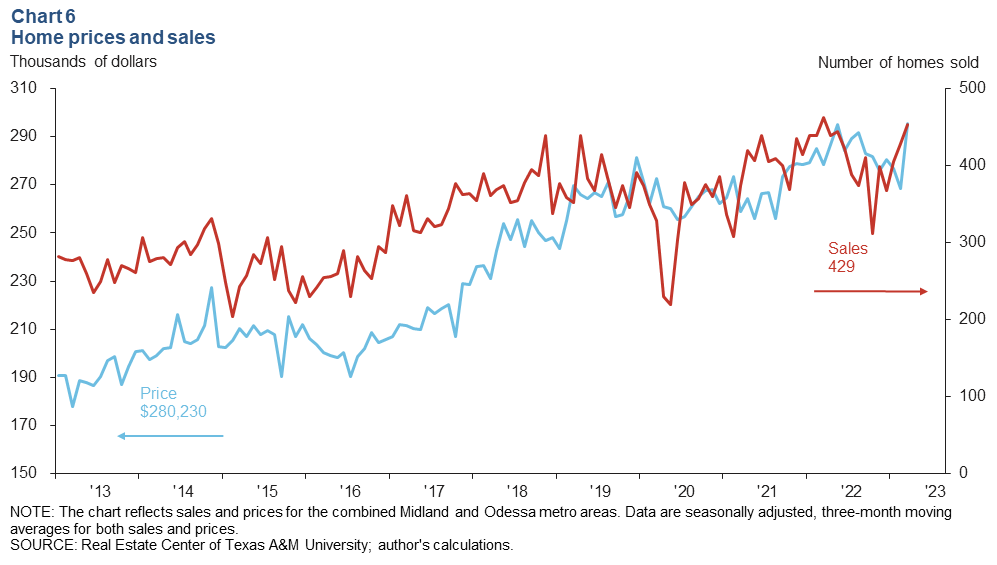
The Midland–Odessa area’s median home price was $280,230 in the first quarter, just above the fourth quarter’s median of $279,390 (Chart 6). Meanwhile, monthly home sales rose sharply and averaged 429 during the first quarter, markedly above the prior quarter’s average of 359.
NOTES: Employment data are for the Midland–Odessa metropolitan statistical area (Martin, Midland and Ector counties), unless otherwise specified. Energy data include the 55 counties in West Texas and southern New Mexico that make up the Permian Basin region. Data may not match previously published numbers due to revisions.
About Permian Basin Economic Indicators
Questions or suggestions can be addressed to Kenya Schott at kenya.schott@dal.frb.org. Permian Basin Economic Indicators is released quarterly.