Permian Basin Economic Indicators

| Midland–Odessa economy dashboard (first quarter 2025) | |||||
| Job growth (annualized) Dec. '24–March '25 |
Avg. unemployment rate |
Avg. hourly earnings | Avg. hourly earnings growth y/y | ||
| Midland–Odessa | 2.9% | 3.2% | $37.45 | 10.2% | |
| Midland | 2.6% | 3.0% | $39.12 | 8.5% | |
| Odessa | 3.4% | 3.6% | $34.94 | 13.2% | |
Employment in the Permian Basin grew in the first quarter. Meanwhile, the unemployment rate in the region increased slightly from the end of fourth quarter 2024. Home sales decreased, while the median price of homes sold fell slightly. Oil production remained stable, as the number of new wells increased, and the number of active rigs ticked down.
Energy
First-quarter natural gas prices increase
As the U.S. experienced lower temperatures in the first quarter, natural gas prices increased (Chart 1). Henry Hub’s average price increased from $14.16 per barrel of oil equivalent (BOE) to $24.03 in the first quarter, while Waha increased from $3.58 BOE to $10.27 in the same period.
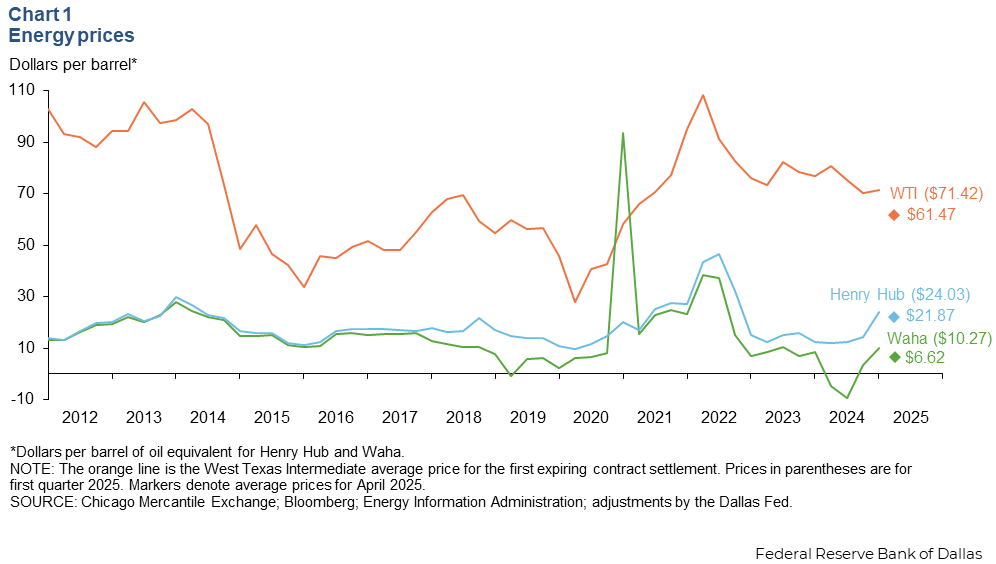
The price of West Texas Intermediate crude oil averaged $71.42 per barrel in the first quarter, a 1.6 percent increase from the fourth quarter. However, prices subsequently declined 13.9 percent from the first quarter to a daily average of $61.47 in April. This came after escalating trade tensions put downward pressure on expected global oil consumption growth. The price of oil also declined when OPEC+ announced higher-than-expected production increases.
Oil production remains stable
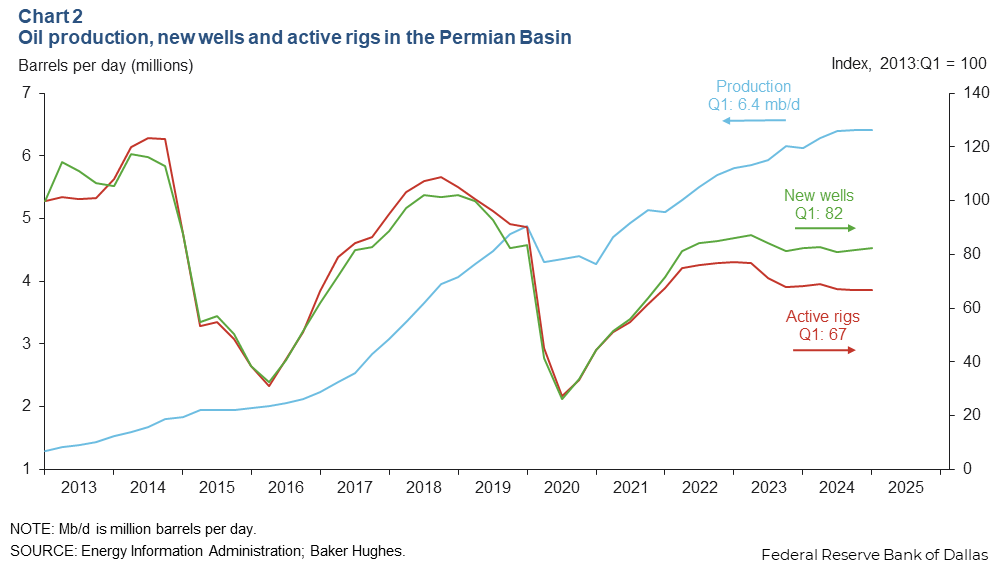
Oil production in the Permian Basin remained at 6.4 million barrels per day in the first quarter (Chart 2). The number of new wells increased 1.1 percent from the fourth quarter last year, while the number of active rigs decreased 0.3 percent over the same period. This continued the trend of increased drilling productivity with more wells and fewer active rigs.
Labor market
Employment increases in Midland–Odessa region
Total nonfarm employment grew an annualized 2.9 percent in the first quarter from fourth quarter 2024 (Chart 3 ). This first-quarter employment growth outpaced the U.S. (1.0 percent) and Texas (1.9 percent). The trade, transportation and utilities sector added the most jobs in the first quarter, followed by government. The professional and business services sector notably contracted 9.2 percent in the first quarter.
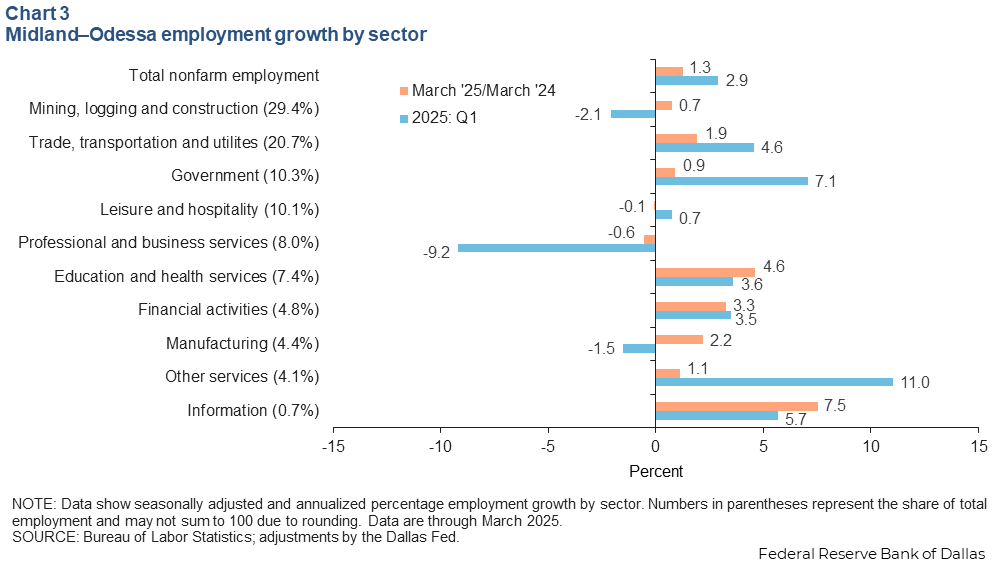
On a year-over-year basis, employment in Midland–Odessa grew 1.3 percent. All sectors except for leisure and hospitality and professional and business services experienced employment growth.
Unemployment rates tick up slightly
The unemployment rates in both Midland and Odessa were slightly higher in March compared with December 2024 (Chart 4). Midland’s unemployment rate increased from 2.9 percent in December 2024 to 3.0 percent in March, while Odessa’s jobless rate increased from 3.5 percent to 3.6 percent in the same period. Meanwhile, Texas’ unemployment rate decreased from 4.2 percent in December 2024 to 4.1 percent in March.

Housing
Single-family housing permits decline
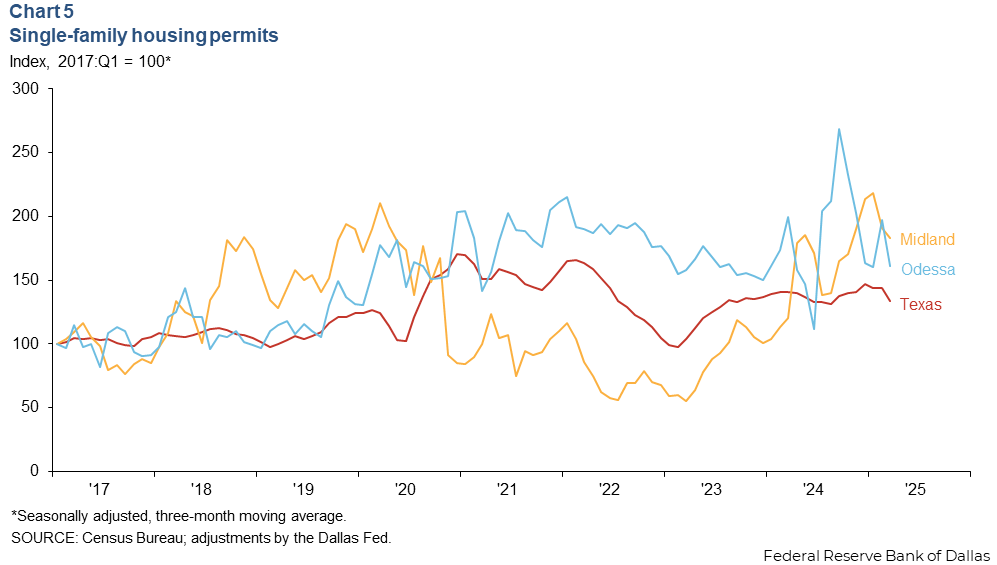
Single-family housing permits decreased in the first quarter compared with the prior quarter in both Midland and Odessa (Chart 5). March single-family housing permits in Midland were down 14.3 percent compared with December. Odessa’s single-family housing permits fell 1.7 percent from December. Texas single-family housing permits declined 9.1 percent over that same period.
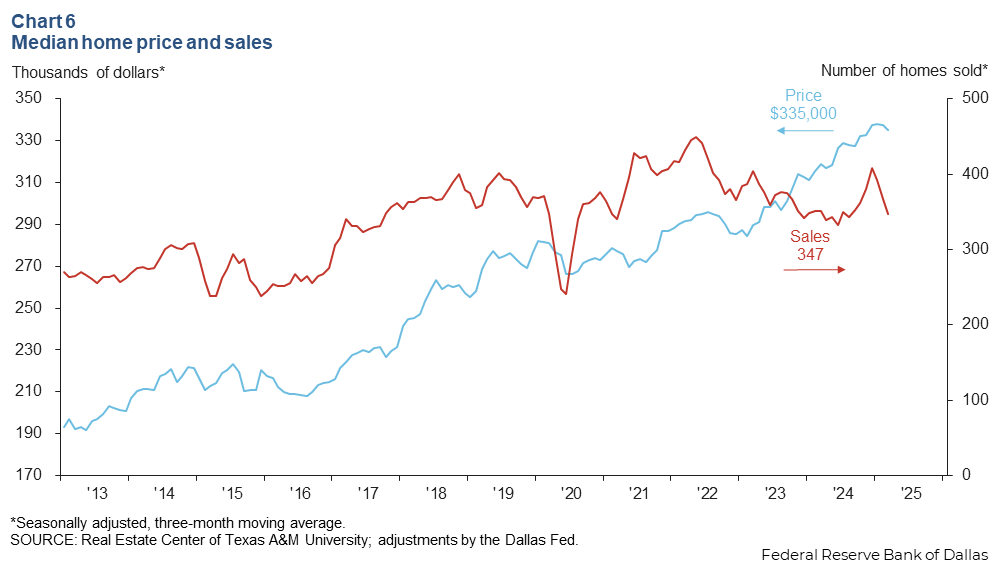
Home sales fall
Home sales in the Permian Basin decreased 15.0 percent in March compared with December 2024 (Chart 6). March home sales in the region also declined year over year, down 1.0 percent. The median price of homes sold declined 0.8 percent compared with December 2024. However, the median price remained higher compared with March 2024, up 5.0 percent. The median price of $335,000 was just below Texas’ median price of $339,000.
NOTES: Employment data are for the Midland–Odessa metropolitan statistical area (Martin, Midland and Ector counties), unless otherwise specified. Energy data include the 55 counties in West Texas and southern New Mexico that make up the Permian Basin region. Data may not match previously published numbers due to revisions.
About Permian Basin Economic Indicators
Questions or suggestions can be addressed to Vaughn Hajra at vaughn.hajra@dal.frb.org. Permian Basin Economic Indicators is released quarterly.