Permian Basin Economic Indicators

| Midland–Odessa economy dashboard (March 2026) | |||||
| Job growth (annualized) Dec. '25–Mar. '26 |
Unemployment rate |
Avg. hourly earnings | Avg. hourly earnings growth y/y | ||
| Midland–Odessa | 0.3% | 3.3% | $32.51 | -13.3% | |
| Midland | 1.6% | 3.1% | $32.98 | -15.9% | |
| Odessa | -1.6% | 3.7% | $31.79 | -8.9% | |
Employment in the Texas Permian Basin grew in the three months ending in March and unemployment rates fell slightly. Both home sales and the median price of homes sold decreased. Oil production, the number of new wells drilled and the number of active rigs all declined.
Energy
Crude oil prices rise in first quarter
Natural gas prices in the Permian Basin (Waha) fell while national benchmark natural gas prices (Henry Hub) rose in the first quarter of 2026. However, the price levels were propped up by severe weather (Chart 1). Henry Hub’s average price increased to $27.30 per barrel of oil equivalent (BOE) in the first quarter from $21.61 in the fourth quarter of 2025, driven by a week of cold weather that pushed the benchmark to $178 per BOE on Jan. 23, 2026.
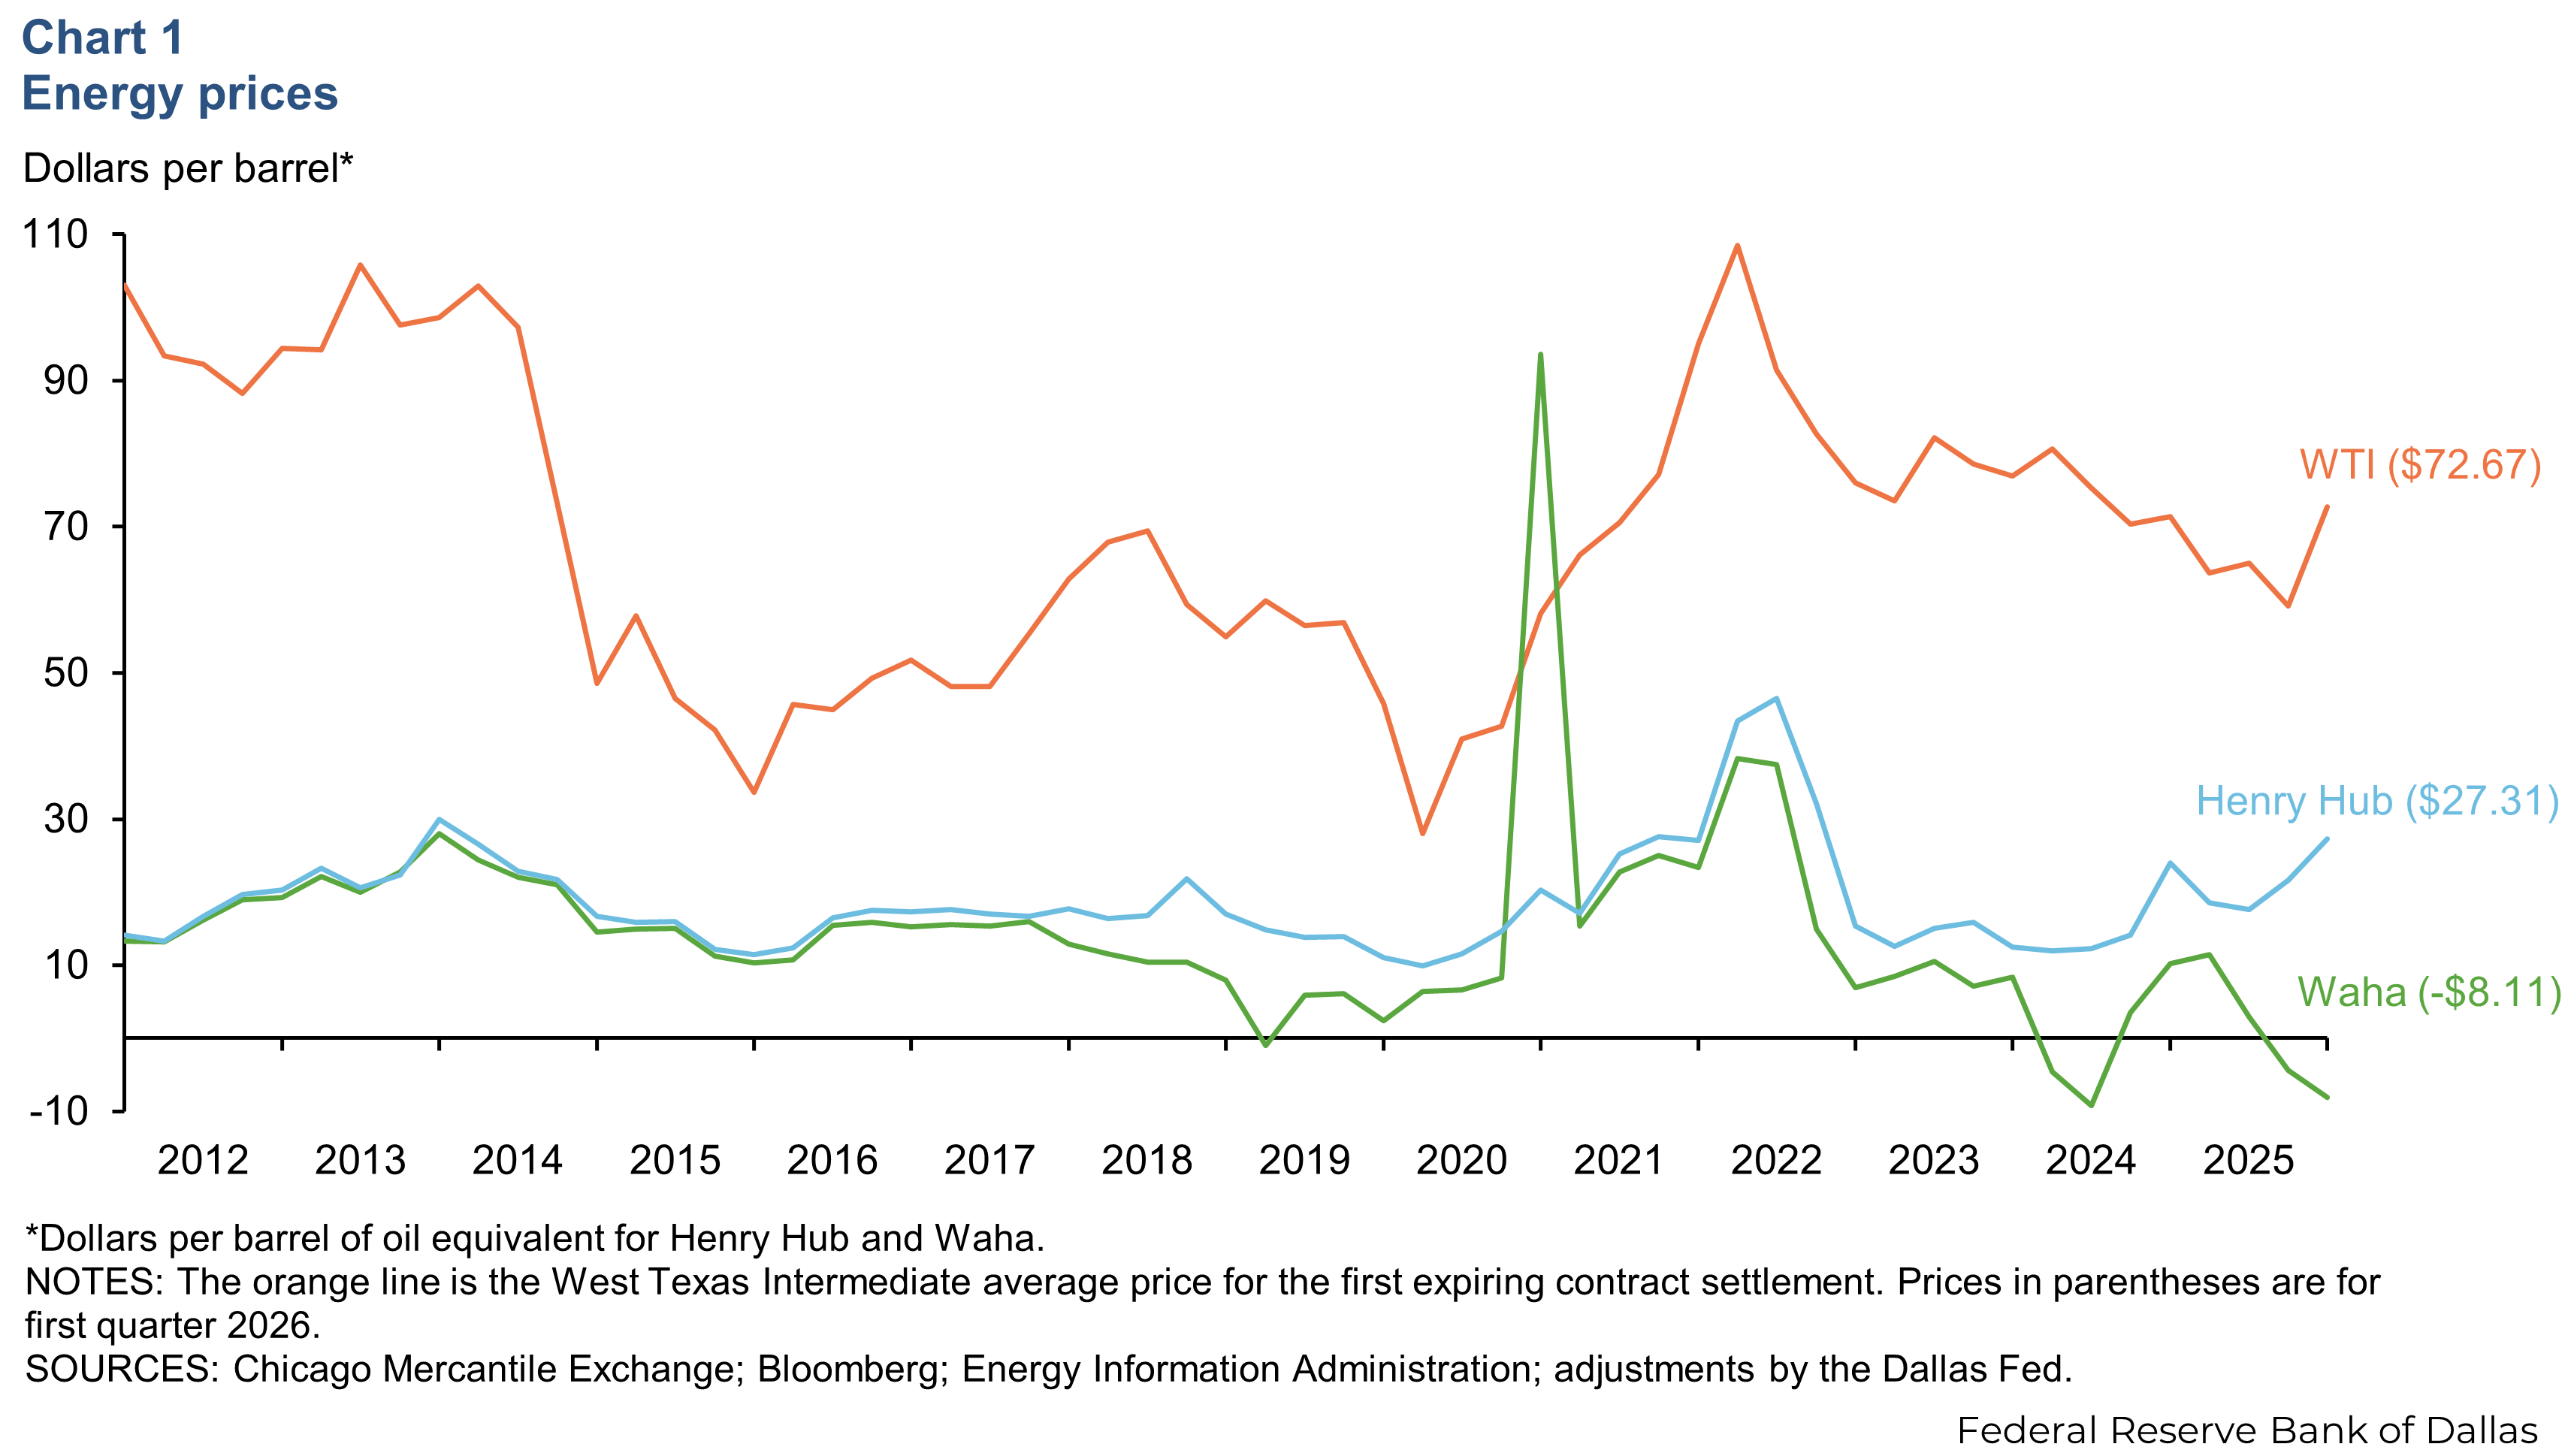
Waha, the hub in West Texas close to the producing wells of the Permian Basin, decreased to -$8.11 from -$4.36 per BOE over the same period. Absent the cold snap, the first quarter 2026 average was arguably closer to -$13 per BOE. Natural gas in the Permian Basin has frequently seen negative pricing in the past few years because the growth in supply has largely been a byproduct of oil production. When gas production approaches the physical limits of transportation and storage infrastructure, producers pay to have the natural gas removed to avoid shutting down oil production.
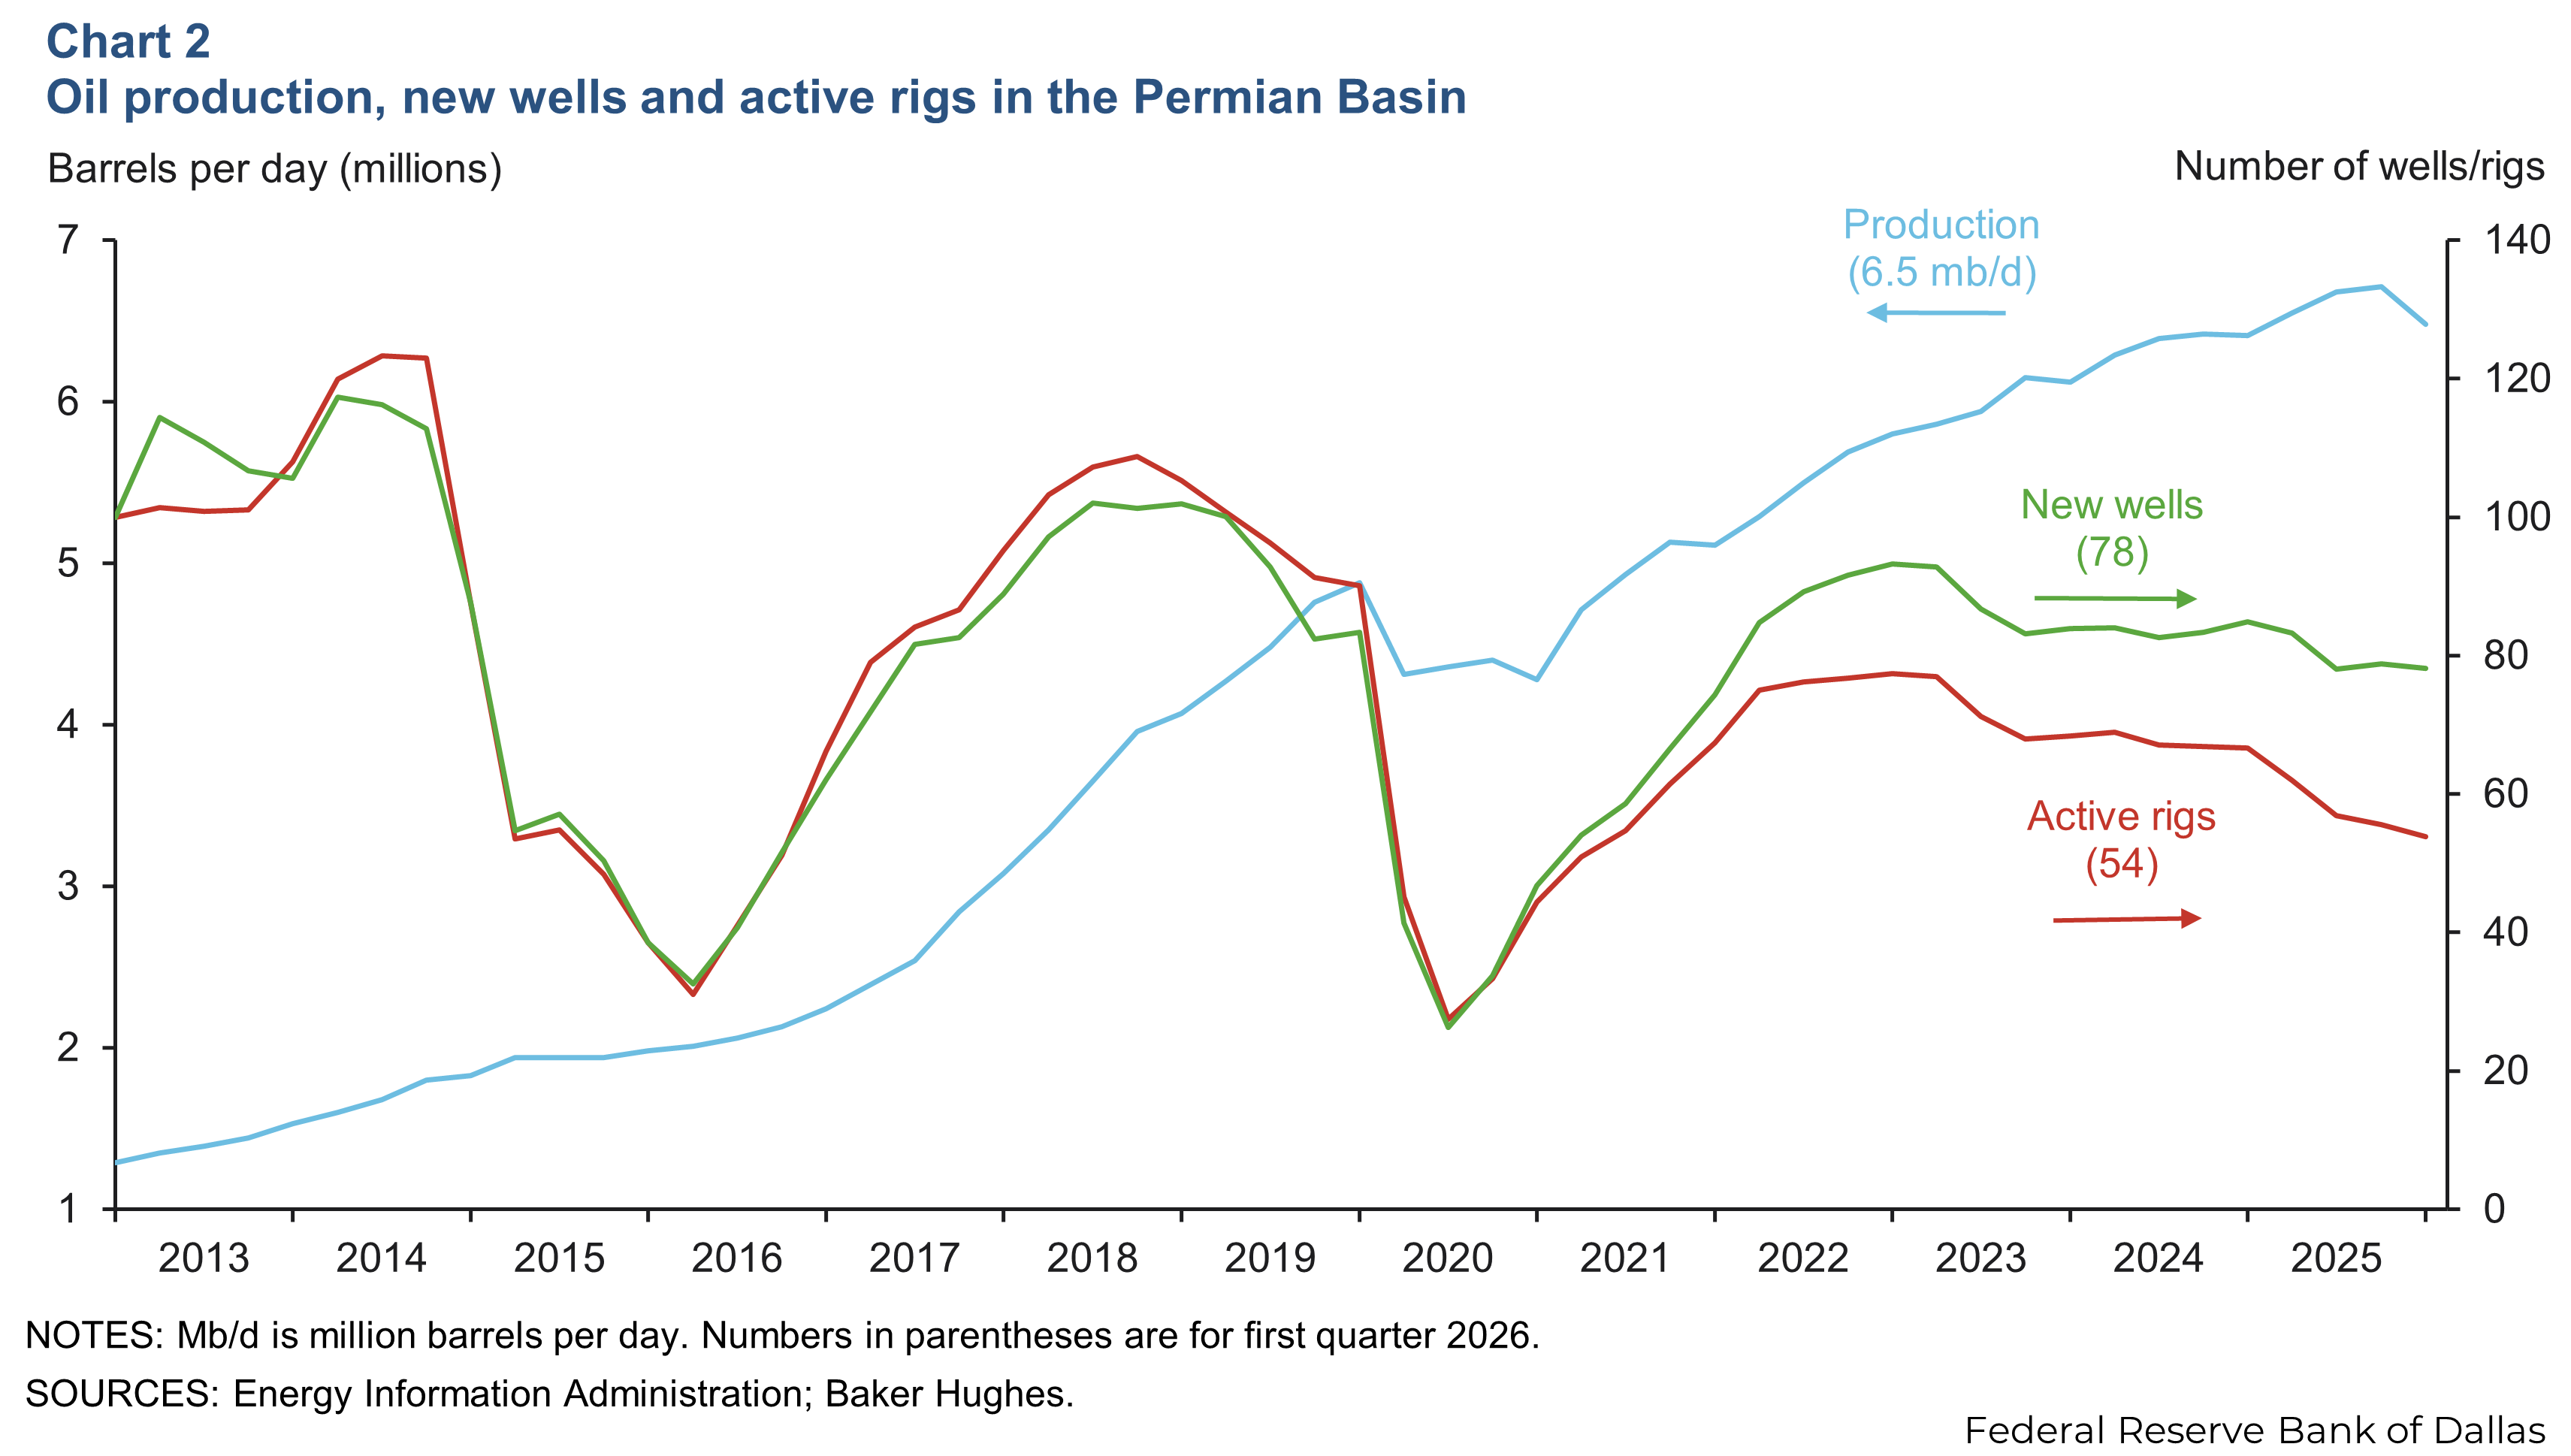
Oil production falls
Oil production in the Permian Basin fell 3.4 percent to 6.5 million barrels per day in the first quarter (Chart 2). The number of new wells drilled and the number of active rigs decreased 0.8 percent and 3.3 percent, respectively, over the same period. Exacerbated by the late-January cold snap, the decline in oil production marks a shift from the steady production increases seen over the past year.
Labor market
Employment falls in Odessa while growing in Midland
Total nonfarm employment in Midland-Odessa increased just 0.3 percent from December through March (Chart 3). Over the same period individually, total nonfarm employment fell by 1.6 percent in Odessa but rose 1.6 percent in Midland. Total U.S. nonfarm employment increased by 0.5 percent, and Texas nonfarm employment increased 1.7 percent over the same period. From December to March, employment in most sectors declined in Midland-Odessa, with the exception of government, professional and business services, and education and health services.
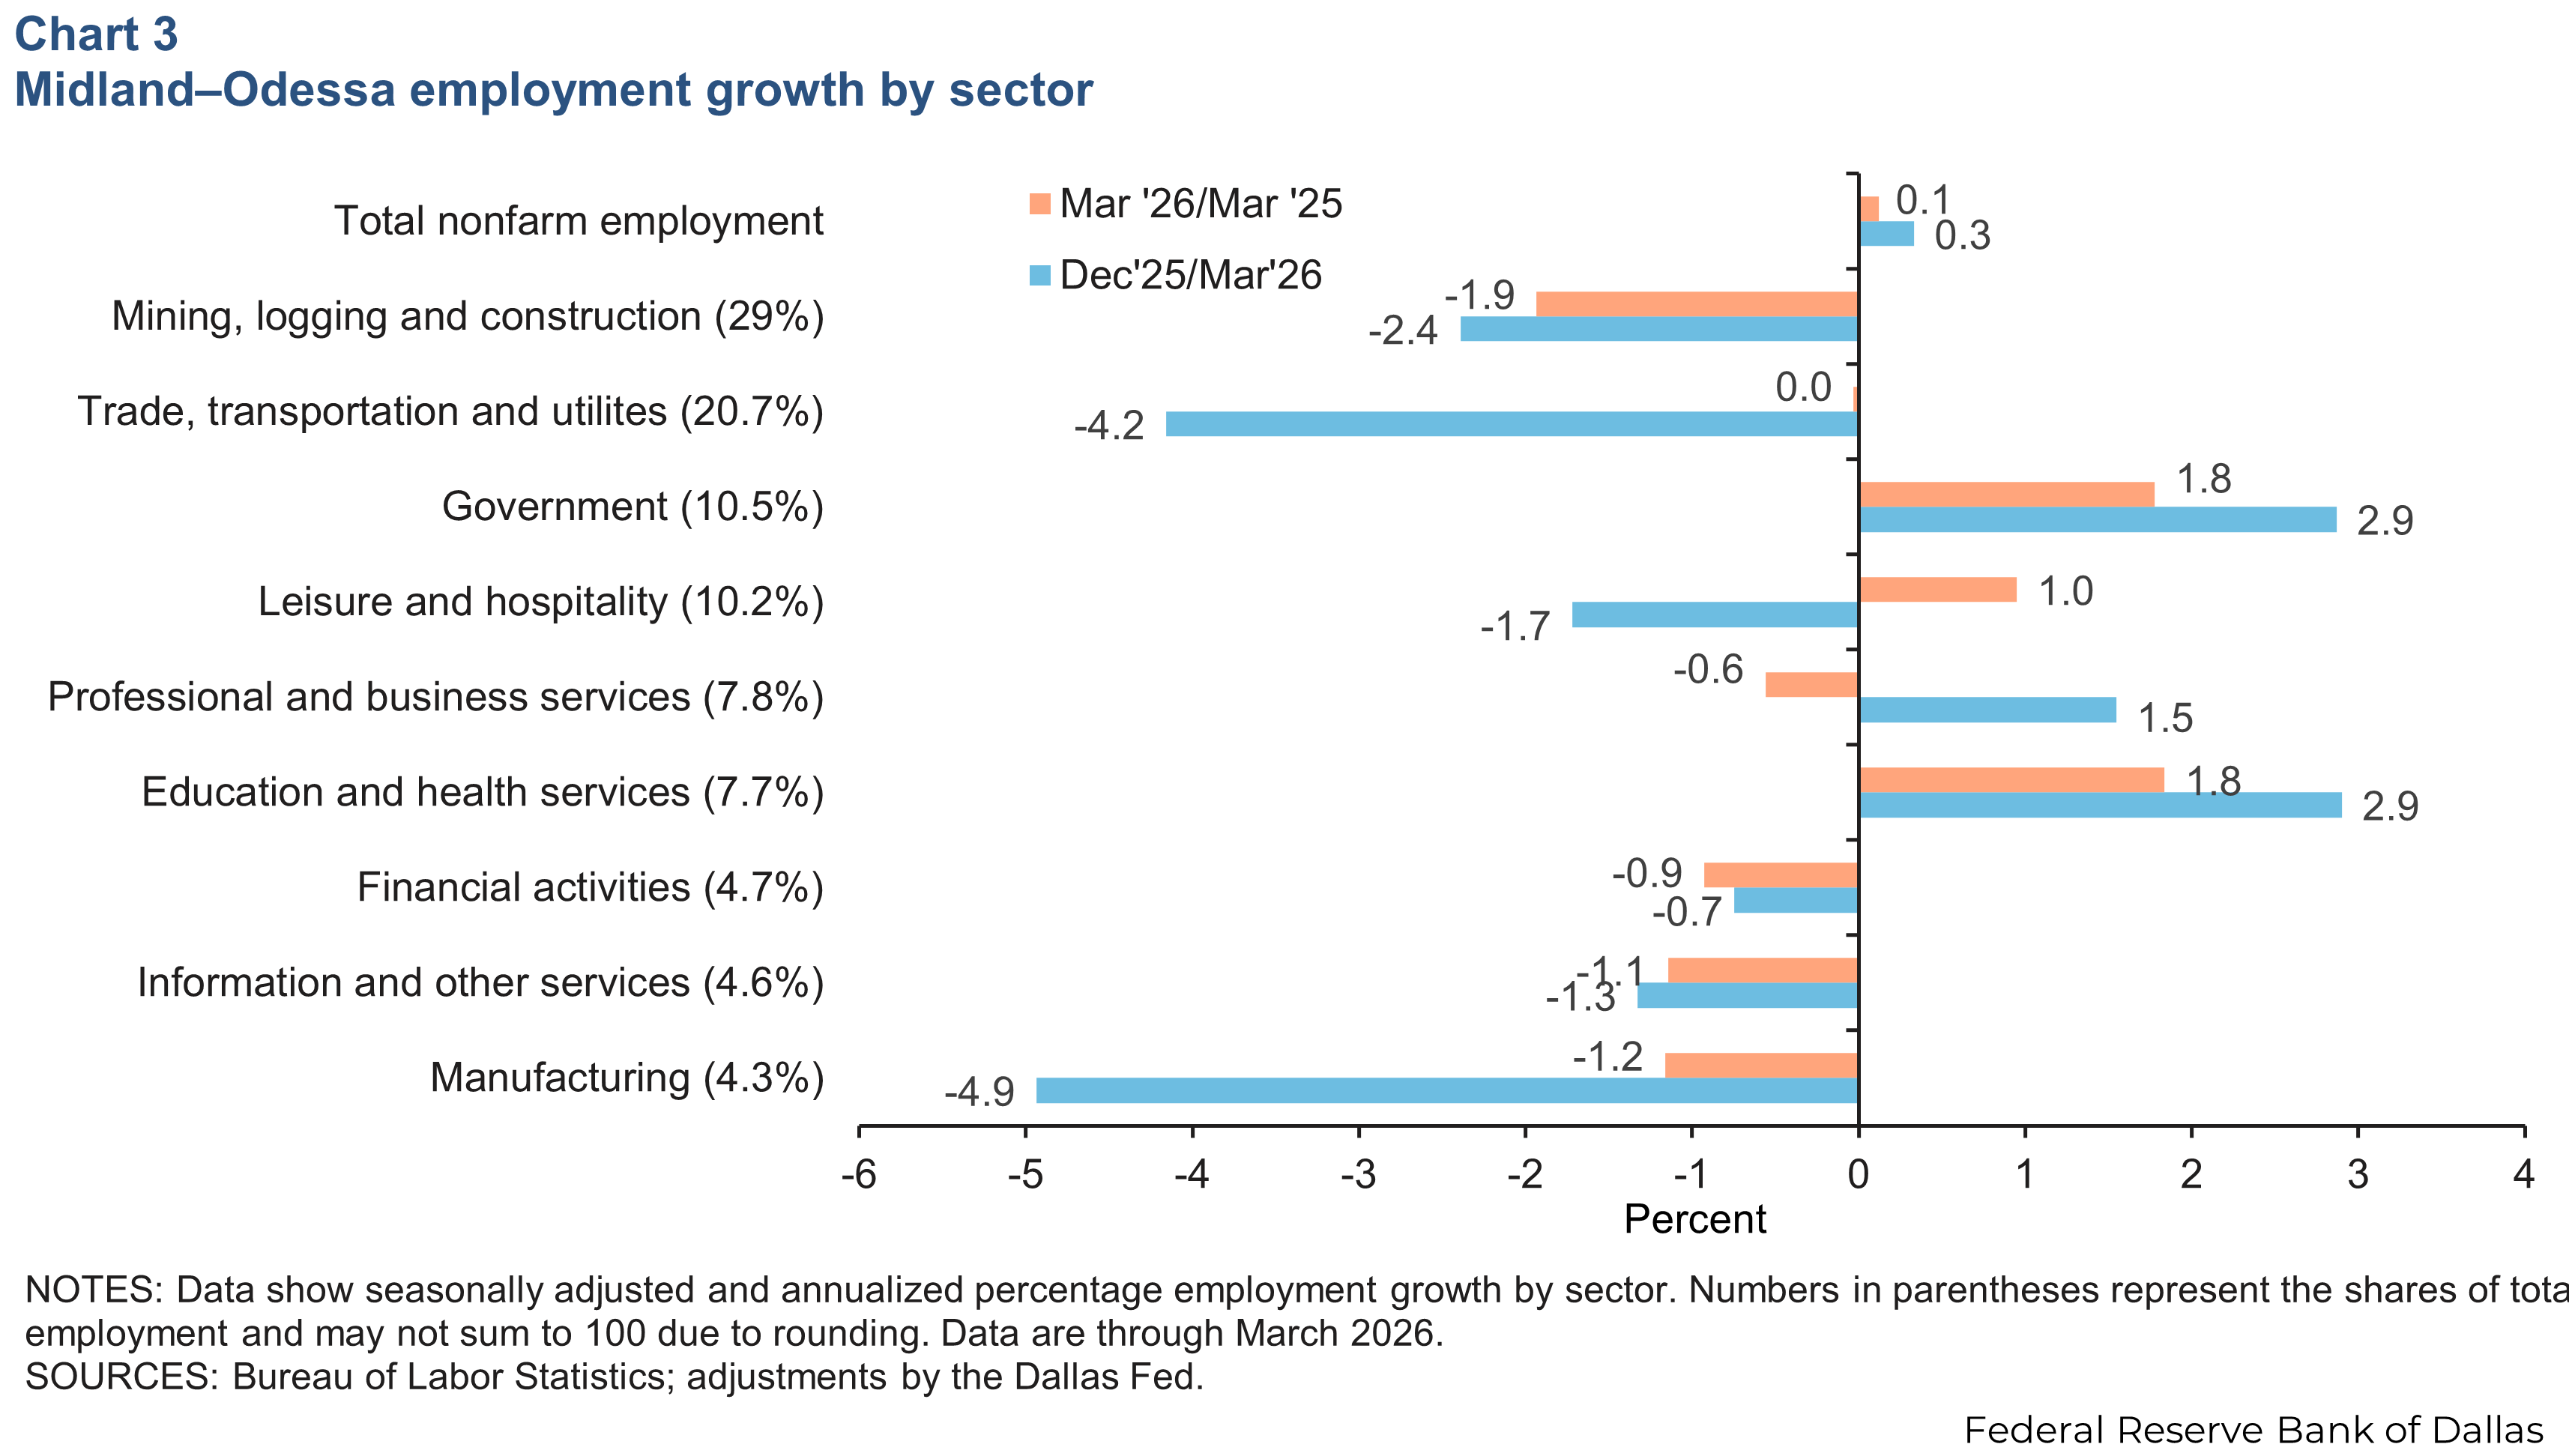
Year over year, employment in Midland–Odessa experienced almost no growth. Employment for the year declined in most sectors except government, leisure and hospitality, and education and health services.
Unemployment rates tick down
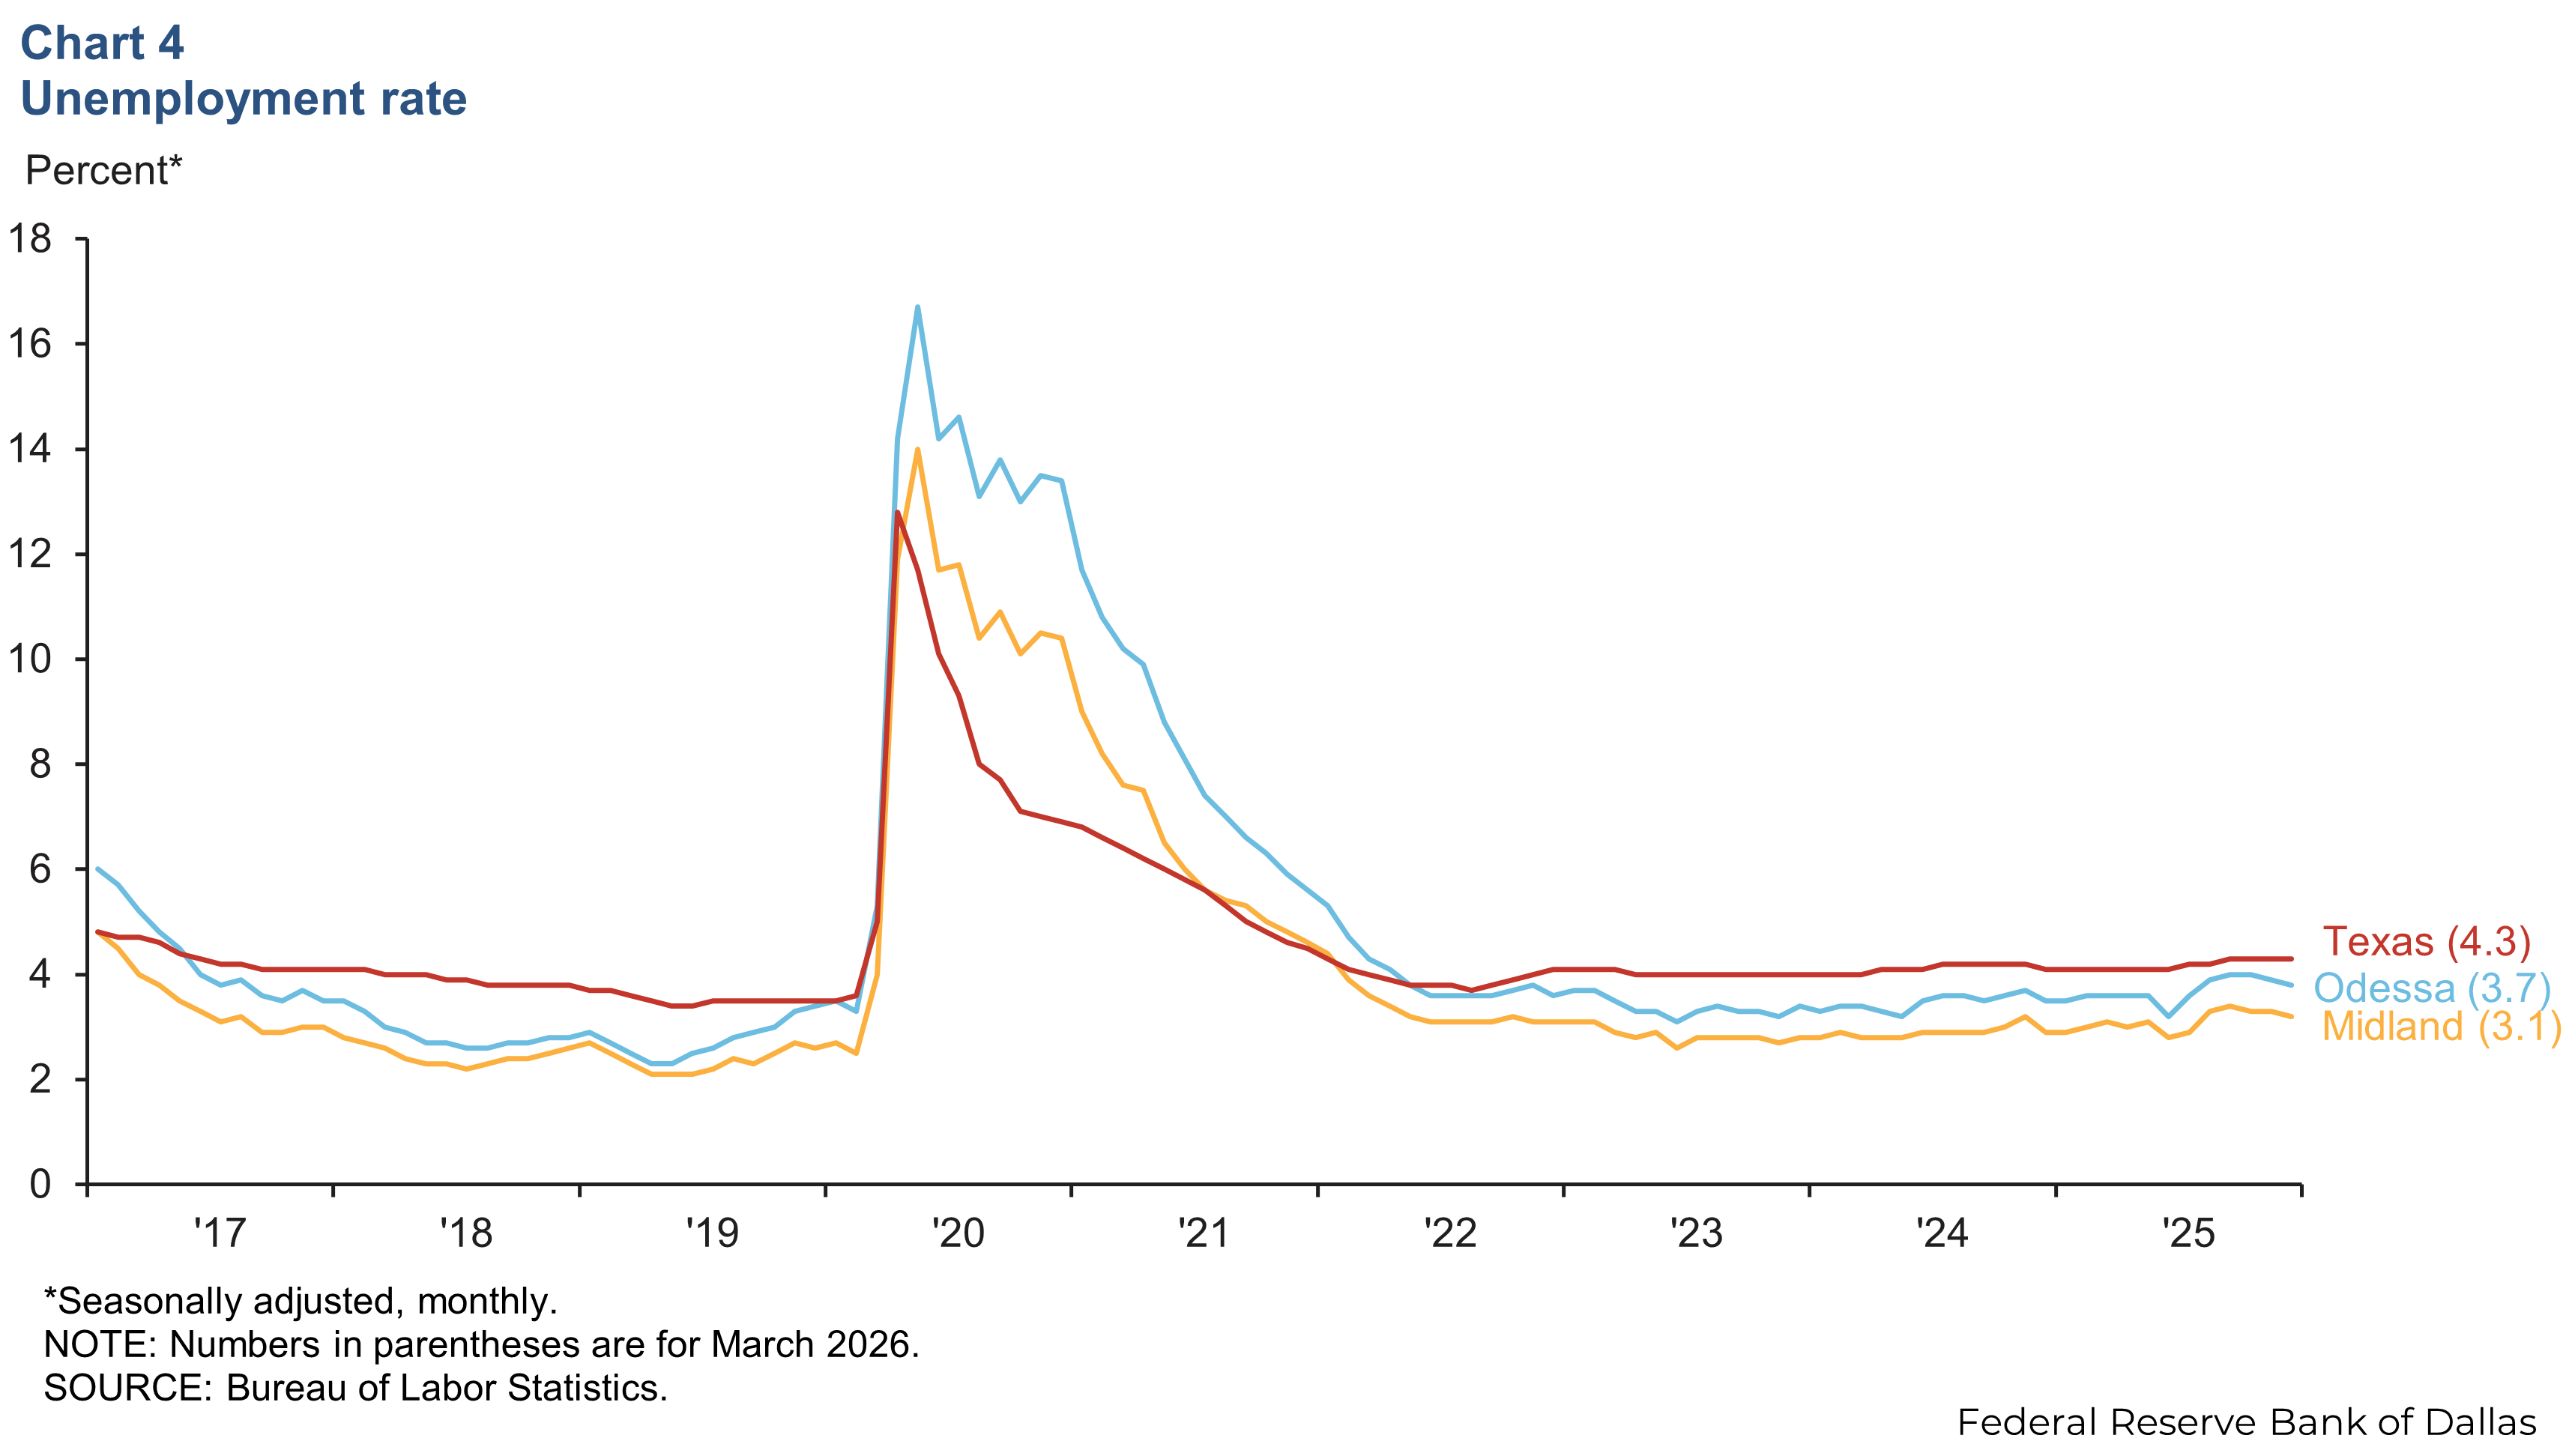
The unemployment rates in both Midland and Odessa were slightly lower in March compared with December 2025 (Chart 4). Midland’s unemployment rate decreased to 3.1 percent in March from 3.2 percent in December, while Odessa’s jobless rate decreased to 3.7 percent from 3.8 percent over the same period. Meanwhile, Texas’ unemployment rate remained constant at 4.3 percent.
Housing
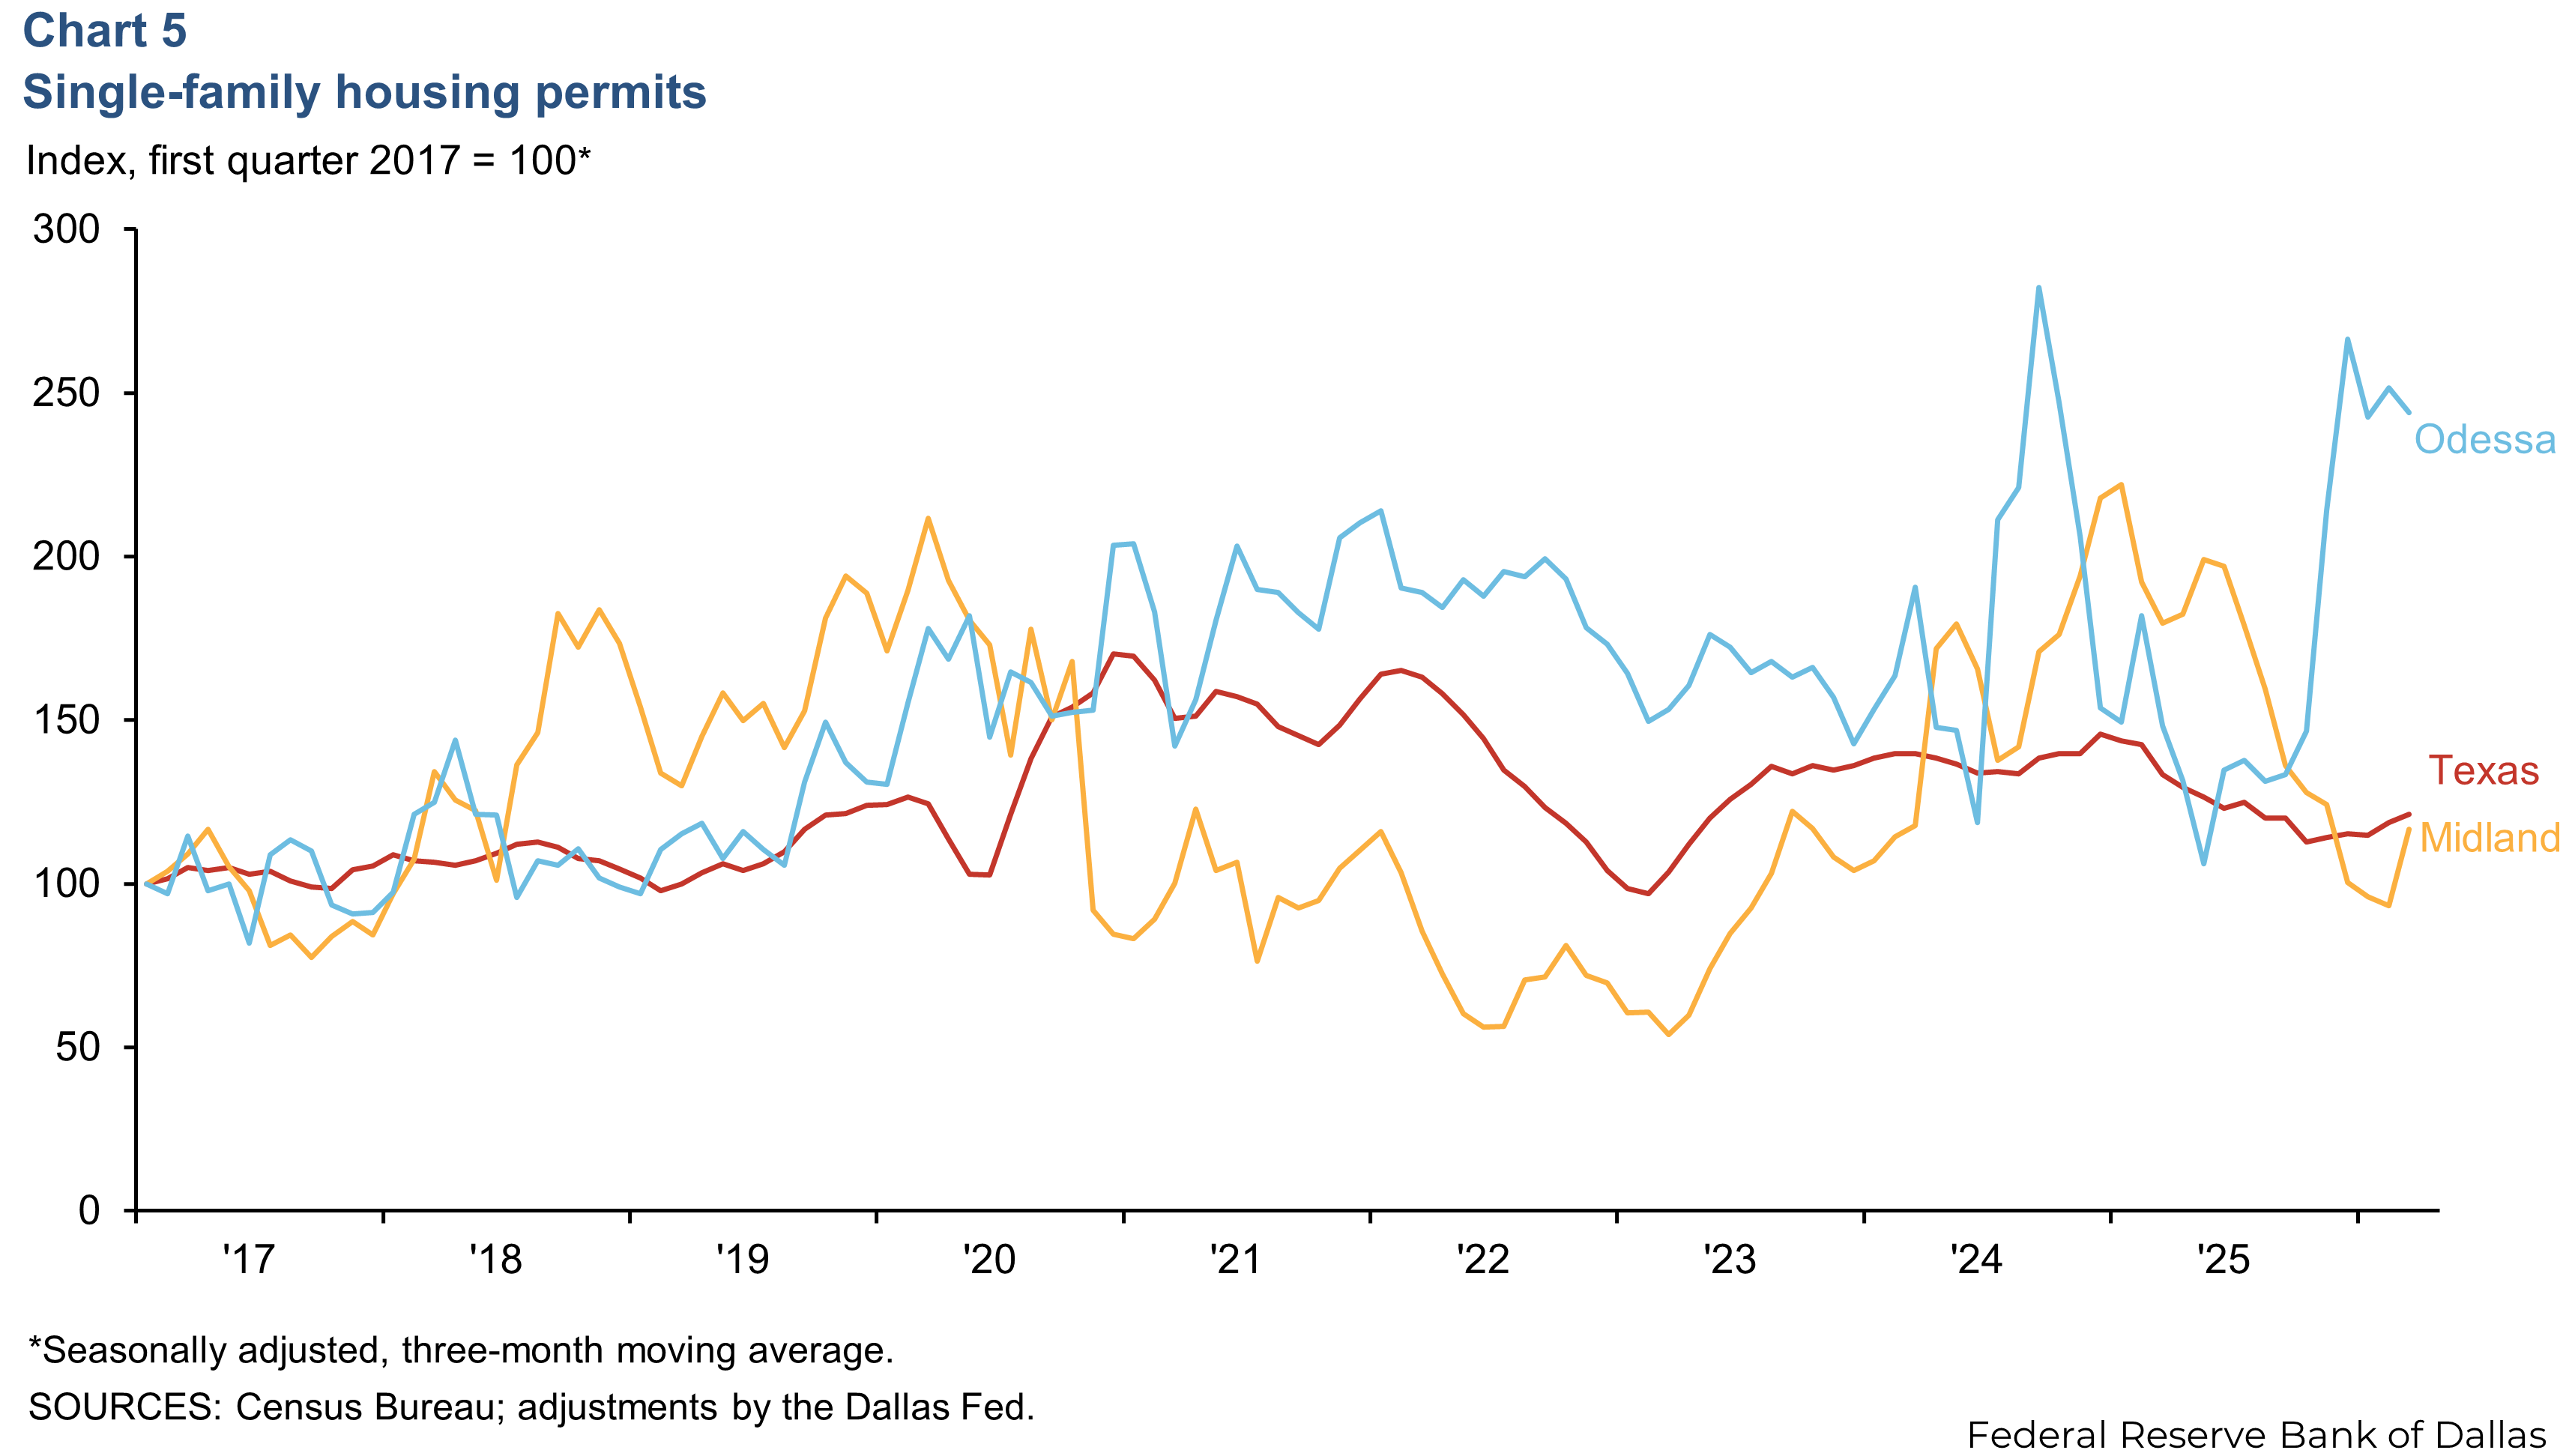
Single-family housing permits increase slightly
Single-family housing permits in Midland increased in first quarter 2026 compared with the fourth quarter of 2025, but decreased in Odessa (Chart 5). Single-family housing permits in Midland were up 16.2 percent in March compared with December, but down 8.4 percent in Odessa. Single-family housing permits in the region overall were up 0.6 percent. Texas single-family housing permits increased by 5.1 percent over the same period.
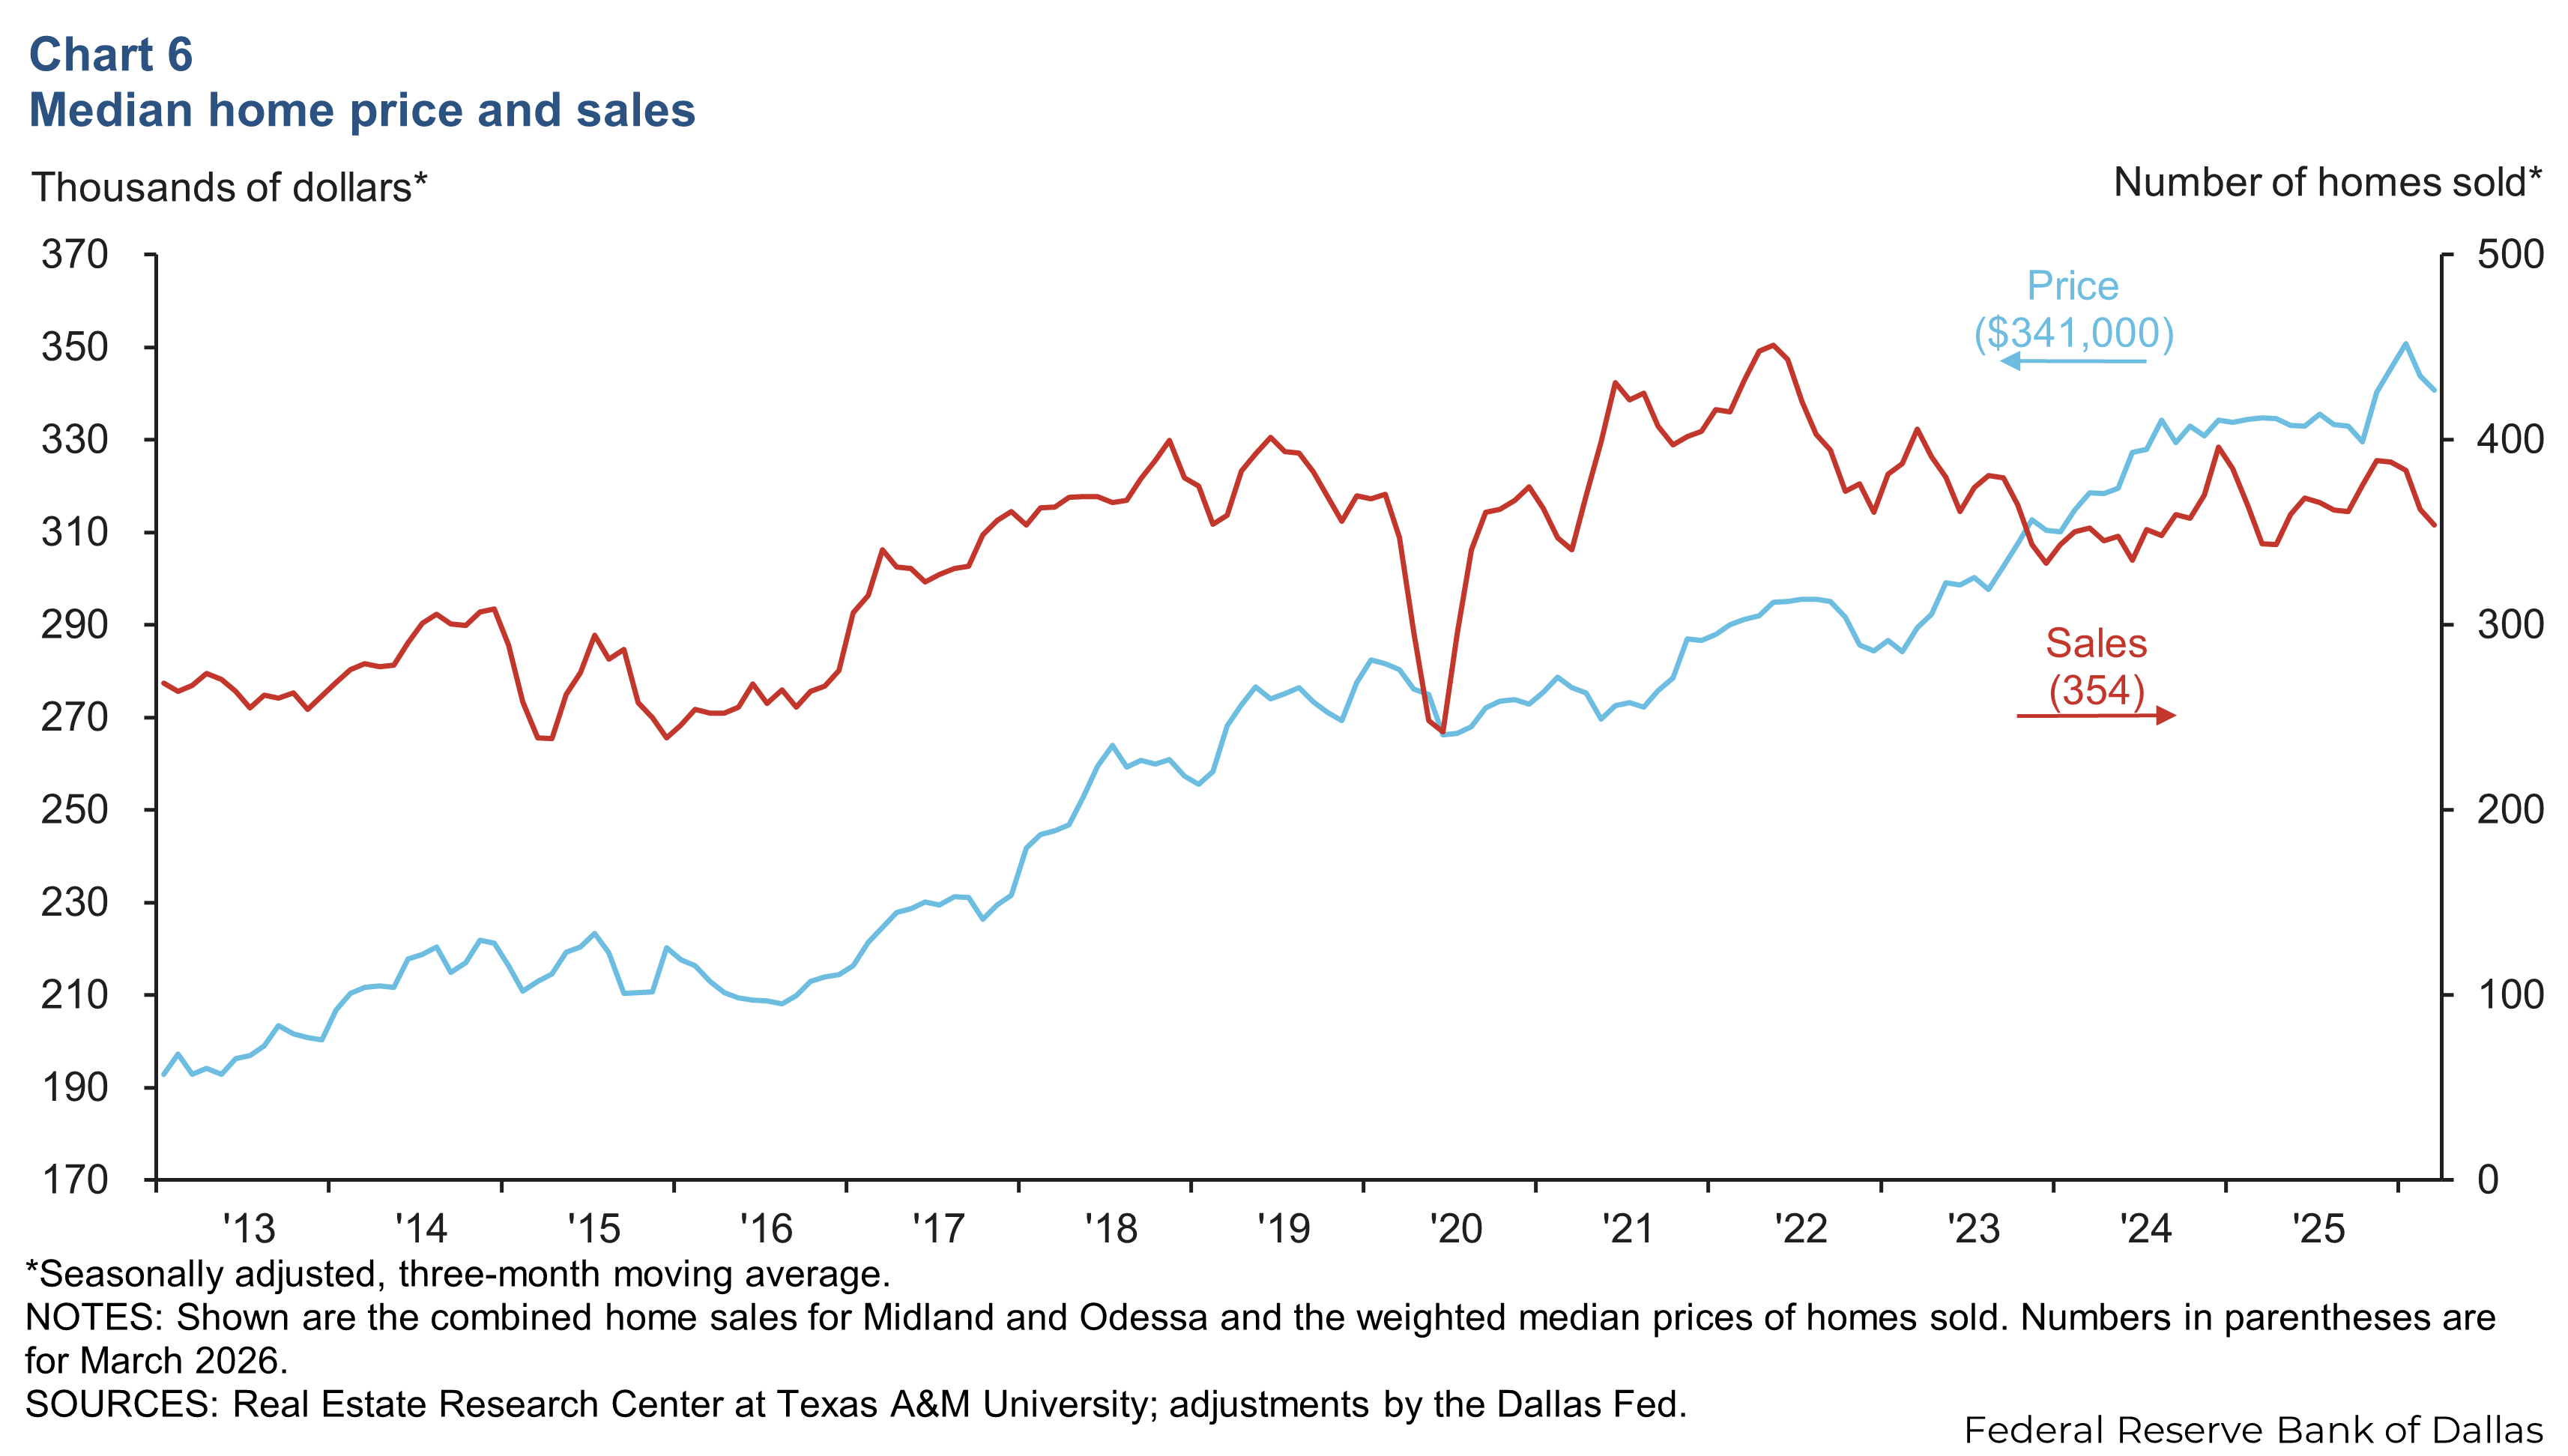
Home sales and prices fall
Home sales in the Permian Basin were down 8.7 percent in March compared with December (Chart 6). However, home sales in the region were up 3 percent on a year-over-year basis. The median home sales price decreased 1.4 percent from December to March but was up 1.8 percent compared with year-ago levels. The median home sales price in the Permian Basin was $341,000 in March, 1.9 percent higher than the state figure.
NOTES: Employment data are for the Midland and Odessa metropolitan statistical areas (Martin, Midland and Ector counties), unless otherwise specified. Energy data include the 55 counties in West Texas and southern New Mexico that make up the Permian Basin region. Data may not match previously published numbers due to revisions.
About Permian Basin Economic Indicators
Questions or suggestions can be addressed to Adefemi Abimbola. Permian Basin Economic Indicators is released quarterly.