Rio Grande Valley Economic Indicators

| Rio Grande Valley economy dashboard (March 2025) | ||||
| Job growth (annualized) Dec. '24–March'25 |
Unemployment rate |
Avg. hourly earnings |
Avg. hourly earnings growth y/y |
|
| Rio Grande Valley | 2.8% | 6.1% | $21.06 | 1.5% |
| Brownsville | 1.8% | 6.2% | $21.28 | 12.0% |
| McAllen | 3.4% | 6.1% | $20.95 | -3.0% |
The Rio Grande Valley saw strong employment growth in the first quarter. Unemployment rose, and year-over-year wage changes were mixed. Cross-border trade fell off. Water storage in Rio Grande Valley reservoirs remained well below historical levels and was little changed in early May.
Labor market
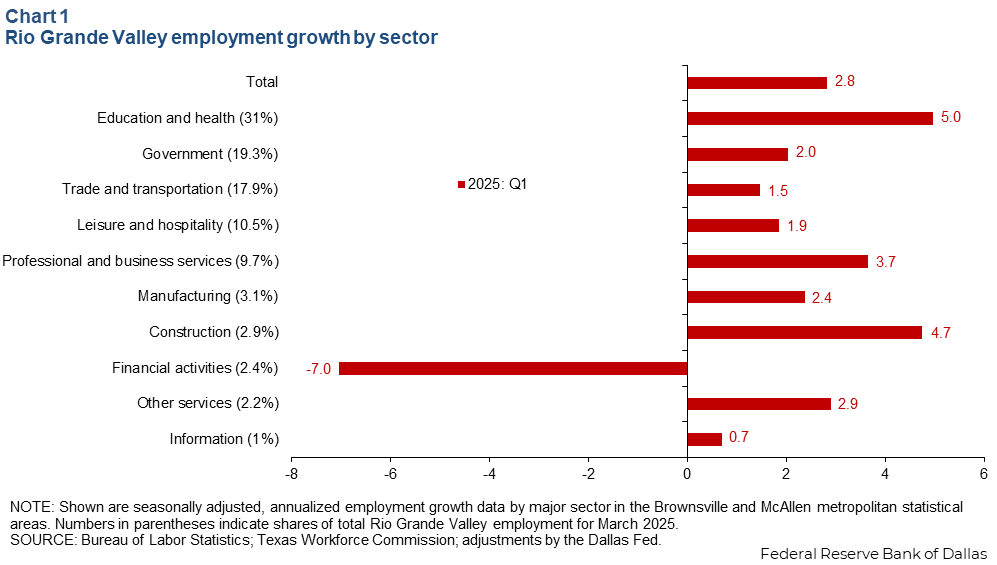
Employment growth strong
Rio Grande Valley jobs increased an annualized 2.8 percent in the first quarter (3,200 jobs), faster than Texas (1.9 percent) and the U.S. (1.0 percent) (Chart 1). Growth was led by education and health (1,700 jobs, or 5.0 percent), government (450 jobs, or 2.0 percent), professional and business services (400 jobs, or 3.7 percent) and construction sectors (160 jobs, or 4.7 percent), while only financial activities (-200 jobs, or -7.0 percent) posted a decline.
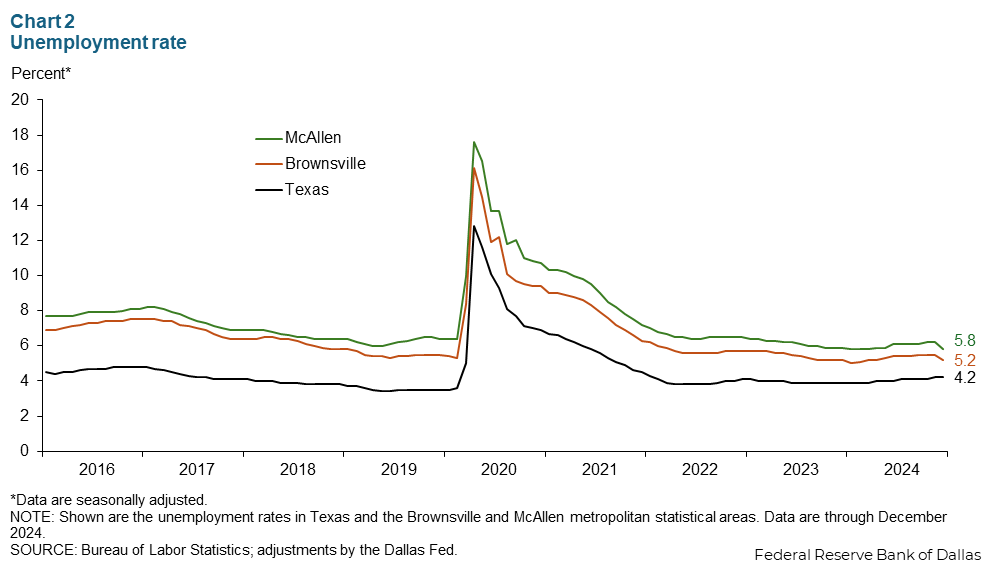
Unemployment jumps
In March, the unemployment rate rose to 6.1 percent in McAllen and jumped to 6.2 percent in Brownsville (Chart 2). Unemployment rates in both metro areas were higher than the jobless rates of 4.2 percent in Texas and 4.1 percent in the U.S., but the gap has narrowed since the pandemic.
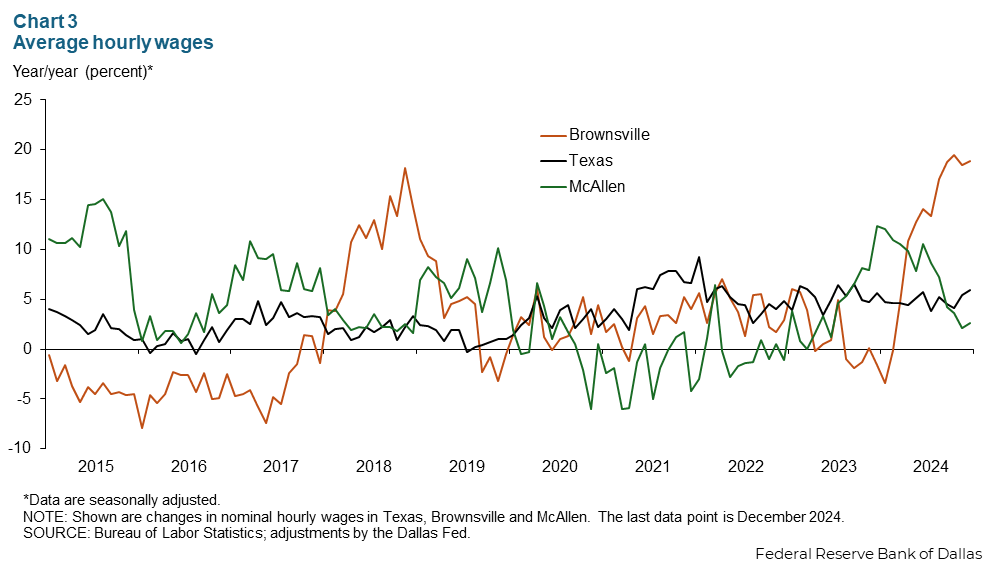
Wage growth mixed
Private sector hourly wages in Brownsville continued to rise steeply, up 12.0 percent year over year in March, though the pace of growth appears to be decelerating (Chart 3). Wages in McAllen fell 3.0 percent year over year, and wages rose 5.7 percent in Texas.
Water availability
Farmers and households alike in the Valley depend on river water. Water levels in Rio Grande Valley reservoirs were at 21.4 percent of storage capacity in early May, still 53 percentage points below their historical average (Chart 4). Multiple factors have contributed to the low storage volume, including drought, slower upstream flows into the Rio Grande’s top reservoir and delays in Mexico’s treaty-established schedule for water deliveries to the U.S. Importantly, deficits in Mexico’s delivery to the U.S. cause shortages in Mexican territories further down the Rio Grande.
Water contributions data can be used to calculate how far behind Mexico is on water deliveries. The red line shows that if Mexico had been on track to deliver enough water to fulfill the treaty, the water reservoir would be around 50 percent full.
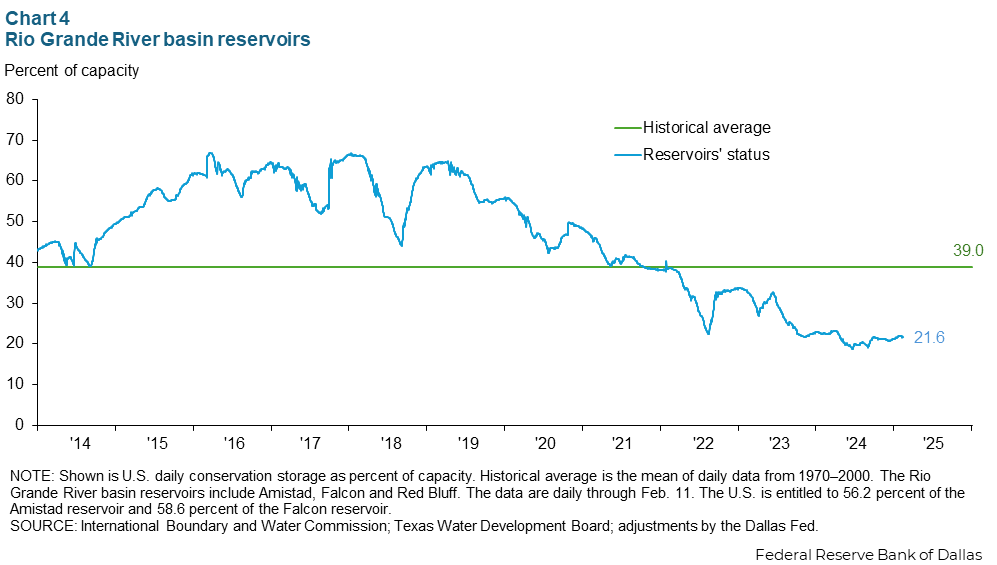
Mexico and the U.S. recently came to an agreement for Mexico to deliver more water to the U.S. this year. It remains unclear if Mexico has enough water to make these deliveries by October. In past cases of expedited deliveries, the Mexican government has faced protests.
Border activity
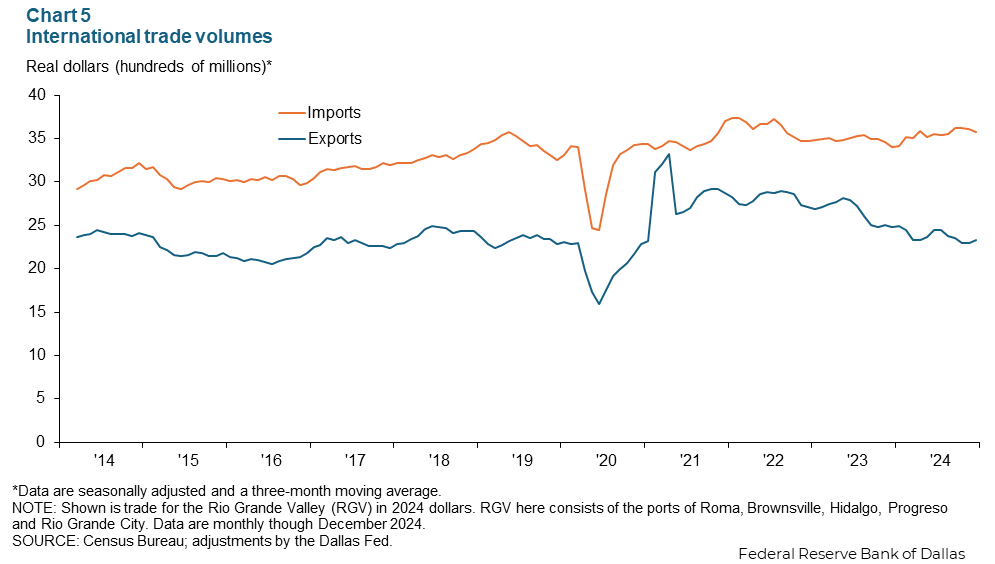
The movement of goods and people across the border in the Rio Grande Valley fell considerably in the first quarter of 2025. In March, conveyances were down 14.7 percent year over year, and travelers declined 14.6 percent (Chart 5). It is likely that trade uncertainty is weighing on businesses in the region.
NOTES: Employment data are for the McAllen–Edinburg–Mission and Brownsville–Harlingen metropolitan statistical areas (Cameron and Hidalgo counties), unless otherwise specified. Data may not match previously published numbers due to revisions.
About Rio Grande Valley Economic Indicators
Questions or suggestions can be addressed to Ethan Dixon at Ethan.Dixon@dal.frb.org. Rio Grande Valley Indicators is published quarterly.