Rio Grande Valley Economic Indicators

| Rio Grande Valley economy dashboard (March 2026) | ||||
| Job growth (annualized) Dec. ’25–Mar. ’26 |
Unemployment rate |
Avg. hourly earnings |
Avg. hourly earnings growth y/y |
|
| Rio Grande Valley | 1.4% | 6.3% | $22.33 | 6.3% |
| Brownsville | 1.5% | 6.6% | $22.15 | 4.3% |
| McAllen | 1.3% | 6.2% | $22.41 | 7.3% |
Employment increased in the Rio Grande Valley, while joblessness fell in the first quarter. Year-over-year wages were up in both metros. Water storage in Rio Grande Valley reservoirs was little changed and remained well below historical levels. Cross-border trade and travel ticked up, but encounters at the southern border have remained consistently low since the start of 2025.
Labor market
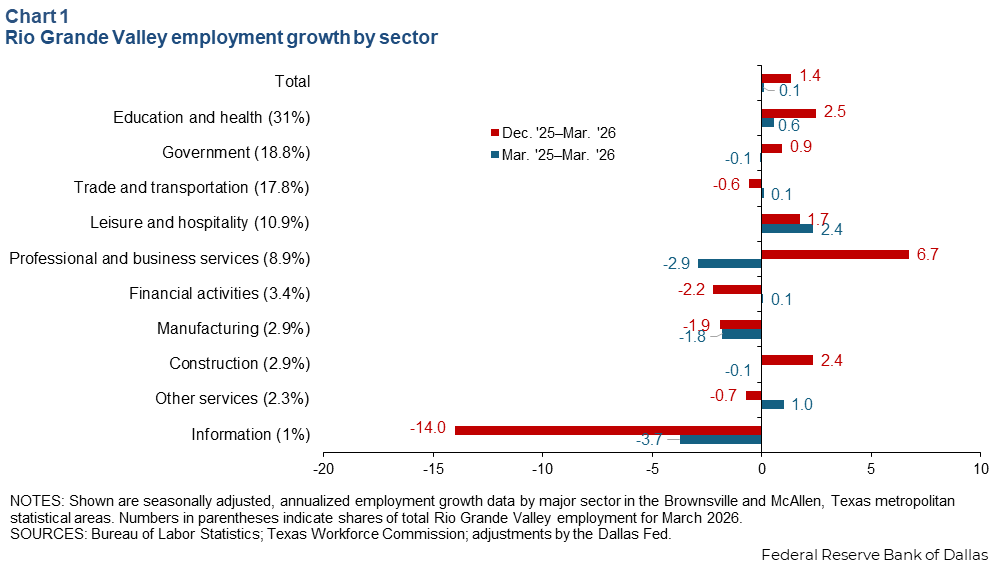
Employment rises modestly
Rio Grande Valley employment increased an annualized 1.4 percent from December to March (1,600 jobs), slower than Texas (1.7 percent), but faster than the U.S. (0.5 percent). Job growth was mixed, led by professional and business services (700 jobs, 6.7 percent), and education and health (900 jobs, 2.5 percent) (Chart 1). Employment contracted in a few sectors, with the largest decline seen in information (–200 jobs, –14.0 percent).
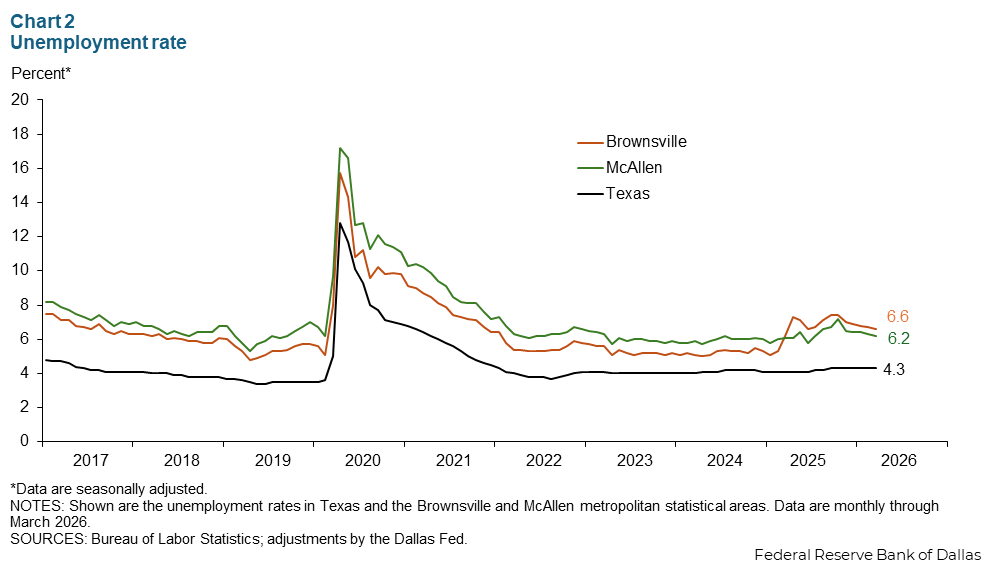
Unemployment falls, but still elevated
In March, unemployment remained elevated in both metro areas: 6.6 percent in Brownsville and 6.2 percent in McAllen (Chart 2). Unemployment in both metros exceeded the jobless rates of 4.3 percent in Texas and 4.3 percent in the U.S. The unemployment rate in Brownsville remains higher than in McAllen, continuing to buck a historical trend. In both metros, the rate fell slightly in the first quarter.
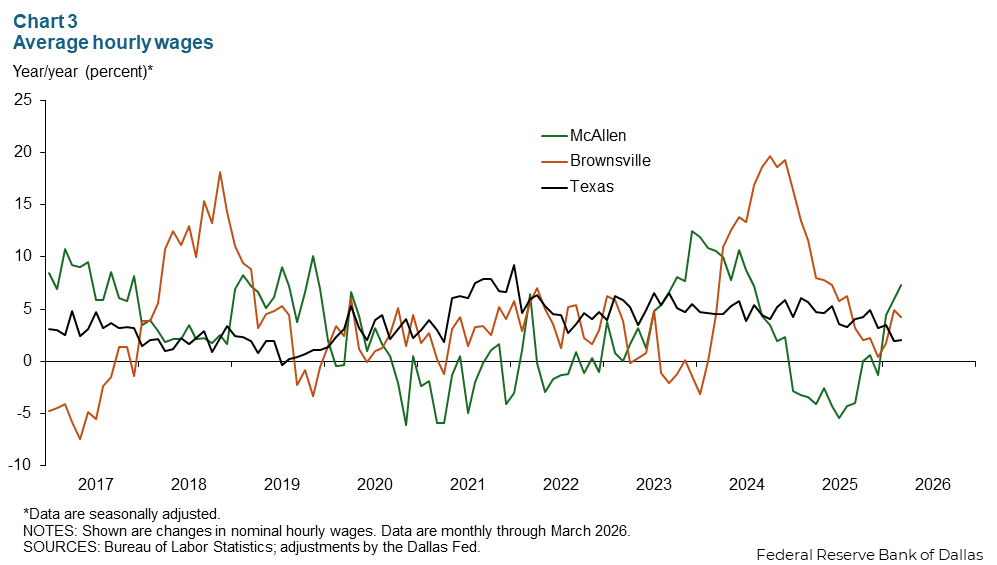
Wages rebound
Private sector hourly wage growth accelerated in Brownsville, up 4.3 percent year over year in March (Chart 3). Wages in McAllen increased 7.3 percent in March from year-earlier levels, while wages in Texas rose 2.1 percent.
Water availability
Farmers and households in the Valley depend on river water. Water levels in Rio Grande Valley reservoirs were at 27.3 percent of storage capacity in early May, remaining 32.3 percentage points below the historical average (Chart 4). In the five-year delivery cycle that ended Oct. 24, 2025, Mexico failed to deliver its treaty-obligated amount by about 800,000 acre-feet.
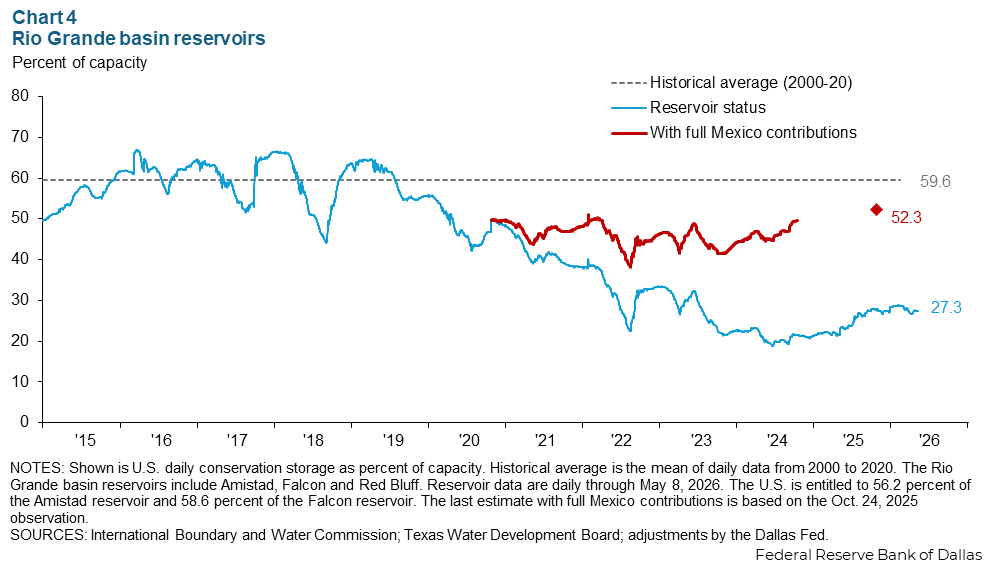
As of Jan. 31, 2026, Mexico had not delivered on promises under a 2025 agreement. McAllen is investing $185 million in other water sources like desalination. Middle Rio Grande water managers are warning of unusually low water levels, partly because of low snowpack runoff.
Border activity
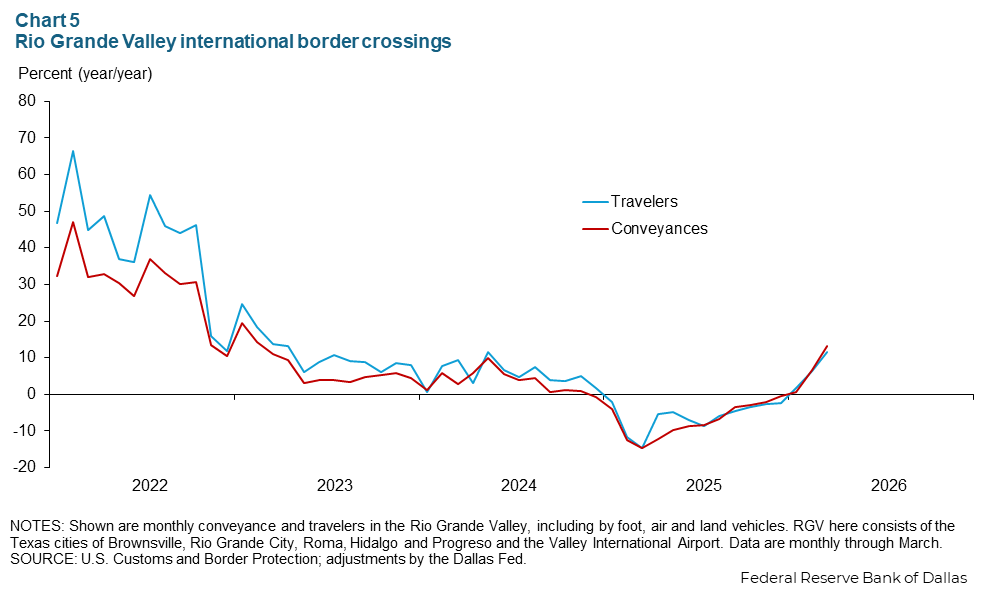
The movement of goods and people across the border in the Rio Grande Valley increased in first quarter 2026 relative to a new, lower baseline. Conveyances were up 13.3 percent year over year, and the volume of travelers rose 11.7 percent in March (Chart 5). Trade uncertainty and tighter immigration policies likely continue to affect cross-border trade and travel.
Immigration cools
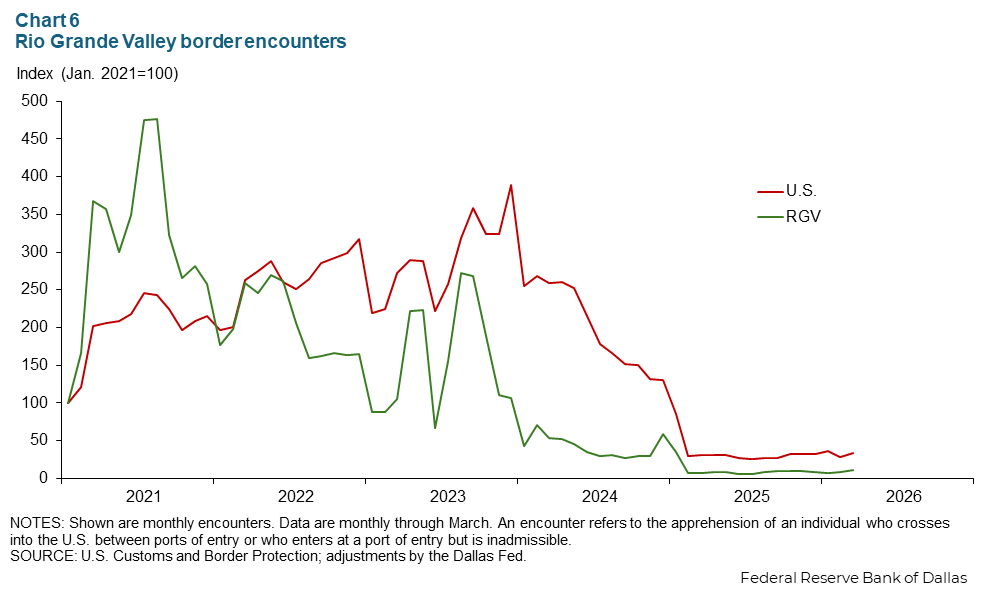
Border Patrol encounters in the Rio Grande Valley sector fell notably to near zero at the beginning of 2025 and have remained at that level since then (Chart 6). Overall encounters outside of the Rio Grande Valley remain low as well. An encounter refers to apprehension of individuals who cross into the U.S. between ports of entry, or who enter at a port of entry but are inadmissible.
NOTE: Data may not match previously published numbers due to revisions.
About Rio Grande Valley Economic Indicators
Questions or suggestions can be addressed to Ethan Dixon. Rio Grande Valley Economic Indicators is released quarterly.