San Antonio Economic Indicators

Growth in the San Antonio economy held steady in May. The San Antonio Business-Cycle Index continued to expand, though below its long-term average, as the unemployment rate fell but job growth remained tepid. The average hourly wage picked up after dipping at the end of last year. The San Antonio housing market remains tight, and the median house price has dipped only slightly from an all-time high.
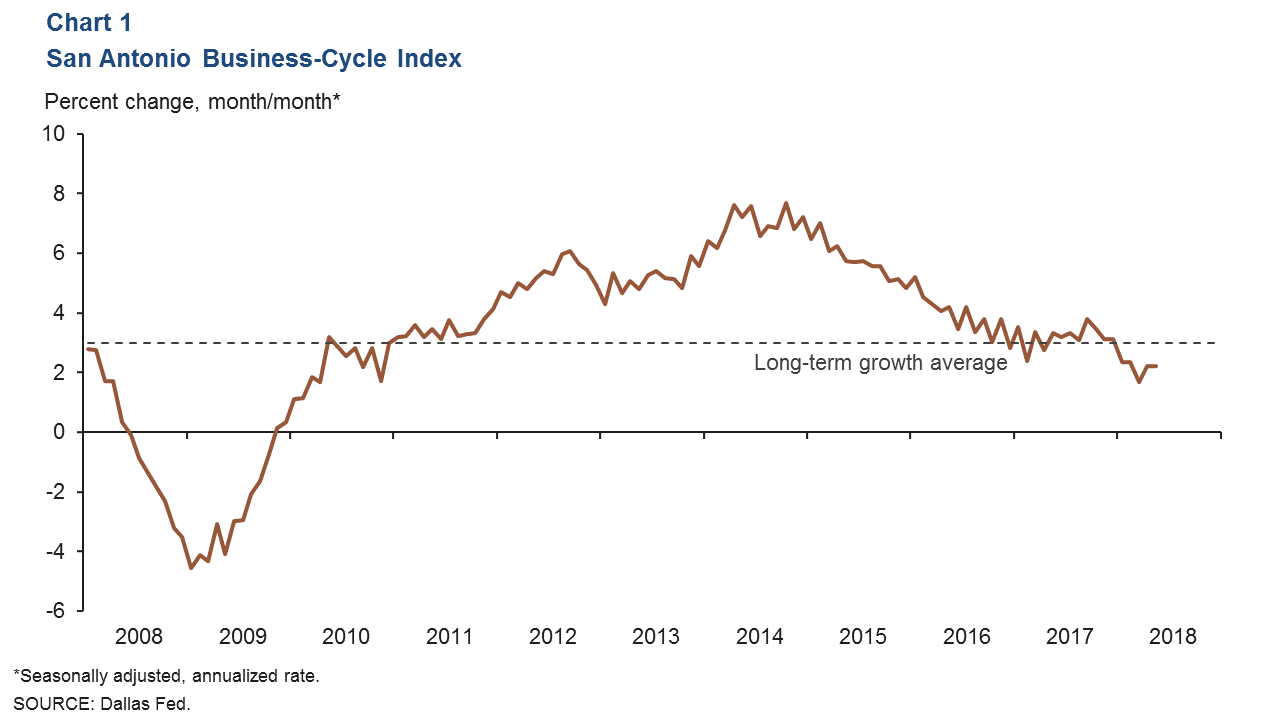
Business-Cycle Index
The San Antonio Business-Cycle Index expanded at a 2.2 percent annualized rate in May, similar to that of April (Chart 1). Payroll jobs were flat in May and so far this year are up just 0.5 percent, contributing to the overall weakness in the index relative to 2017.
Labor Market
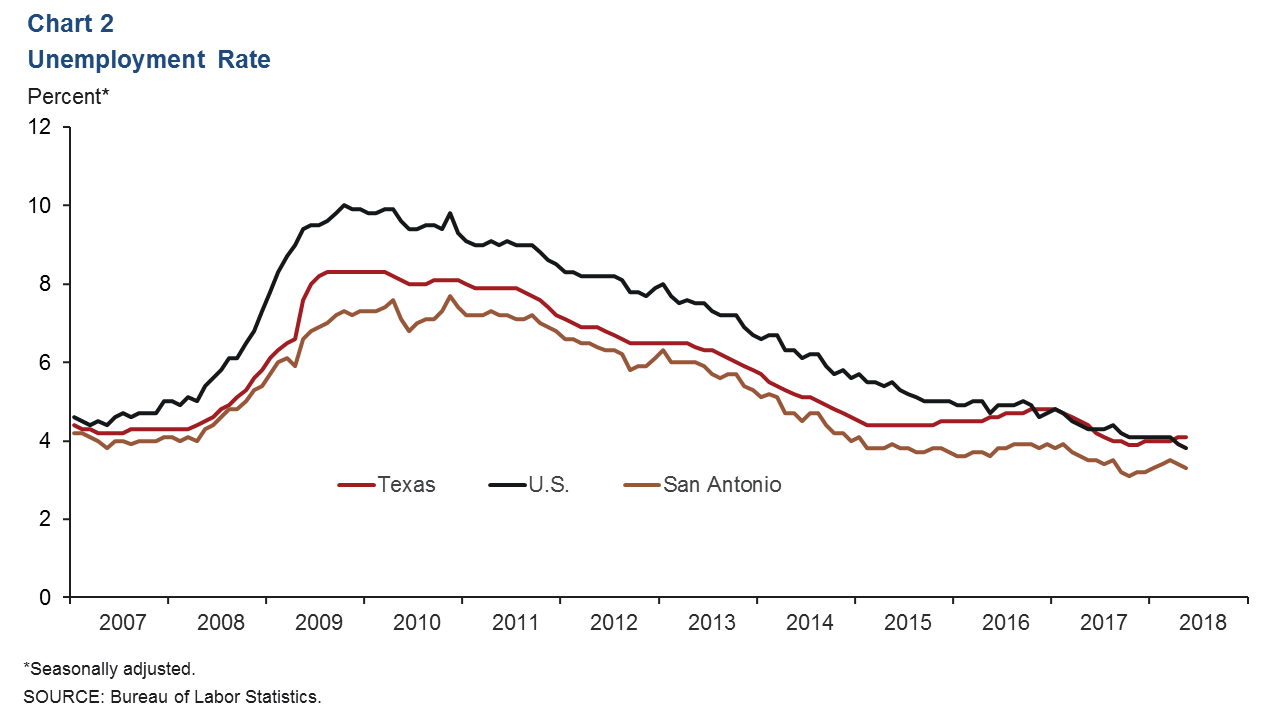
Unemployment Rate Remains Below State Average
The San Antonio unemployment rate decreased to 3.3 percent in May from 3.4 percent in April (Chart 2). Meanwhile, the Texas rate held at 4.1 percent, and the U.S. rate fell to an 18-year low of 3.8 percent. Labor force growth is an annualized 2.2 percent year to date, below the state’s 3.5 percent increase.
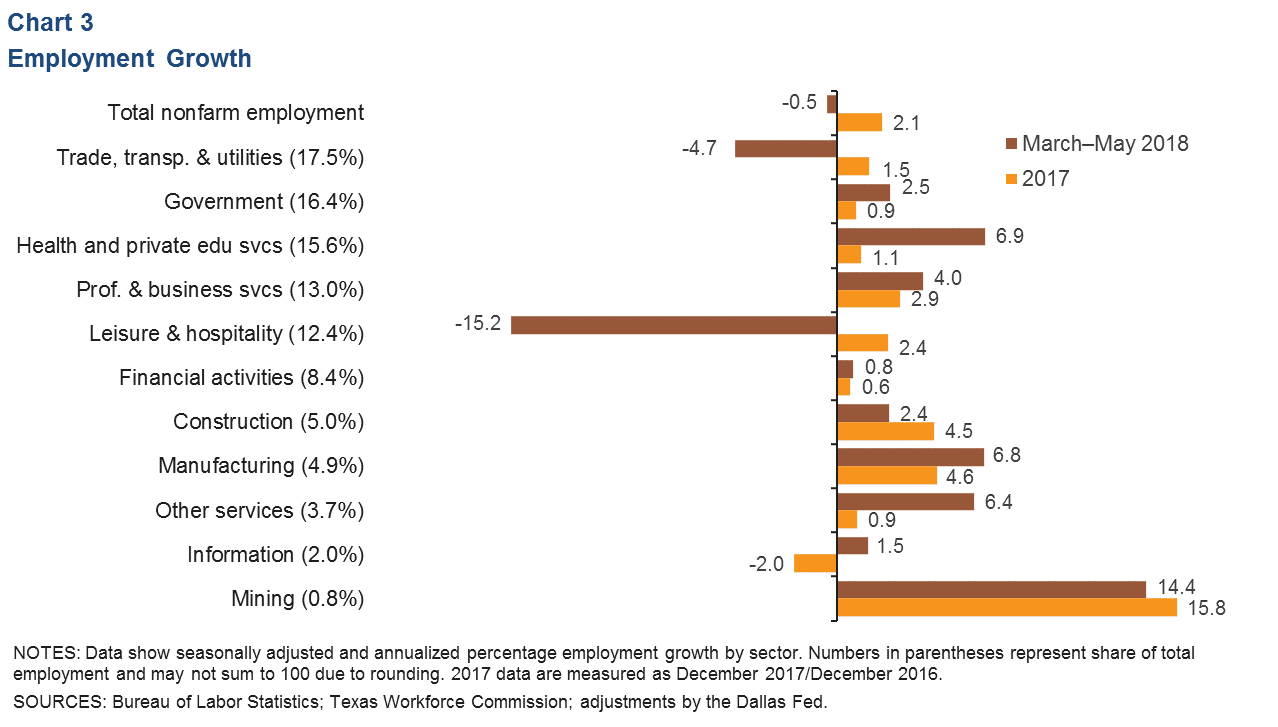
Job Growth Soft Through May
San Antonio jobs fell at a 0.5 percent annualized rate over the three months through May (Chart 3). Goods-producing industries continued to grow at a robust rate, and mining and manufacturing in particular saw employment expansion well above their long-term averages. Health care saw a significant acceleration due to a surge in hiring for ambulatory health care services, while a pickup in administrative services positions bolstered the professional and business services sector. Leisure and hospitality employment plummeted, although food services jobs were largely flat. Wholesale and retail trade also saw significant declines, dragging on trade, transportation and utilities employment.
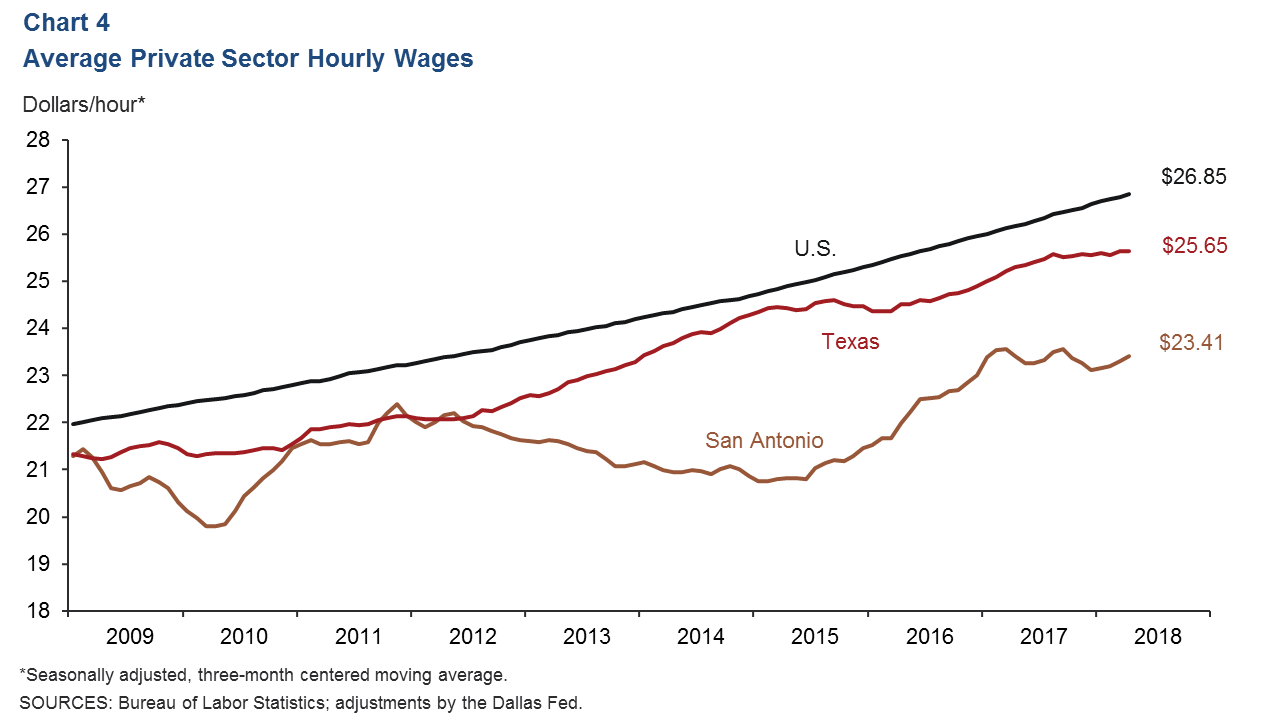
Wages Ticking Up
Private sector average hourly earnings in San Antonio ticked up in May as the three-month moving average rose to $23.41 from a recent low of $23.11 at the end of 2017 (Chart 4). Year to date, wages have risen at an annualized 2.8 percent pace, compared with just 2.5 percent for the U.S. and almost no change for Texas.
Real Estate
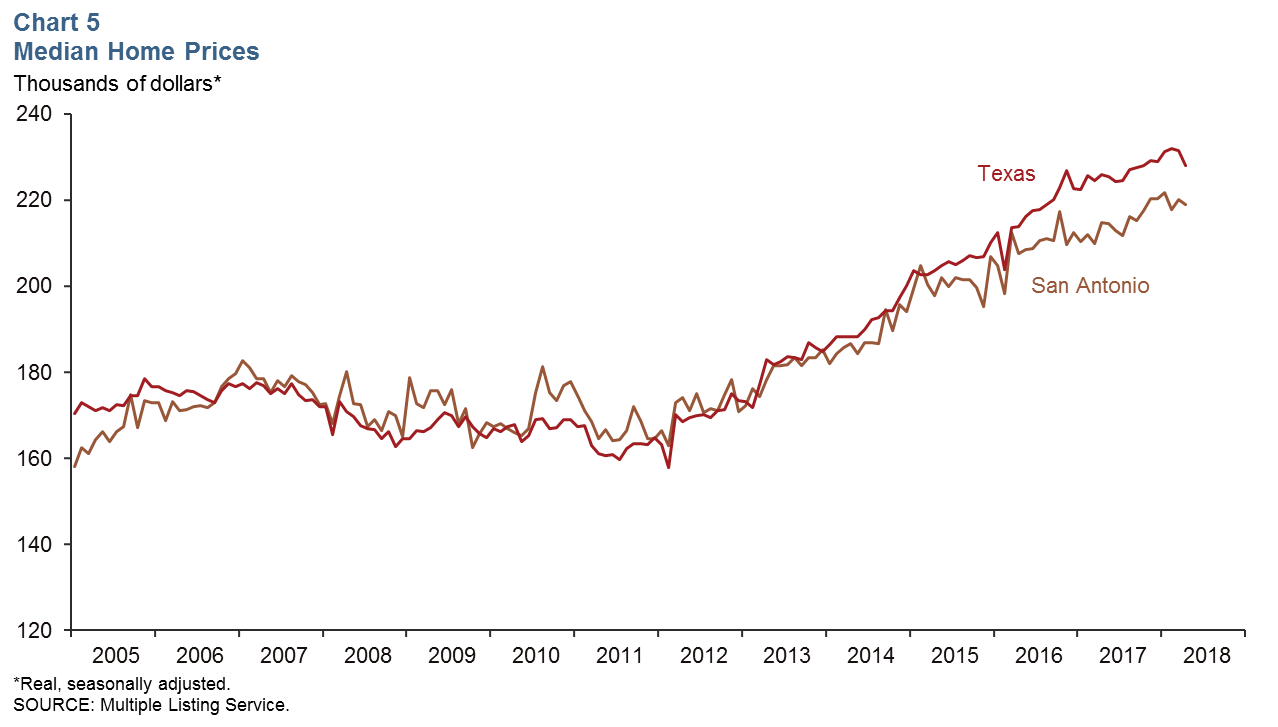
The median home price in San Antonio dipped slightly in April to $218,865 (Chart 5). Year over year, the area median price increased 1.9 percent, nearly double the 1.0 percent increase for Texas overall. Home inventories fell to a tight 3.2 months’ supply, while existing-home sales reached yet another all-time high, suggesting that new-home demand remains strong in San Antonio.
Stock Prices
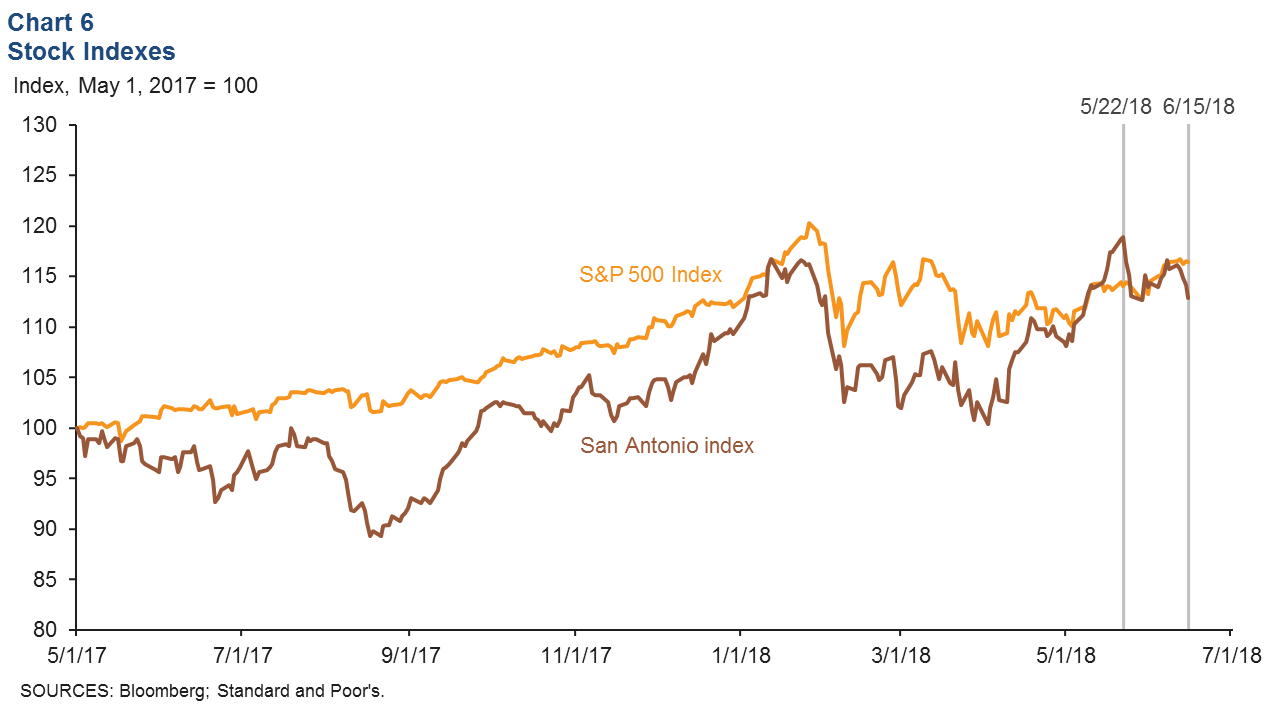
Stock prices of companies with a significant presence in San Antonio slipped 5.1 percent from May 22 to June 15, compared with a 2 percent rise in the S&P 500 over that time (Chart 6). Declines were concentrated in energy stocks, particularly in production and refining firms. Finance, manufacturing and communications firms’ stock prices were mixed, while food services and retail companies saw moderate gains.
NOTE: Data may not match previously published numbers due to revisions.
About San Antonio Economic Indicators
Questions can be addressed to Christopher Slijk at christopher.slijk@dal.frb.org. San Antonio Economic Indicators is published every month on the Thursday after state and metro employment data are released.