San Antonio Economic Indicators

Growth in the San Antonio economy remained mild in August. The San Antonio Business-Cycle Index decelerated, holding below its long-term average. The unemployment rate increased slightly, while job growth remained slow. Home prices increased. Newly released data on gross domestic product (GDP) for 2017 indicate that San Antonio grew at a healthy pace.
Business-Cycle Index
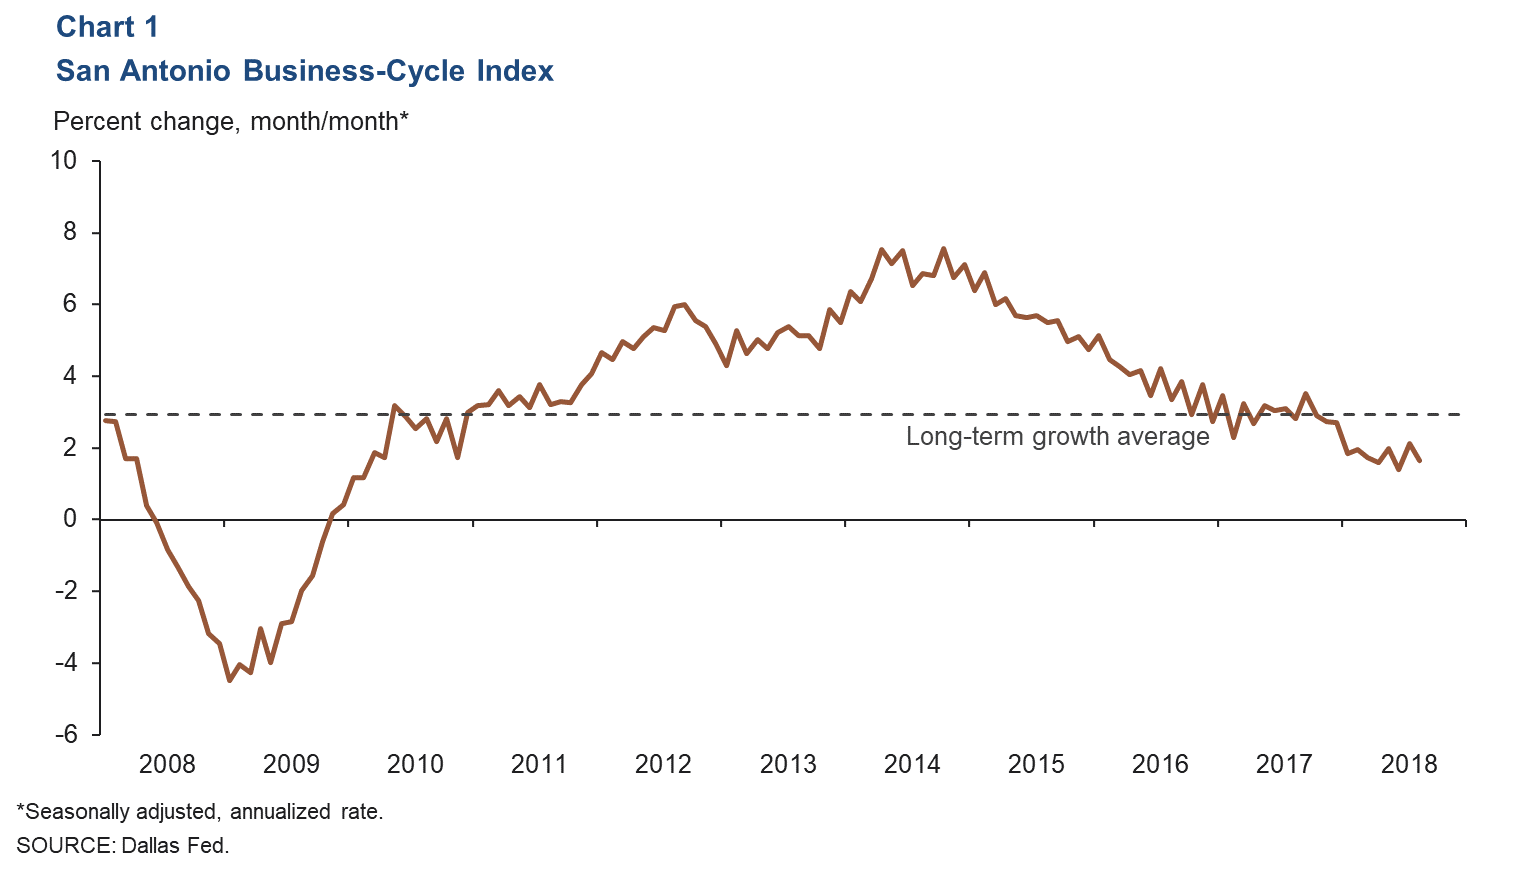
The San Antonio Business-Cycle Index expanded at a 1.7 percent annualized rate in August, down from July’s 2.1 percent and still below its long-term average of 2.9 percent (Chart 1). Jobs grew at a weak 0.4 percent pace year to date through August, and the unemployment rate increased slightly.
Labor Market
Unemployment Rate Remains Below State Average
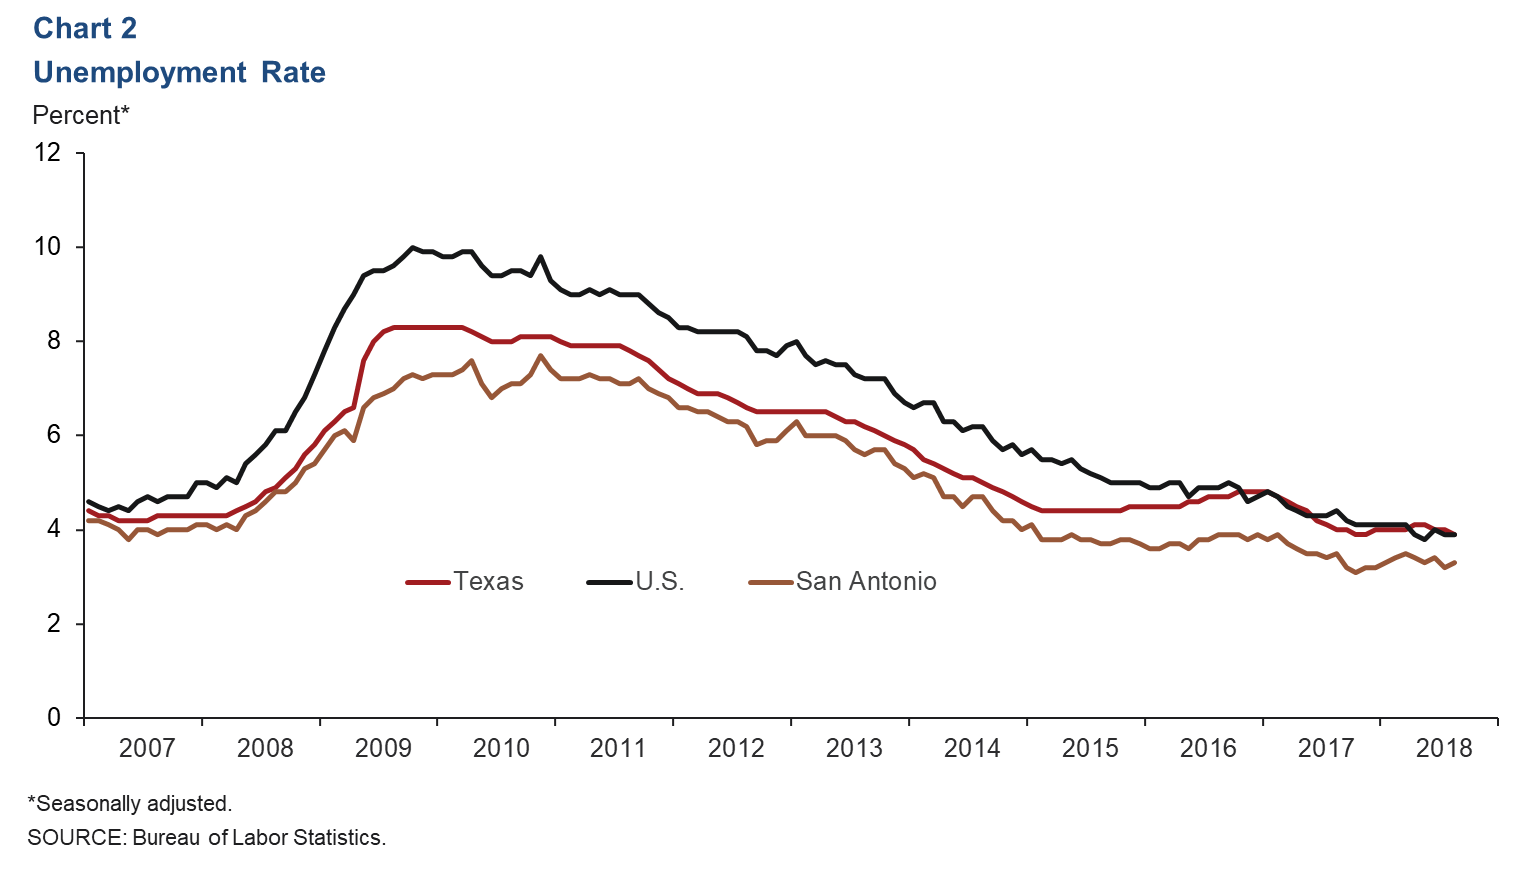
The San Antonio unemployment rate increased slightly to 3.3 percent in August from 3.2 percent in July (Chart 2). This was significantly below the Texas and U.S. rates, which were both at 3.9 percent. The San Antonio labor force has grown an annualized 0.4 percent over the first eight months of the year, compared with 2.6 percent for the state and 1.1 percent nationally.
Job Growth Minimal
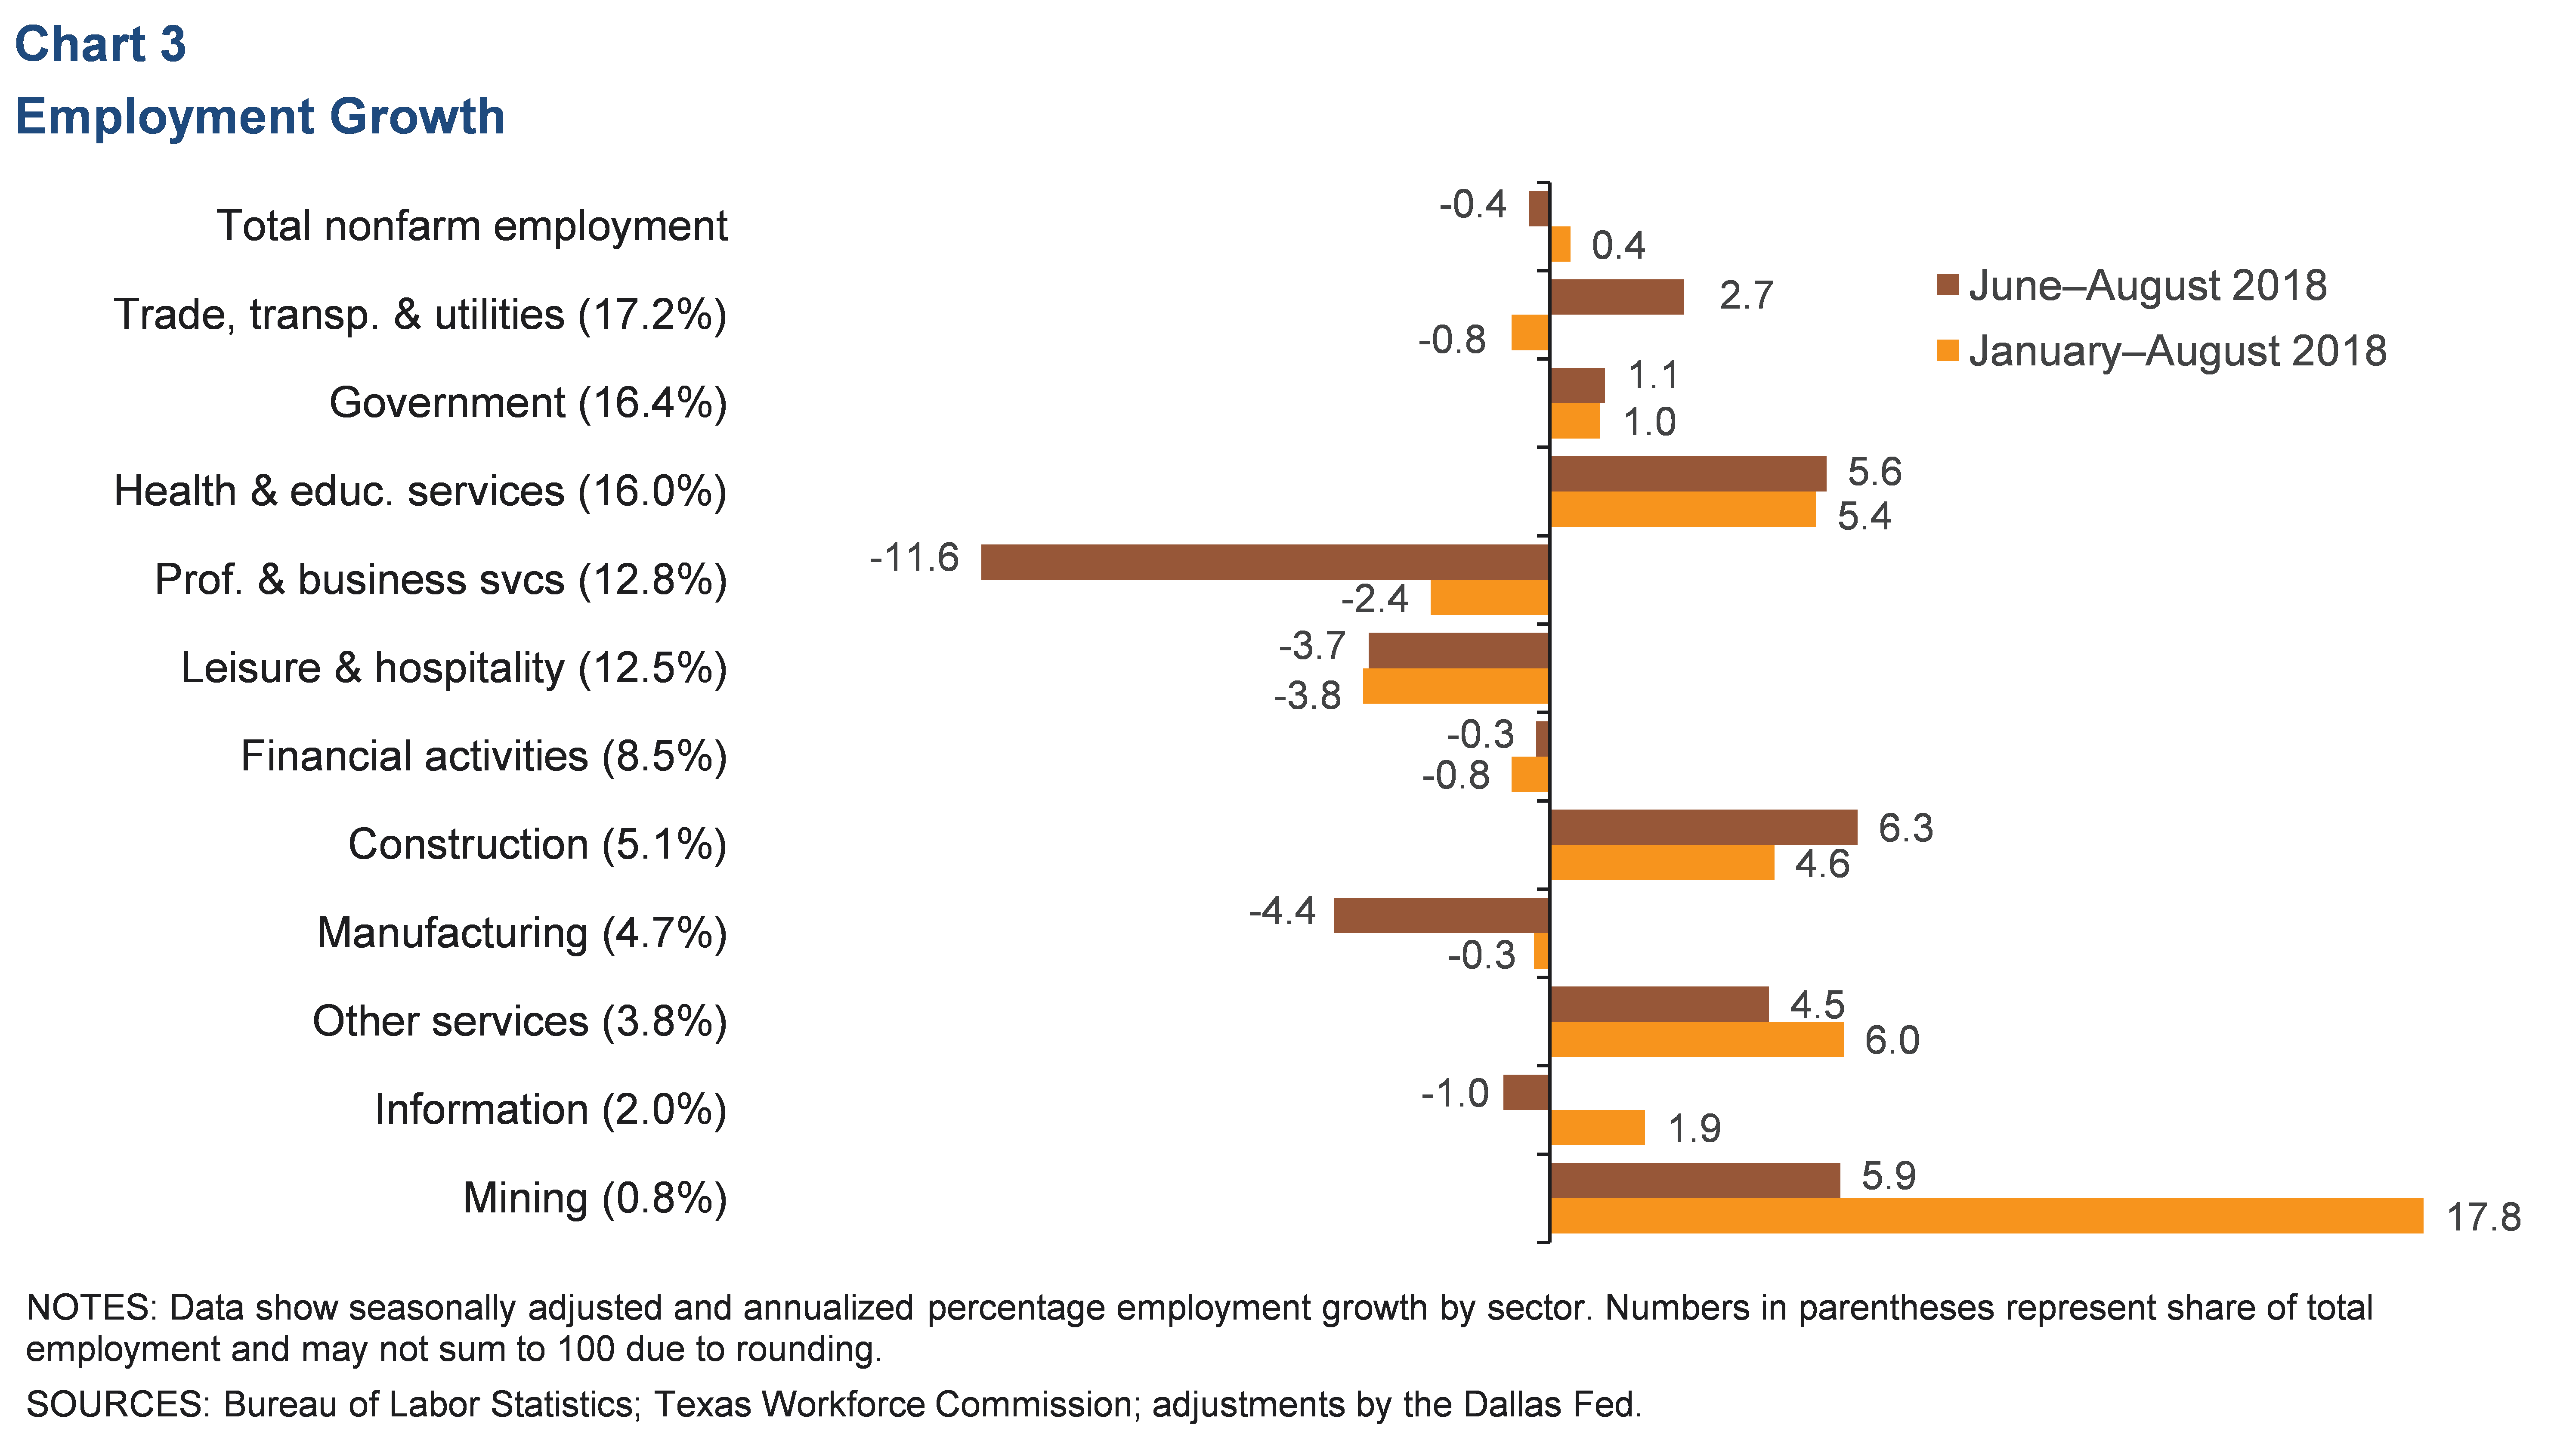
San Antonio jobs declined at a 0.4 percent annualized rate from June to August, with year-to-date growth at a sluggish 0.4 percent (Chart 3). The construction sector was the fastest-growing industry over the three-month period, adding 800 net new jobs. Mining and health care followed closely behind, although ambulatory health care services saw a decline. Professional and business services jobs declined sharply, with administrative services plummeting nearly 20 percent. Leisure and hospitality continued to shed jobs, while manufacturing saw a notable decline after growth earlier in the year.
Real Estate
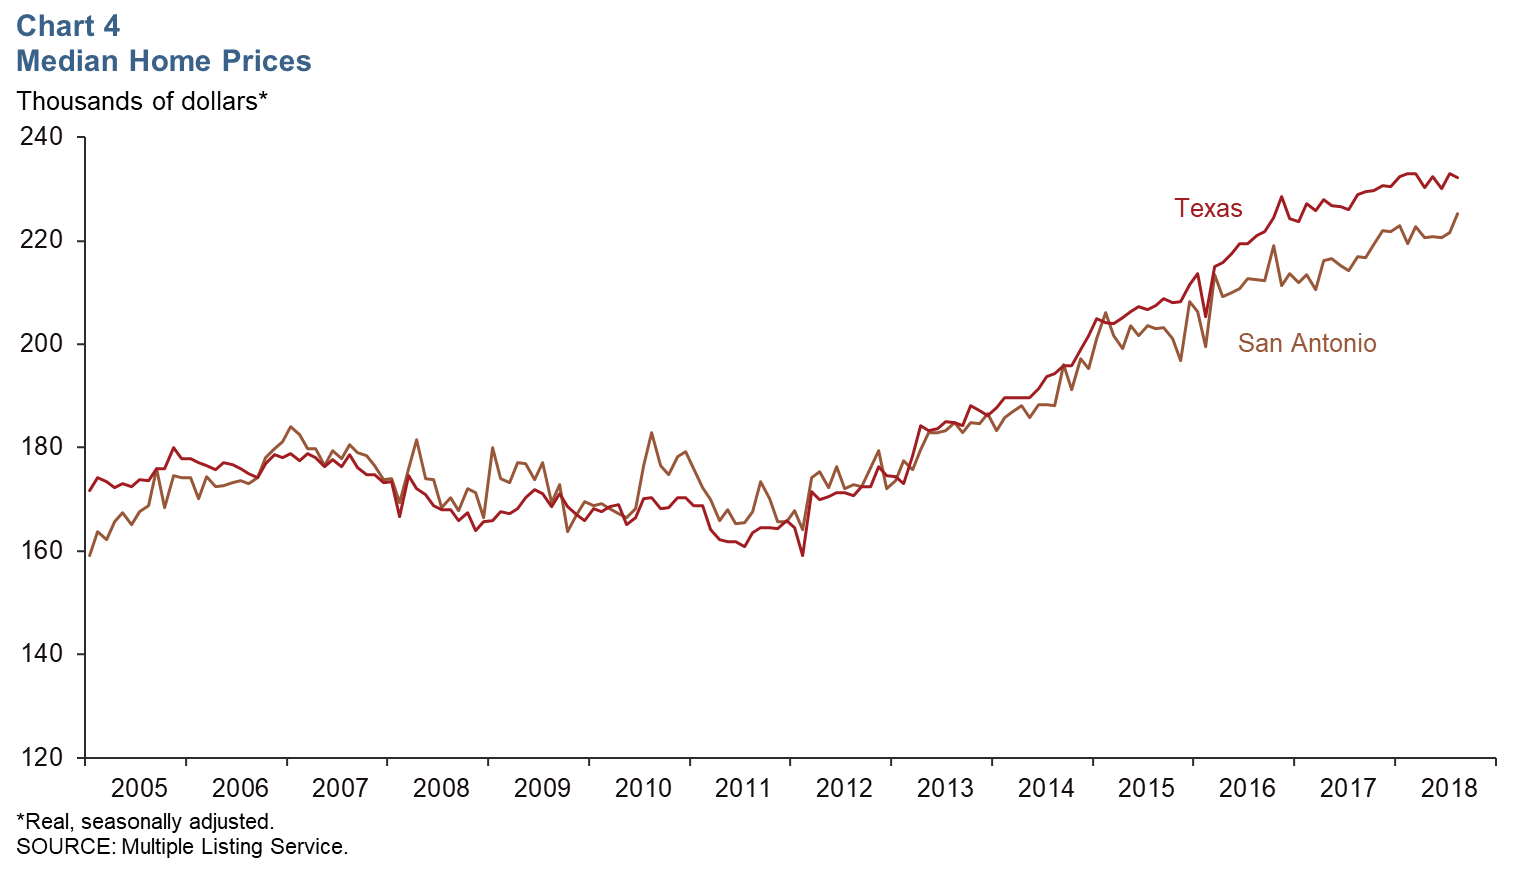
The median home price in San Antonio increased in August to $225,318 (Chart 4). Year over year, the area median price increased 3.8 percent, more than double the 1.4 percent increase for Texas overall. Home inventories were flat at 3.3 months’ supply, well below the six months considered a balanced market.
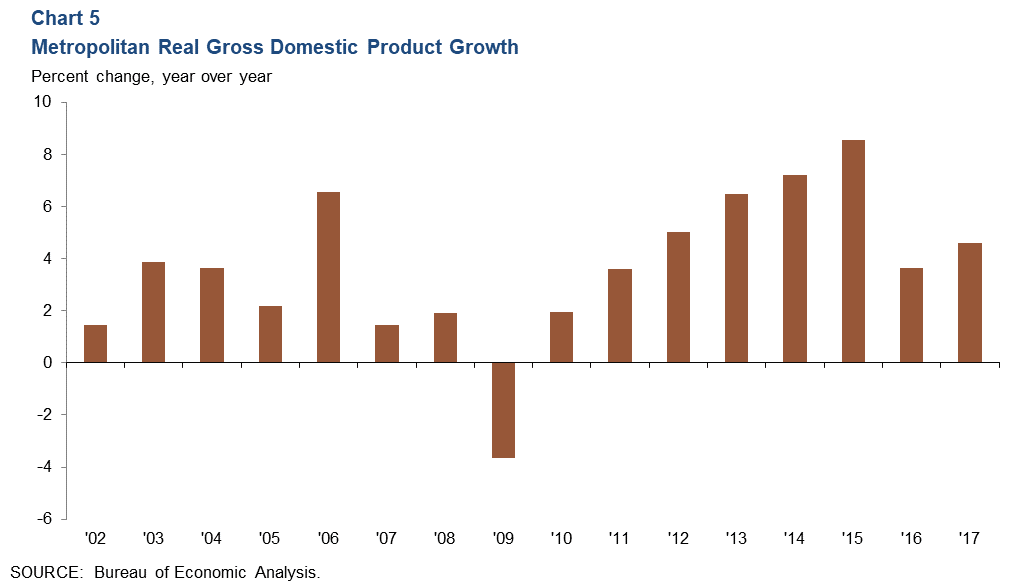
Real Gross Domestic Product
San Antonio inflation-adjusted GDP grew at a healthy 4.6 percent in 2017, above 2016’s rate and higher than the area’s long-term average of 3.7 percent (Chart 5). This is significantly faster than the 2.6 percent growth rate of the state as a whole. San Antonio’s growth was led by manufacturing, real estate, and professional and business services. Conversely, government and construction saw declines, while finance and information services both grew at a weak pace.
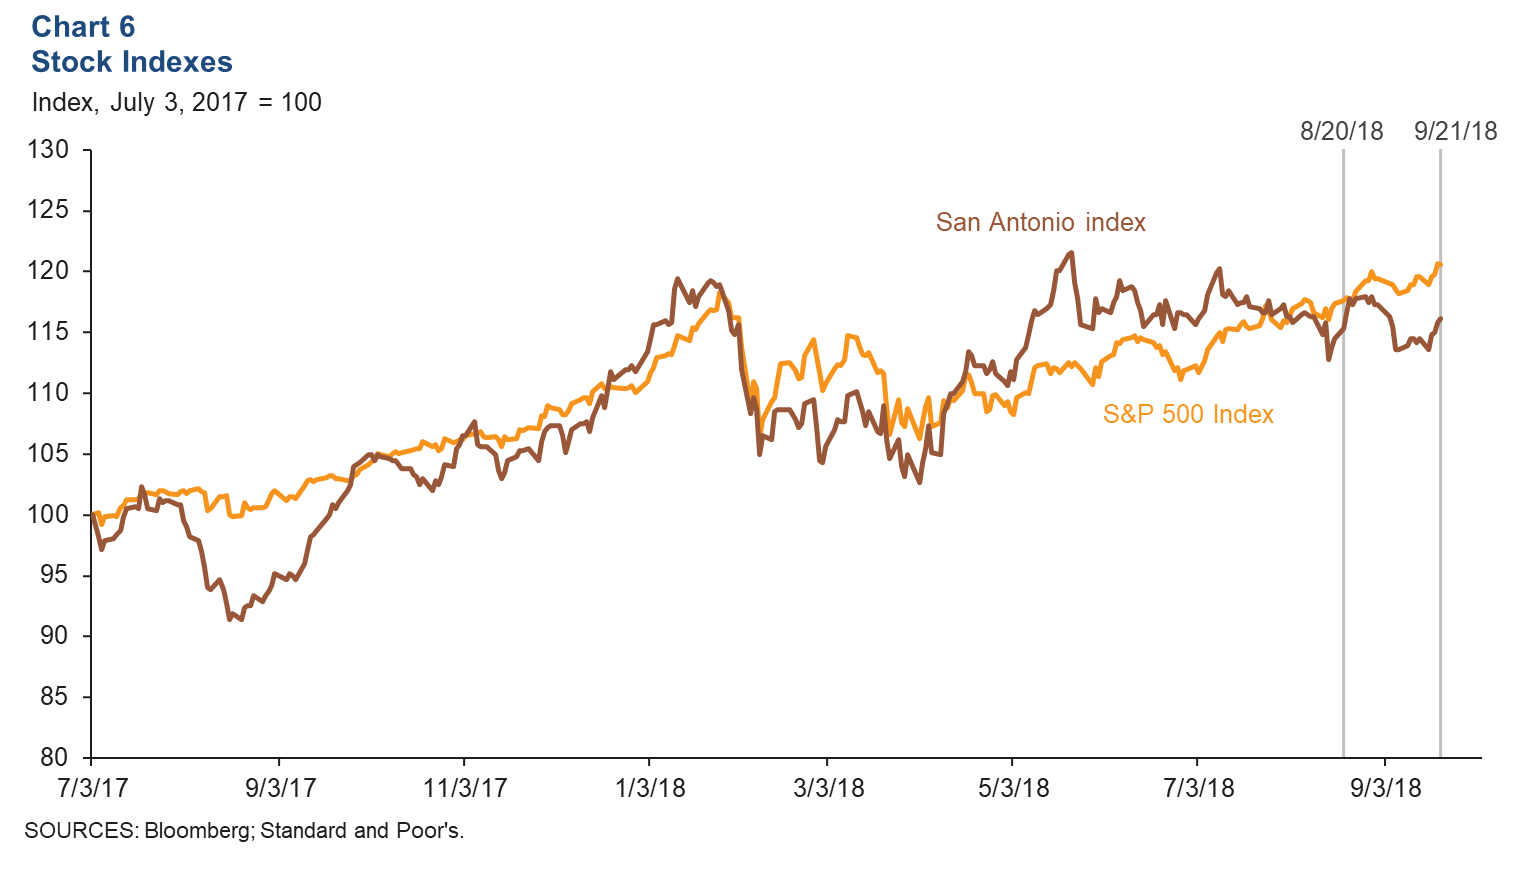
Stock Prices
Stock prices of companies with a significant presence in San Antonio increased 0.7 percent from Aug. 20 to Sept. 21, whereas the S&P 500 experienced a 2.5 percent rise within the same time frame (Chart 6). Food service, manufacturing and financial sectors saw mild declines, while communication and energy-related firms experienced mixed performances.
NOTE: Data may not match previously published numbers due to revisions.
About San Antonio Economic Indicators
Questions can be addressed to Christopher Slijk at christopher.slijk@dal.frb.org. San Antonio Economic Indicators is published every month on the Thursday after state and metro employment data are released.