San Antonio Economic Indicators

The San Antonio economy expanded at a stable rate in February. The unemployment rate declined, and the San Antonio Business-Cycle Index continued to expand, though at a rate slightly below the long-term trend. Jobs have accelerated recently, with growth particularly strong in the construction and leisure and hospitality industries. Private sector wages increased in February, while single-family construction permits took a steep dive.
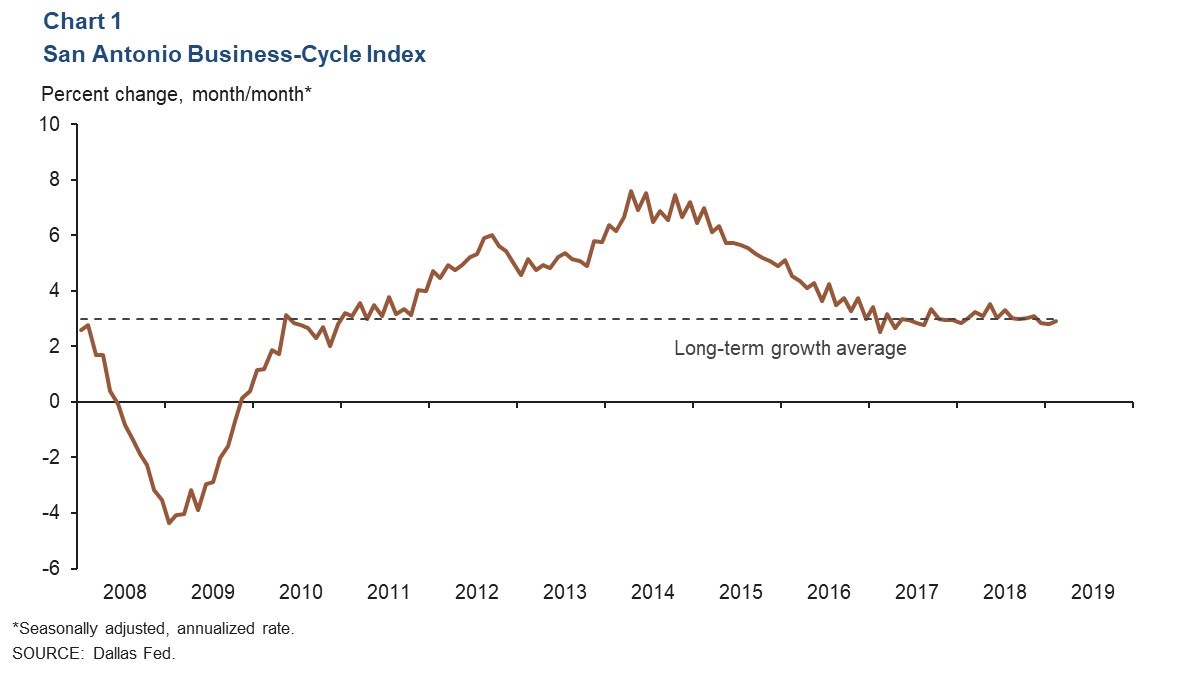
Business-Cycle Index
The San Antonio Business-Cycle Index—a broad measure of economic activity—accelerated at an annualized rate of 2.9 percent in February, coming in slightly above January’s growth rate of 2.8 percent but below the long-term average of 3.0 percent (Chart 1).
Labor Market
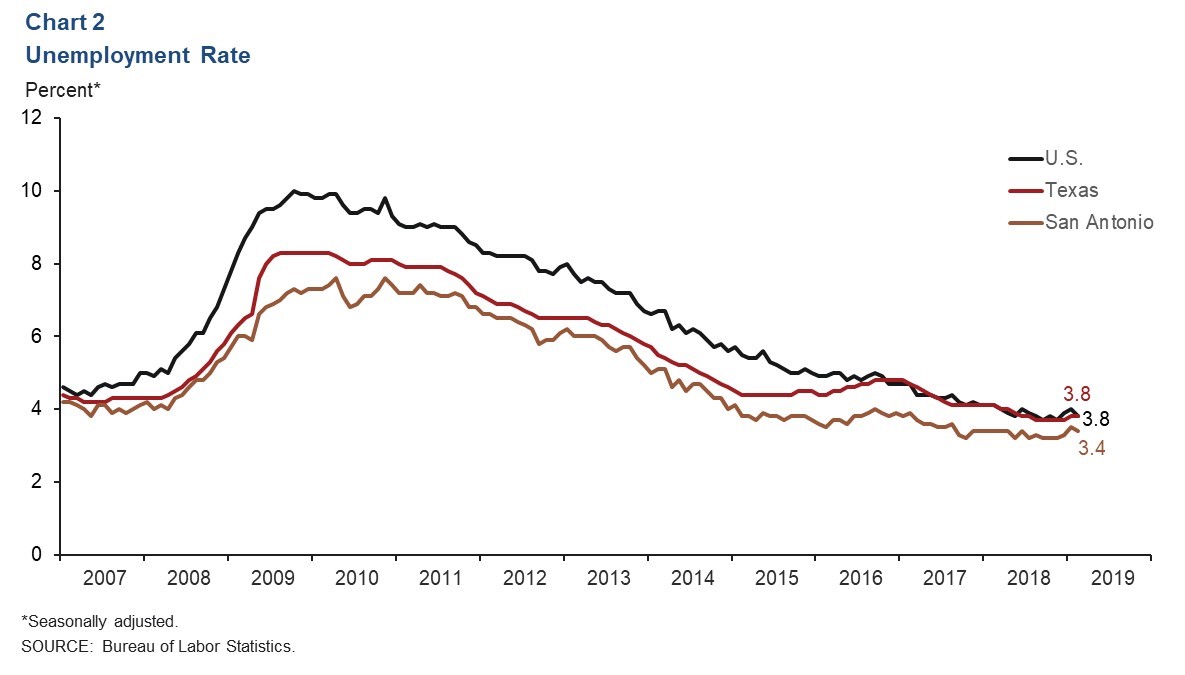
Metro’s Unemployment Lower than State’s
The San Antonio unemployment rate fell to 3.4 percent in February, well below the state and national rates of 3.8 percent (Chart 2). The metro labor force expanded an annualized 2.4 percent in February—a slowdown from December’s 5.2 percent and January’s 3.0 percent.The two-month expansion was likely due to a spike in labor force entry during the recent partial government shutdown as individuals sought to replace lost income. The shutdown ended in late January, and labor force growth returned to near its long-term average of 2.0 percent.
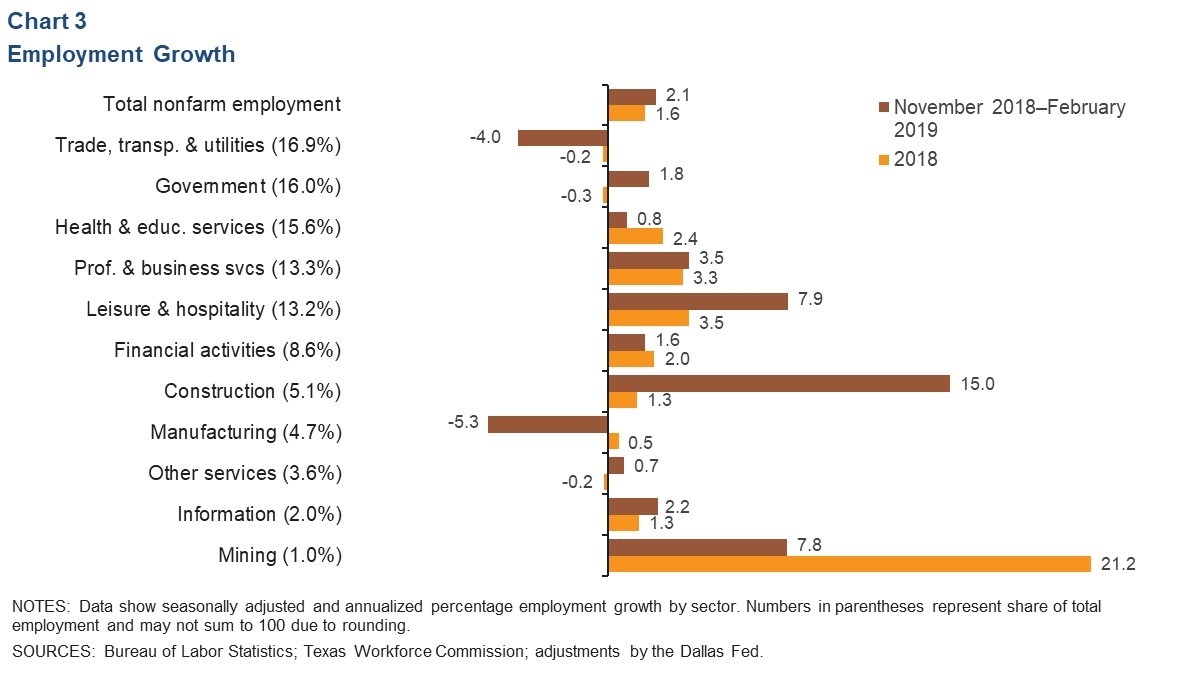
Job Growth Steady
San Antonio added to payrolls at an annualized rate of 2.1 percent during the three months ending in February (Chart 3). Growth was generally positive across the board, with construction leading all sectors at an annualized rate of 15 percent, or a net 1,800 jobs. Leisure and hospitality also expanded at a strong rate, adding 2,600 jobs, and was followed by the mining, government and information industries. Areas of decline included manufacturing and the trade, transportation and utilities sector. The manufacturing industry primarily saw weakness in durable goods manufacturing, and trade, transportation and utilities saw weakness in retail trade.
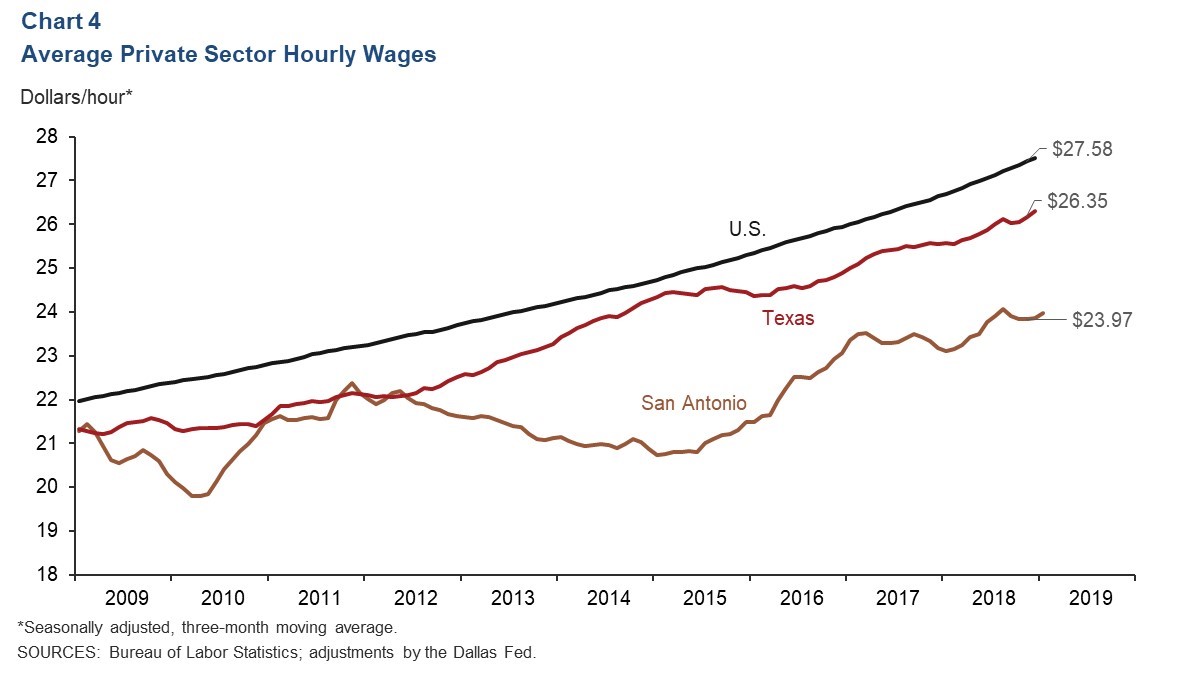
Hourly Wages Rise
The three-month average for private sector hourly wages in San Antonio ticked up to $23.97 in February and increased 4.7 percent year over year (Chart 4). The annual wage growth is above that of the state (2.9 percent) and the nation (3.4 percent) and near the middle relative to other major Texas metros. In particular, the year-over-year wage increase in San Antonio is greater than Austin’s 0.5 percent and Houston’s 2.4 percent but slower than Dallas–Fort Worth’s 5.9 percent and El Paso’s 6.1 percent.
Real Estate
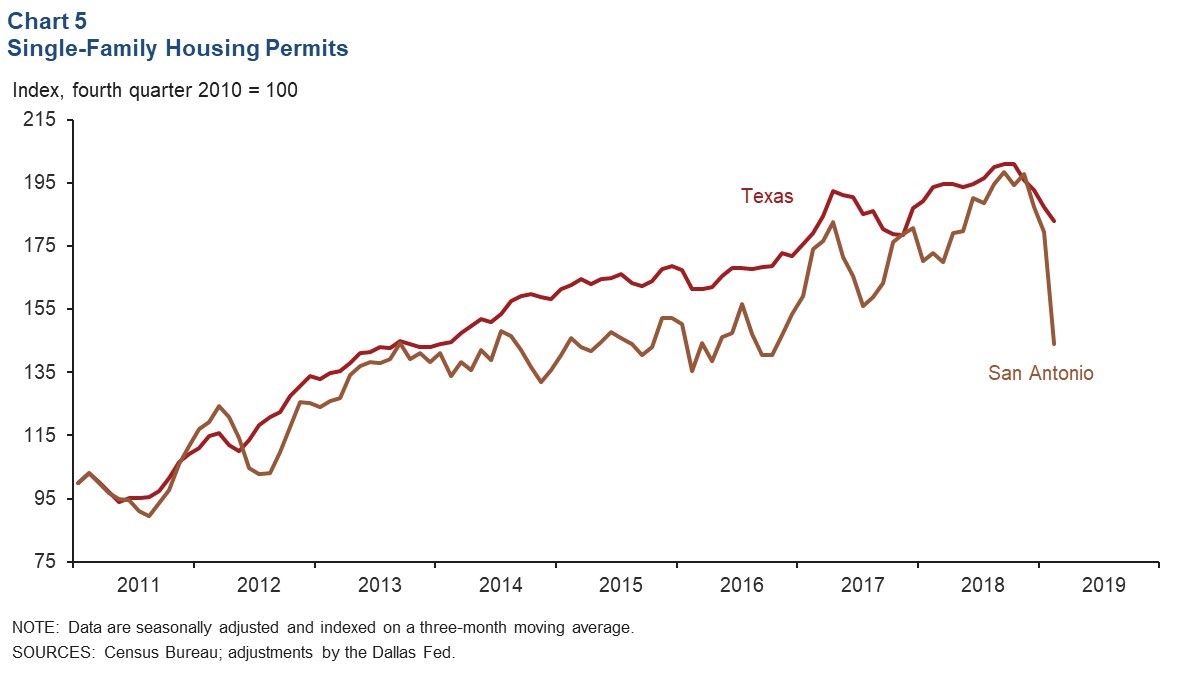
Single-family home construction permits for San Antonio and Texas declined sharply in January, and the three-month average for the San Antonio series dropped to its lowest level since September of 2016 (Chart 5). In 2018, total permits issued in San Antonio increased 8.2 percent, while Texas permits increased 4.5 percent. Home inventories remained at 3.6 months’ supply, well below the six months considered a balanced market.
Stock Prices
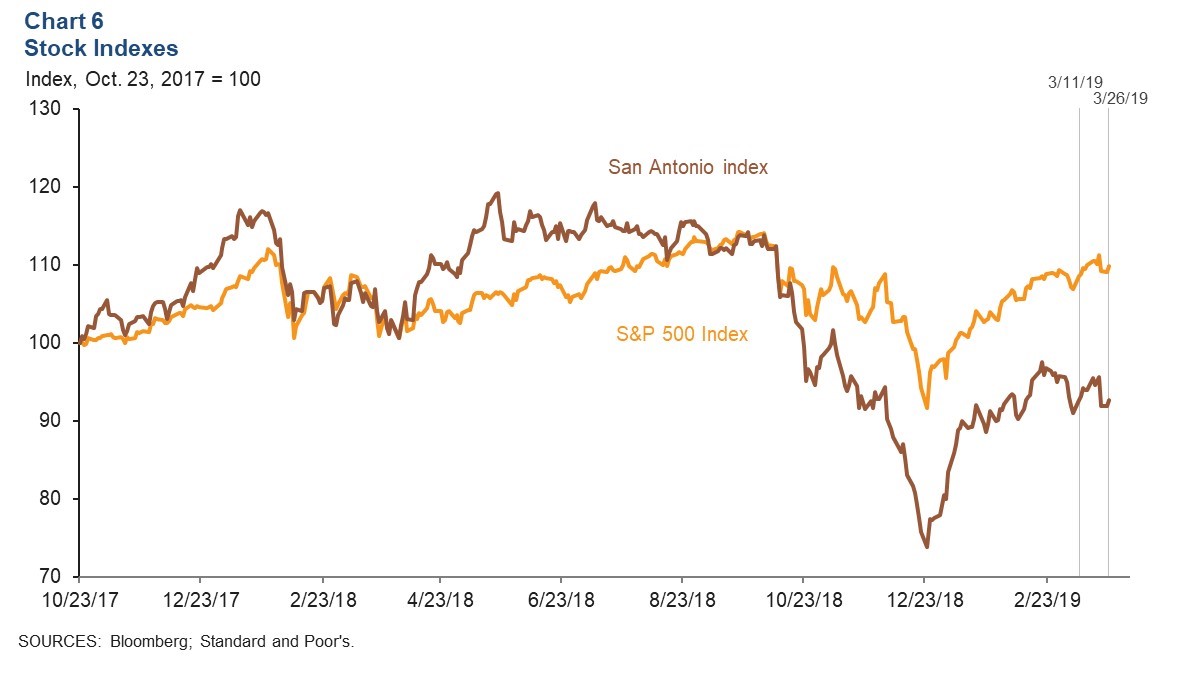
Due to a slight dip in the stock market on March 22, stock prices of companies with a notable presence in San Antonio were unchanged from March 11 to March 26, while the S&P 500 grew a modest 1.3 percent (Chart 6). Performance by sector varied. Firms within the manufacturing industry saw little change during this period, while those in the energy sector had mixed performances. Refining firms advanced moderately, while transportation and pipeline businesses saw no change. Finance-related firms experienced slight declines in stock value, as did those in the communications sector. Companies in food services saw mild growth.
NOTE: Data may not match previously published numbers due to revisions.
About San Antonio Economic Indicators
Questions can be addressed to Judy Teng at judy.teng@dal.frb.org. San Antonio Economic Indicators is published every month on the Thursday after state and metro employment data are released.