San Antonio Economic Indicators

The San Antonio economy expanded moderately in June. The unemployment rate rose slightly, and the San Antonio Business-Cycle Index grew marginally above its long-term trend. Job growth has remained mild over the past several months. The professional and business services sector continued to post strong growth, while leisure and hospitality and construction weakened. Wages ticked up, and home sales volume increased.
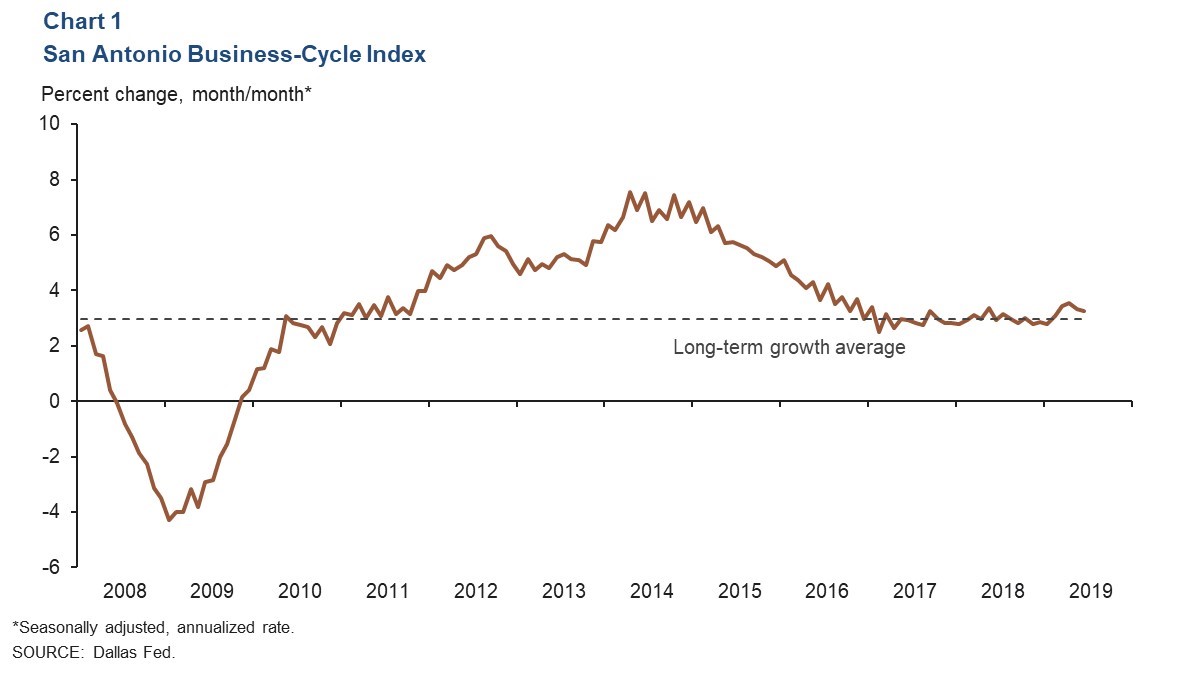
Business-Cycle Index
The San Antonio Business-Cycle Index—a broad measure of economic activity in the metro—expanded 3.3 percent, the same rate as in May and slightly above the long-term average of 3.0 percent (Chart 1). The index so far this year has been propelled by lower unemployment rates and healthy job growth, suggesting temperate expansion in the region’s economy.
Labor Market
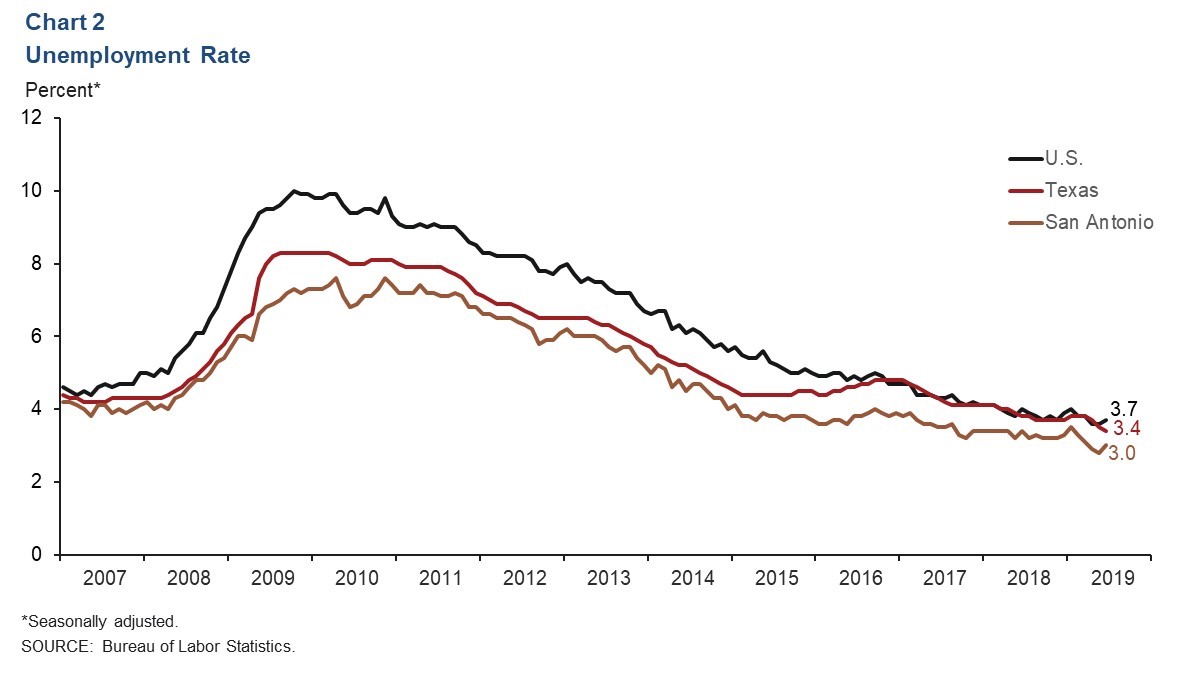
Unemployment Low
The labor market remains tight in the San Antonio metro. The unemployment rate inched up but remained markedly low at 3.0 percent in June (Chart 2). This is well below the state and national rates of 3.4 percent and 3.7 percent, respectively. The metro’s labor force has contracted an annualized 0.2 percent thus far this year.
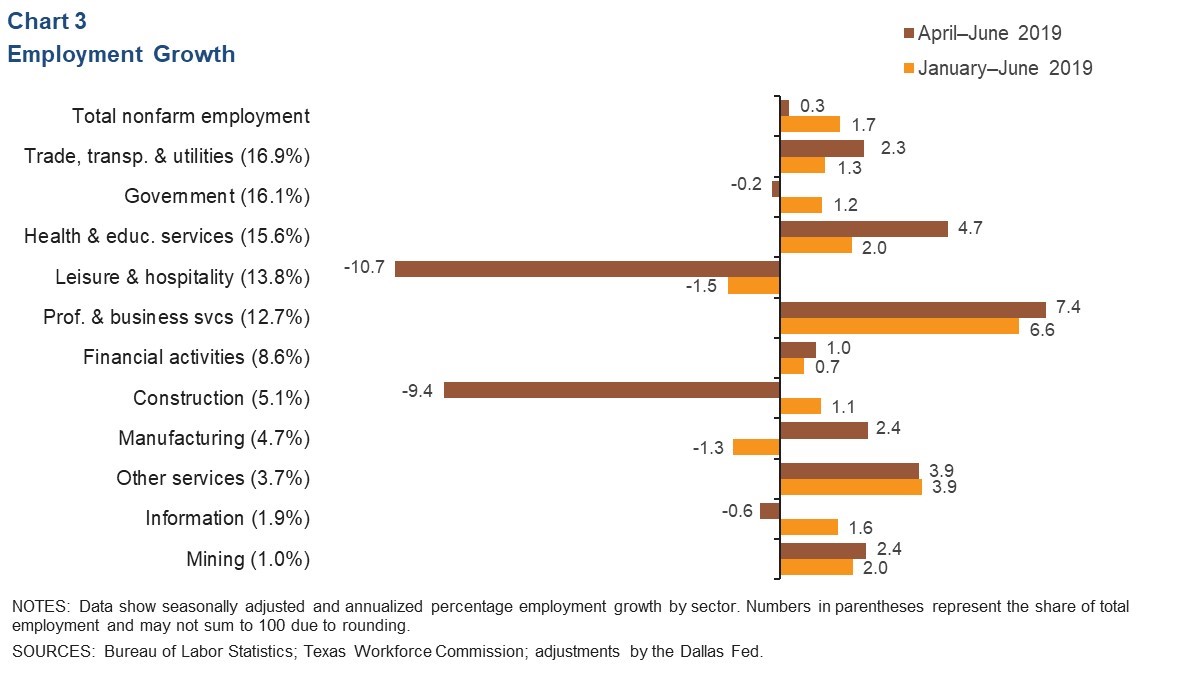
Job Growth Mild
Job growth weakened recently in the San Antonio metro area as new jobs were added to the region at a 0.3 percent annualized rate during the three months ending in June (Chart 3). Growth was largely led by the professional and business services sector as payrolls expanded an annualized 7.4 percent, or a net 2,600 jobs. Health and education services also experienced gains (roughly 1,900 net jobs), with particular strength in jobs related to health care and social assistance. Payrolls contracted 10.7 percent (3,900 jobs) in leisure and hospitality and 9.4 percent (1,350 jobs) in construction.
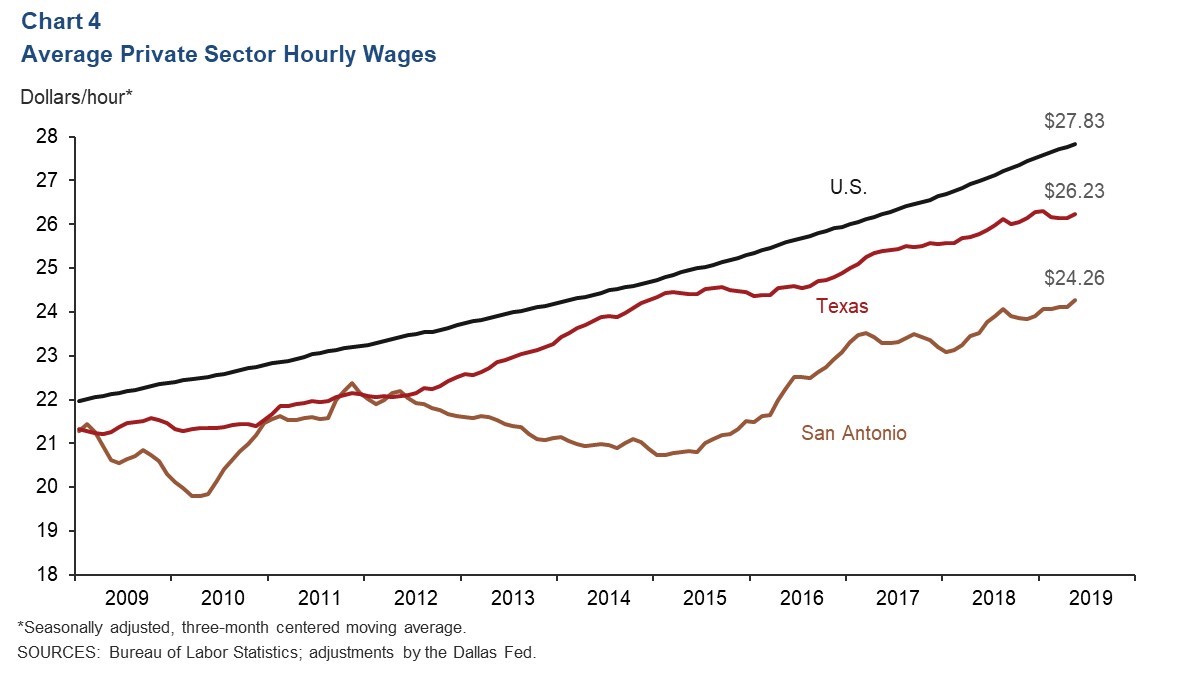
Wages Climb
The three-month average for private sector hourly wages in San Antonio increased to $24.26 in June (Chart 4). A portion of the increase may be due to compositional effects as substantial declines in leisure and hospitality jobs bumped up the average. Year over year, hourly wages increased 3.7 percent in the metro versus 2.1 percent in Texas and 3.1 percent in the U.S.
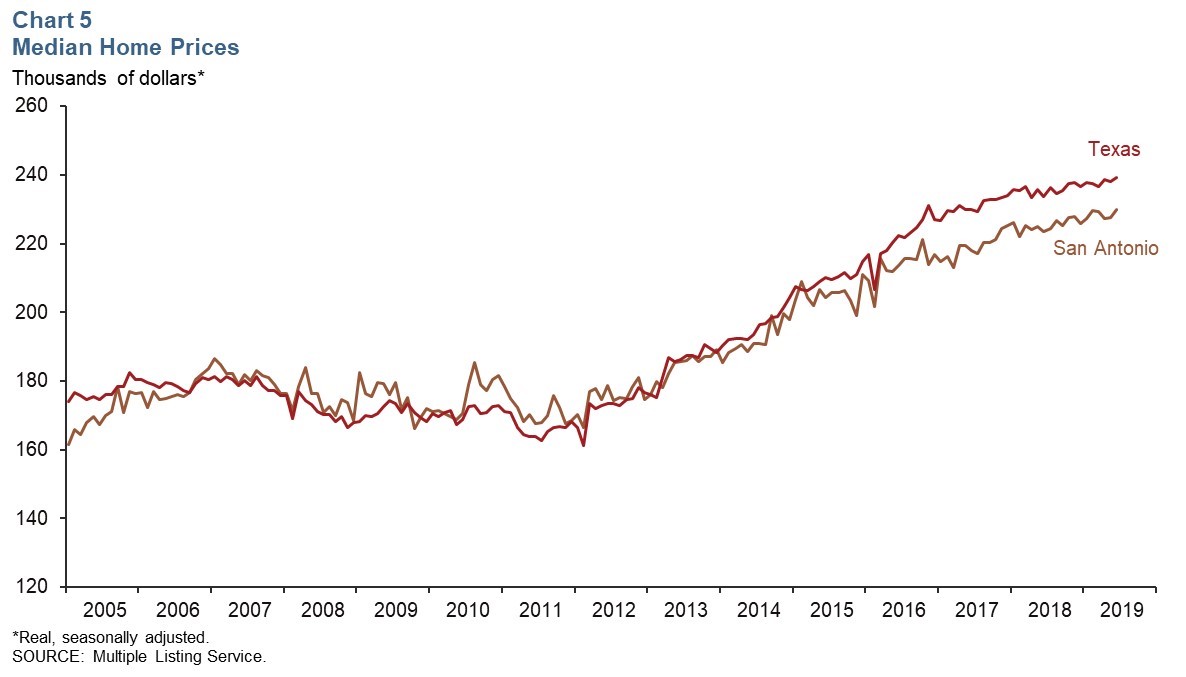
Real Estate
The housing market posted stable numbers in June. The real median sales price for houses stood at $229,907 in June, up from May’s $227,654 (Chart 5). From second quarter 2018 to second quarter 2019, the inflation-adjusted average sales price increased 1.8 percent, the same as in the state. This year through June, sales volumes in the metro have increased 3.1 percent compared with the same period last year. The increase is roughly 2 percentage points higher than sales growth in the state over that period. Home inventories ticked down to 3.6 months of supply, well below the six months considered a balanced market.
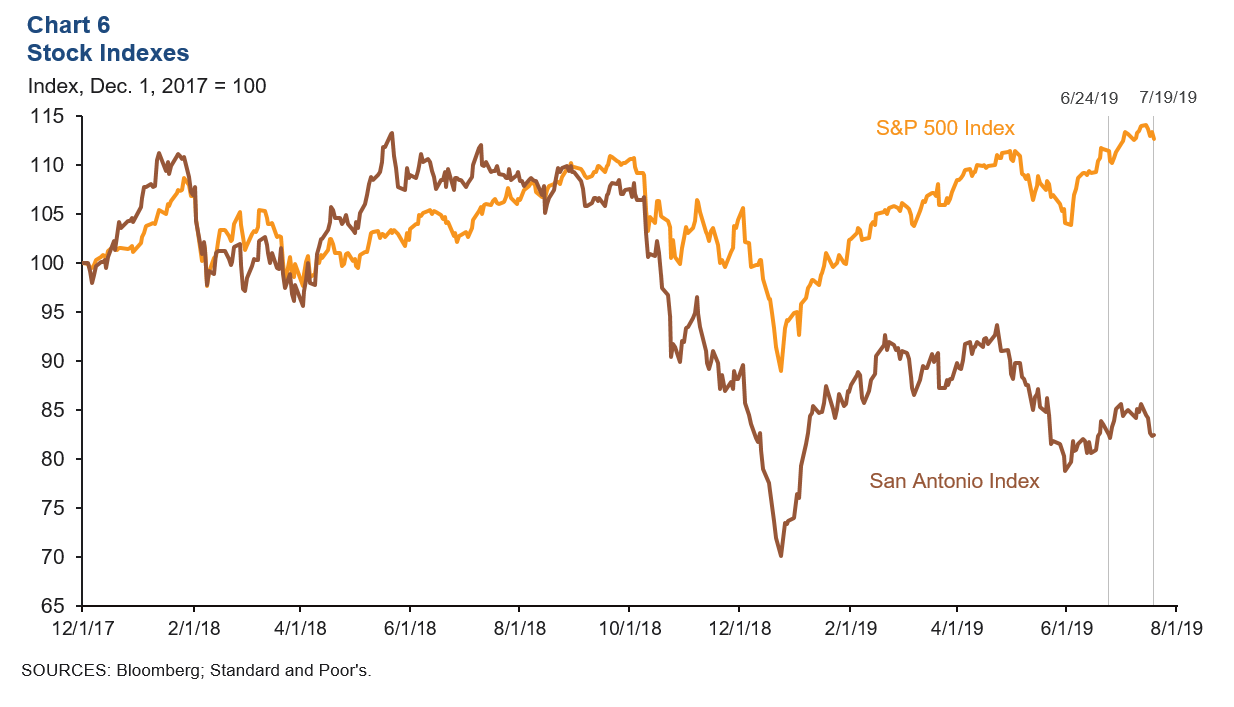
Stock Prices
Stock prices of companies with a notable presence in San Antonio fluctuated but ultimately returned to the same price point from June 24 to July 19 (Chart 6). The S&P 500 Index expanded 1.1 percent during the same period. Performance by sector was mixed in the metro. Manufacturing firms experienced slight declines in share prices. Energy companies associated with transportation and refining saw stock prices tick up, while those in exploration and production saw declines. Firms within the food services and communication sectors turned in mixed performances, and stock prices of firms in finance moved up.
NOTE: Data may not match previously published numbers due to revisions.
About San Antonio Economic Indicators
Questions can be addressed to Judy Teng at judy.teng@dal.frb.org. San Antonio Economic Indicators is published every month on the Thursday after state and metro employment data are released.