San Antonio Economic Indicators

Growth in the San Antonio economy accelerated in August. The San Antonio Business-Cycle Index expanded at its fastest pace since 2016, while job growth surged in recent months. Labor markets remained near historical levels of tightness, and wage growth trended upward. Residential real estate markets remain robust, with home sales up and prices near all-time highs.
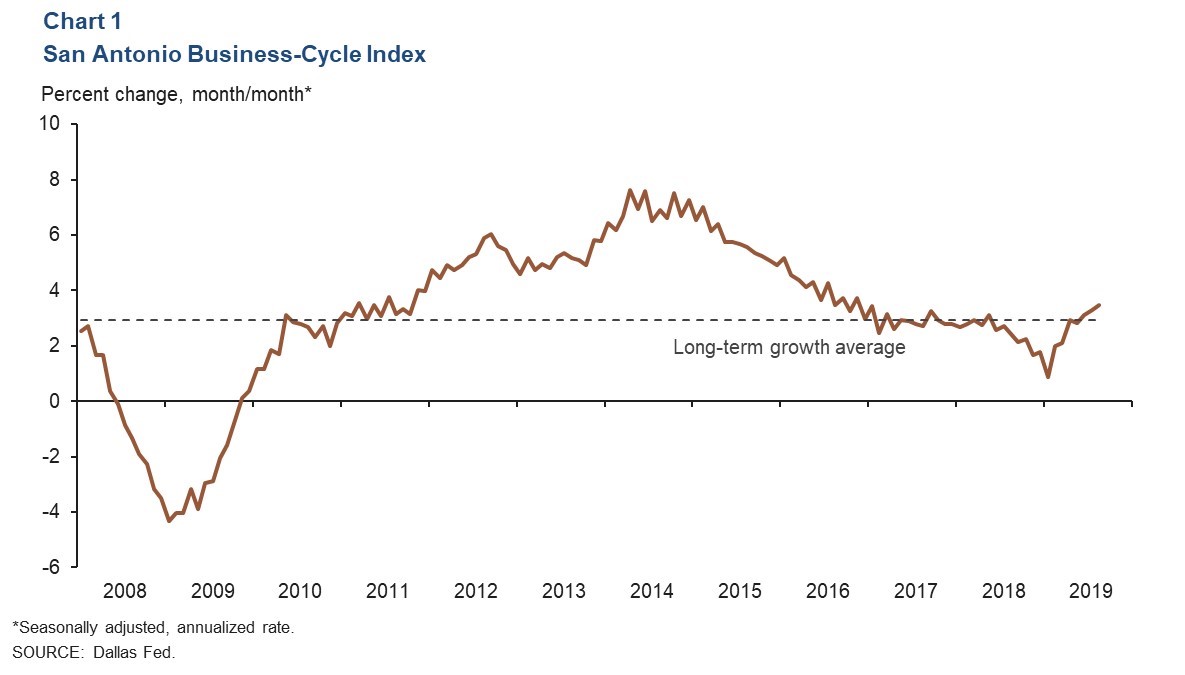
Business-Cycle Index
The San Antonio Business-Cycle Index—a broad measure of economic activity in the metro—picked up to an annualized rate of 3.5 percent in August, shooting past its long-term trend of 2.9 percent (Chart 1). Recent index growth has been driven by an acceleration in job growth, along with an unemployment rate that has held near multidecade lows. These factors suggest that the regional economy has picked up after weakening early in the year.
Labor Market
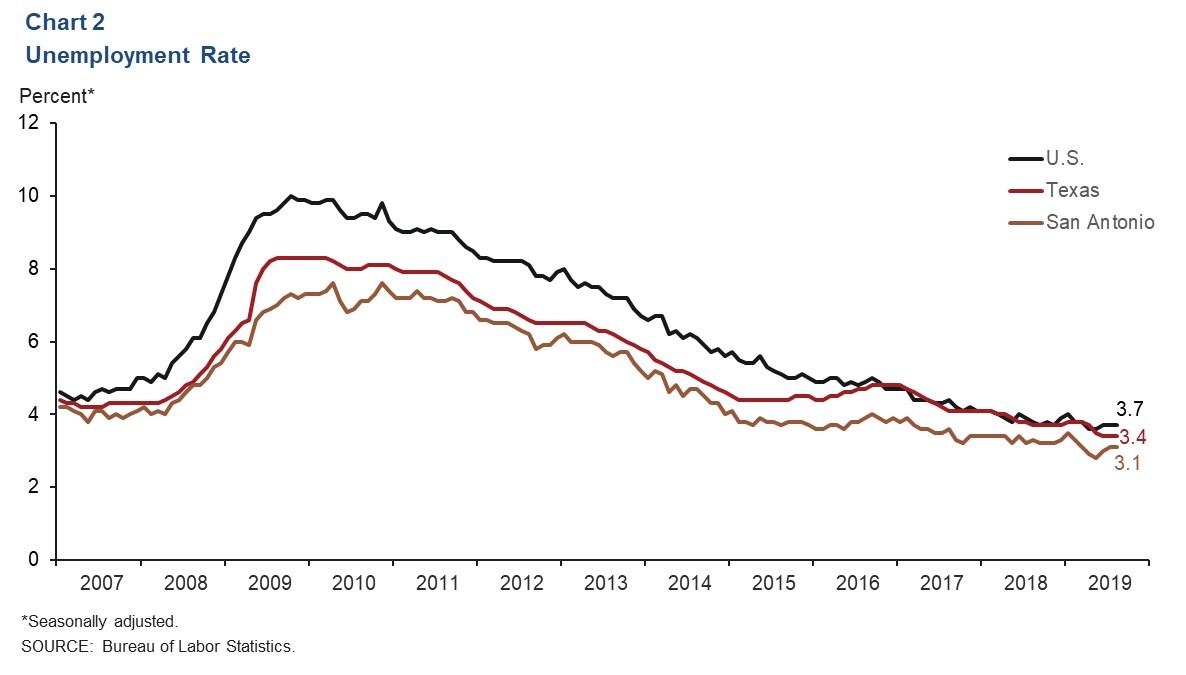
Jobless Rate Remains Below State Average
San Antonio labor markets remain very tight. The unemployment rate held at a low 3.1 percent in August, mimicking the steadiness of the higher state and national rates (Chart 2). Labor force growth picked up to an annualized 7.1 percent rate in August, its fastest pace this year. However, growth for the year is an annualized 0.8 percent, compared with the state’s 1.2 percent rate.
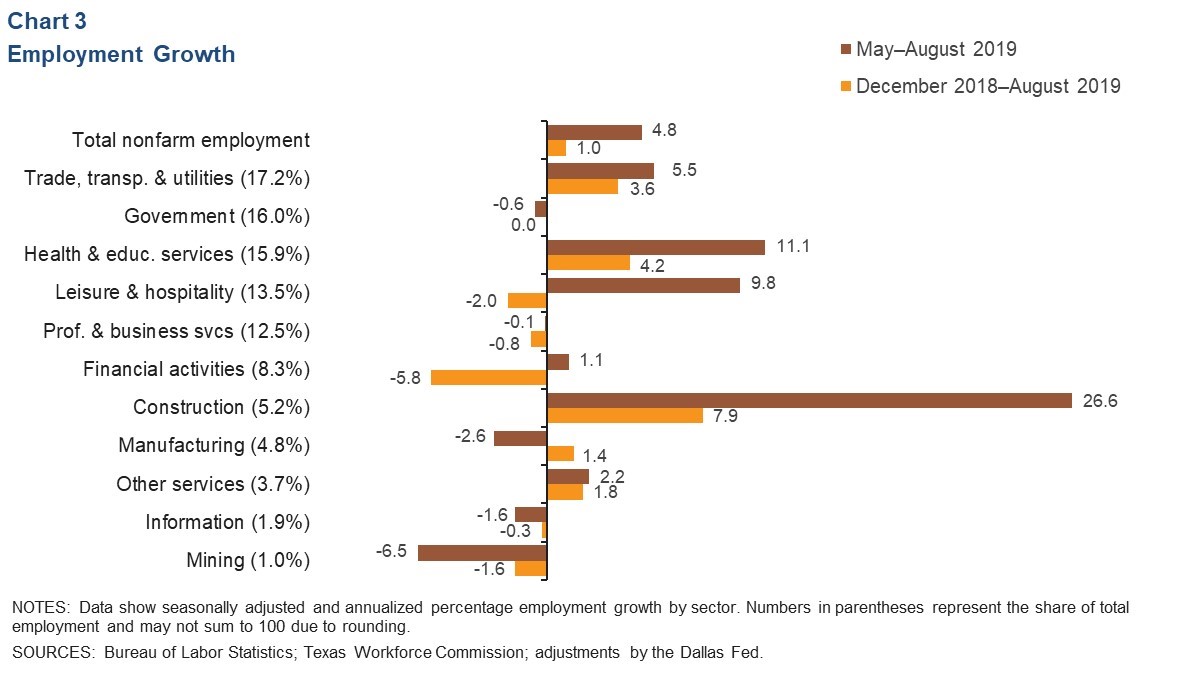
Recent Job Growth Picks Up
Job growth in the San Antonio metro area accelerated over the three months ending in August to a 4.8 percent annualized rate (Chart 3). Growth was mixed across industries, with construction by far the fastest-growing sector. Other large industries such as health care and leisure and hospitality saw a net hiring surge, adding a combined 7,500 jobs. Retail trade jobs also grew, buoying the trade, transportation and utilities sector. Areas of weakness include mining, which declined more sharply over this period, and manufacturing, which reversed moderate gains from earlier in the year.
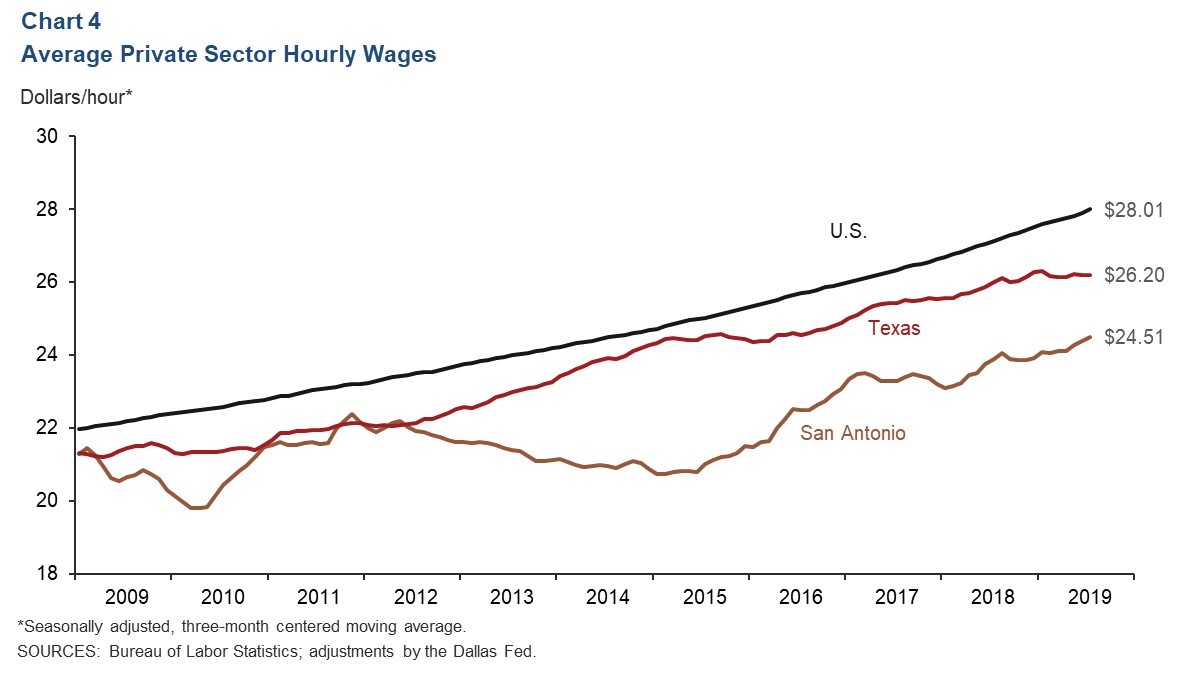
Wages Climb
The three-month average for private sector hourly wages in San Antonio increased to $24.51 in August (Chart 4). Wage growth year over year has picked up in the region to 3.1 percent, comparable to the national average of 3.2 percent and well ahead of the state’s 0.6 percent increase.
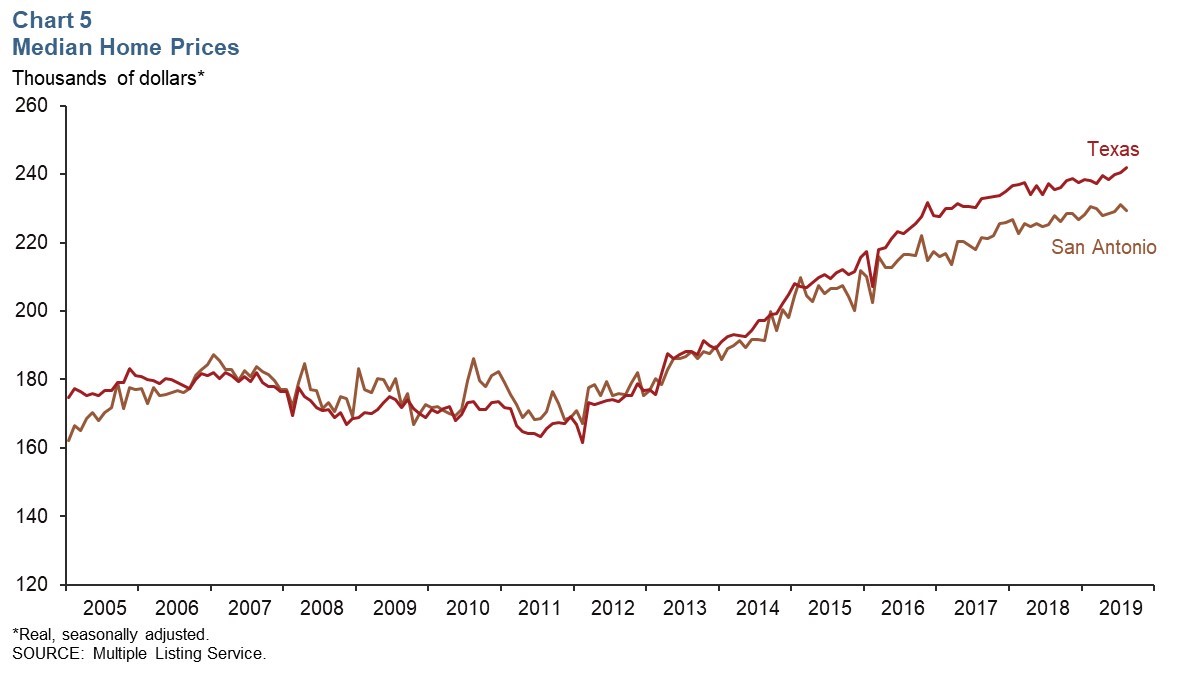
Real Estate
The San Antonio housing market was robust in August. The real median sales price for houses ticked down slightly after reaching an all-time high of over $230,000 (Chart 5). However, price appreciation was tepid at 0.6 percent year over year in August, compared with the state’s 2.7 percent rise. Meanwhile, home sales surged to an all-time high and were up nearly 15 percent year over year. That compares with a 9 percent increase in statewide sales.
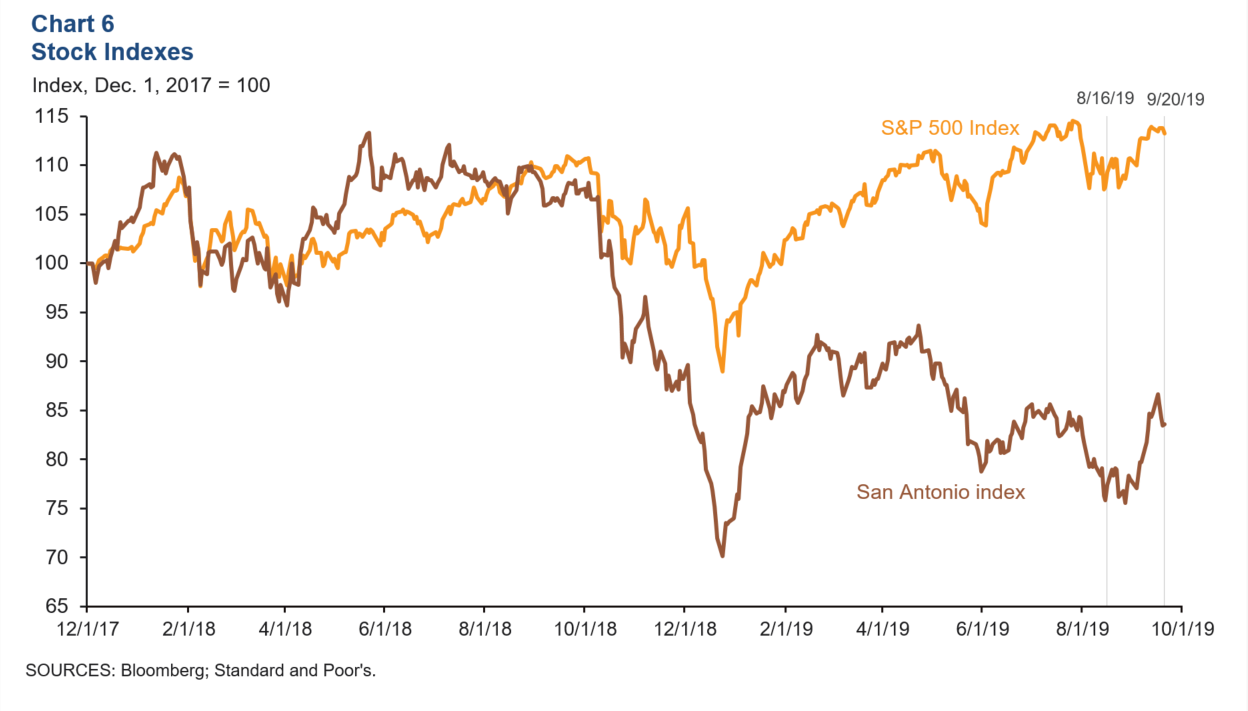
Stock Prices
Share prices of companies with a notable presence in San Antonio appreciated 8.0 percent from Aug. 16 to Sept. 20—more than the S&P 500 Index’s 3.6 percent increase over the same time (Chart 6). The appreciation was generally broad based across industries in the San Antonio index. Manufacturers and financial firms saw steady increases in their stock prices. Food services and energy-related firms had mixed performances.
NOTE: Data may not match previously published numbers due to revisions.
About San Antonio Economic Indicators
Questions can be addressed to Judy Teng at judy.teng@dal.frb.org. San Antonio Economic Indicators is published every month on the Thursday after state and metro employment data are released.