San Antonio Economic Indicators

March 31, 2022
Broad measures of the San Antonio economy continued to be positive in February. The San Antonio Business-Cycle Index and employment grew as the unemployment rate remained constant. Annualized net job growth the past three months was well above the rate for 2021 as a whole, and wages continued to increase to record highs. Daily COVID-19 cases are now well below the omicron wave’s peak. Dining-out activity was strong in March, rebounding after COVID cases declined.
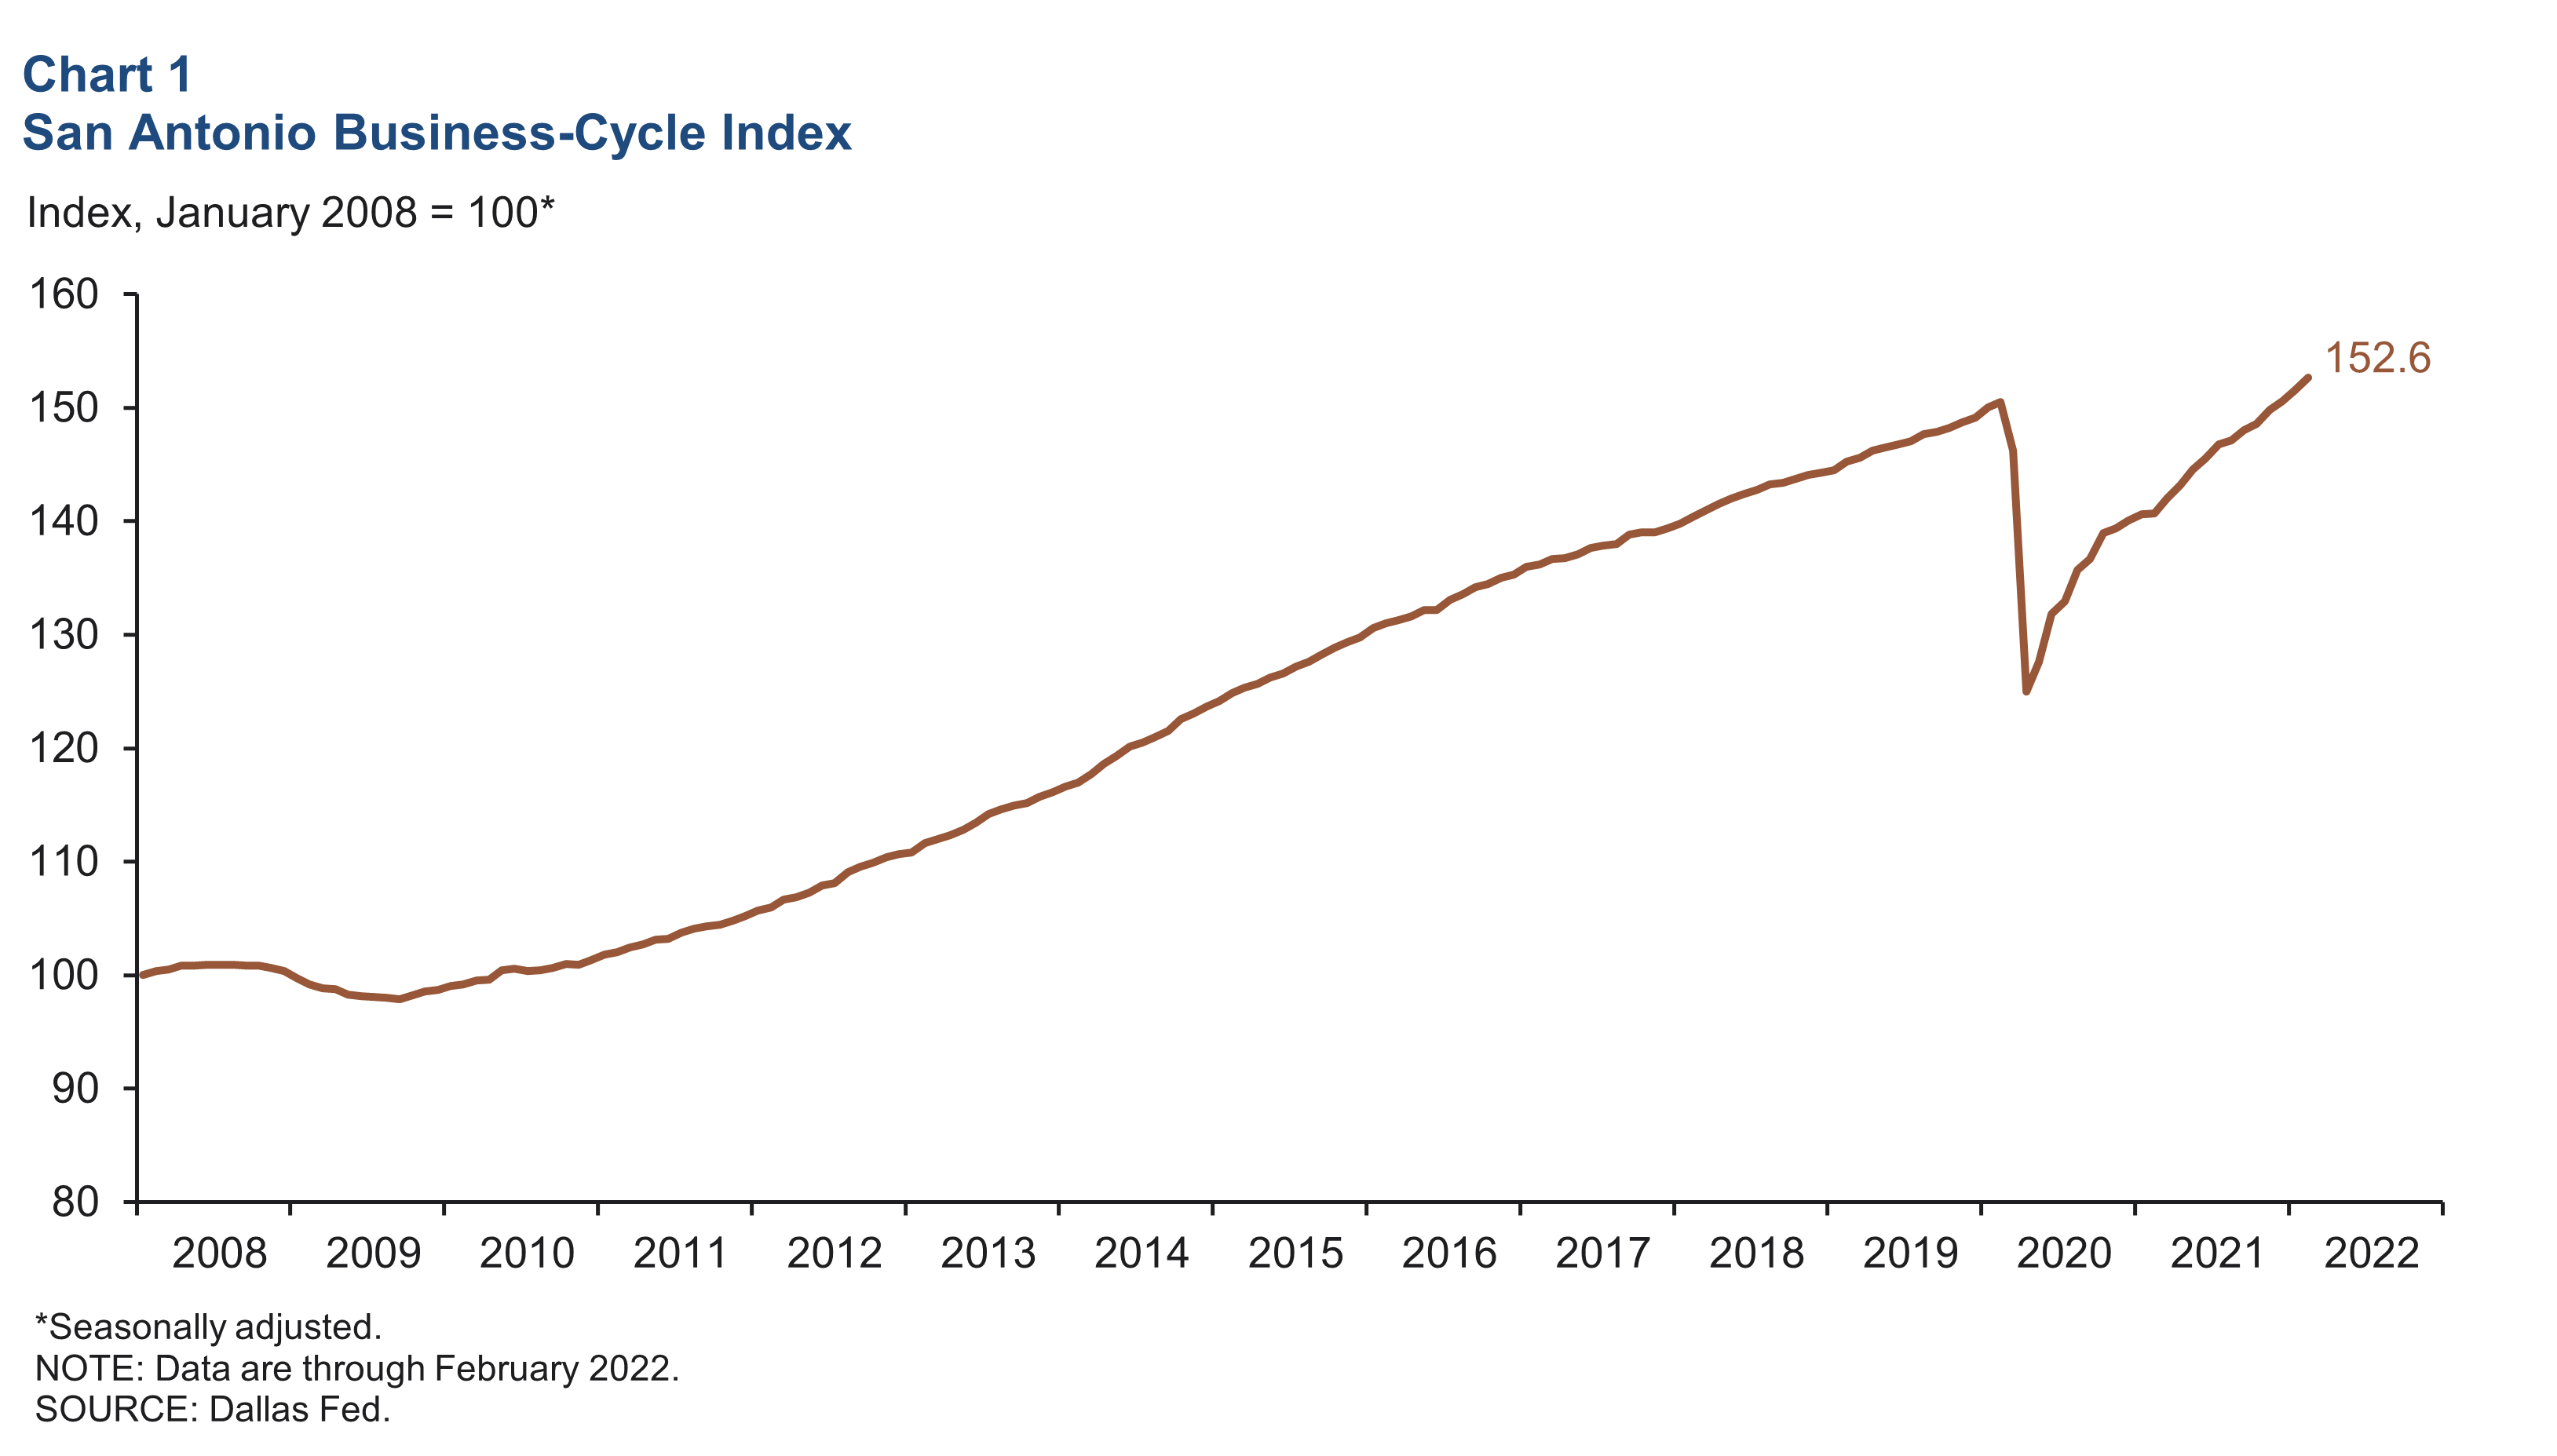
Business-cycle index
The San Antonio Business-Cycle Index—a broad measure of economic activity in the metro—grew at an annualized rate of 9.1 percent in February after rising 8.0 percent in January (Chart 1).
Labor market
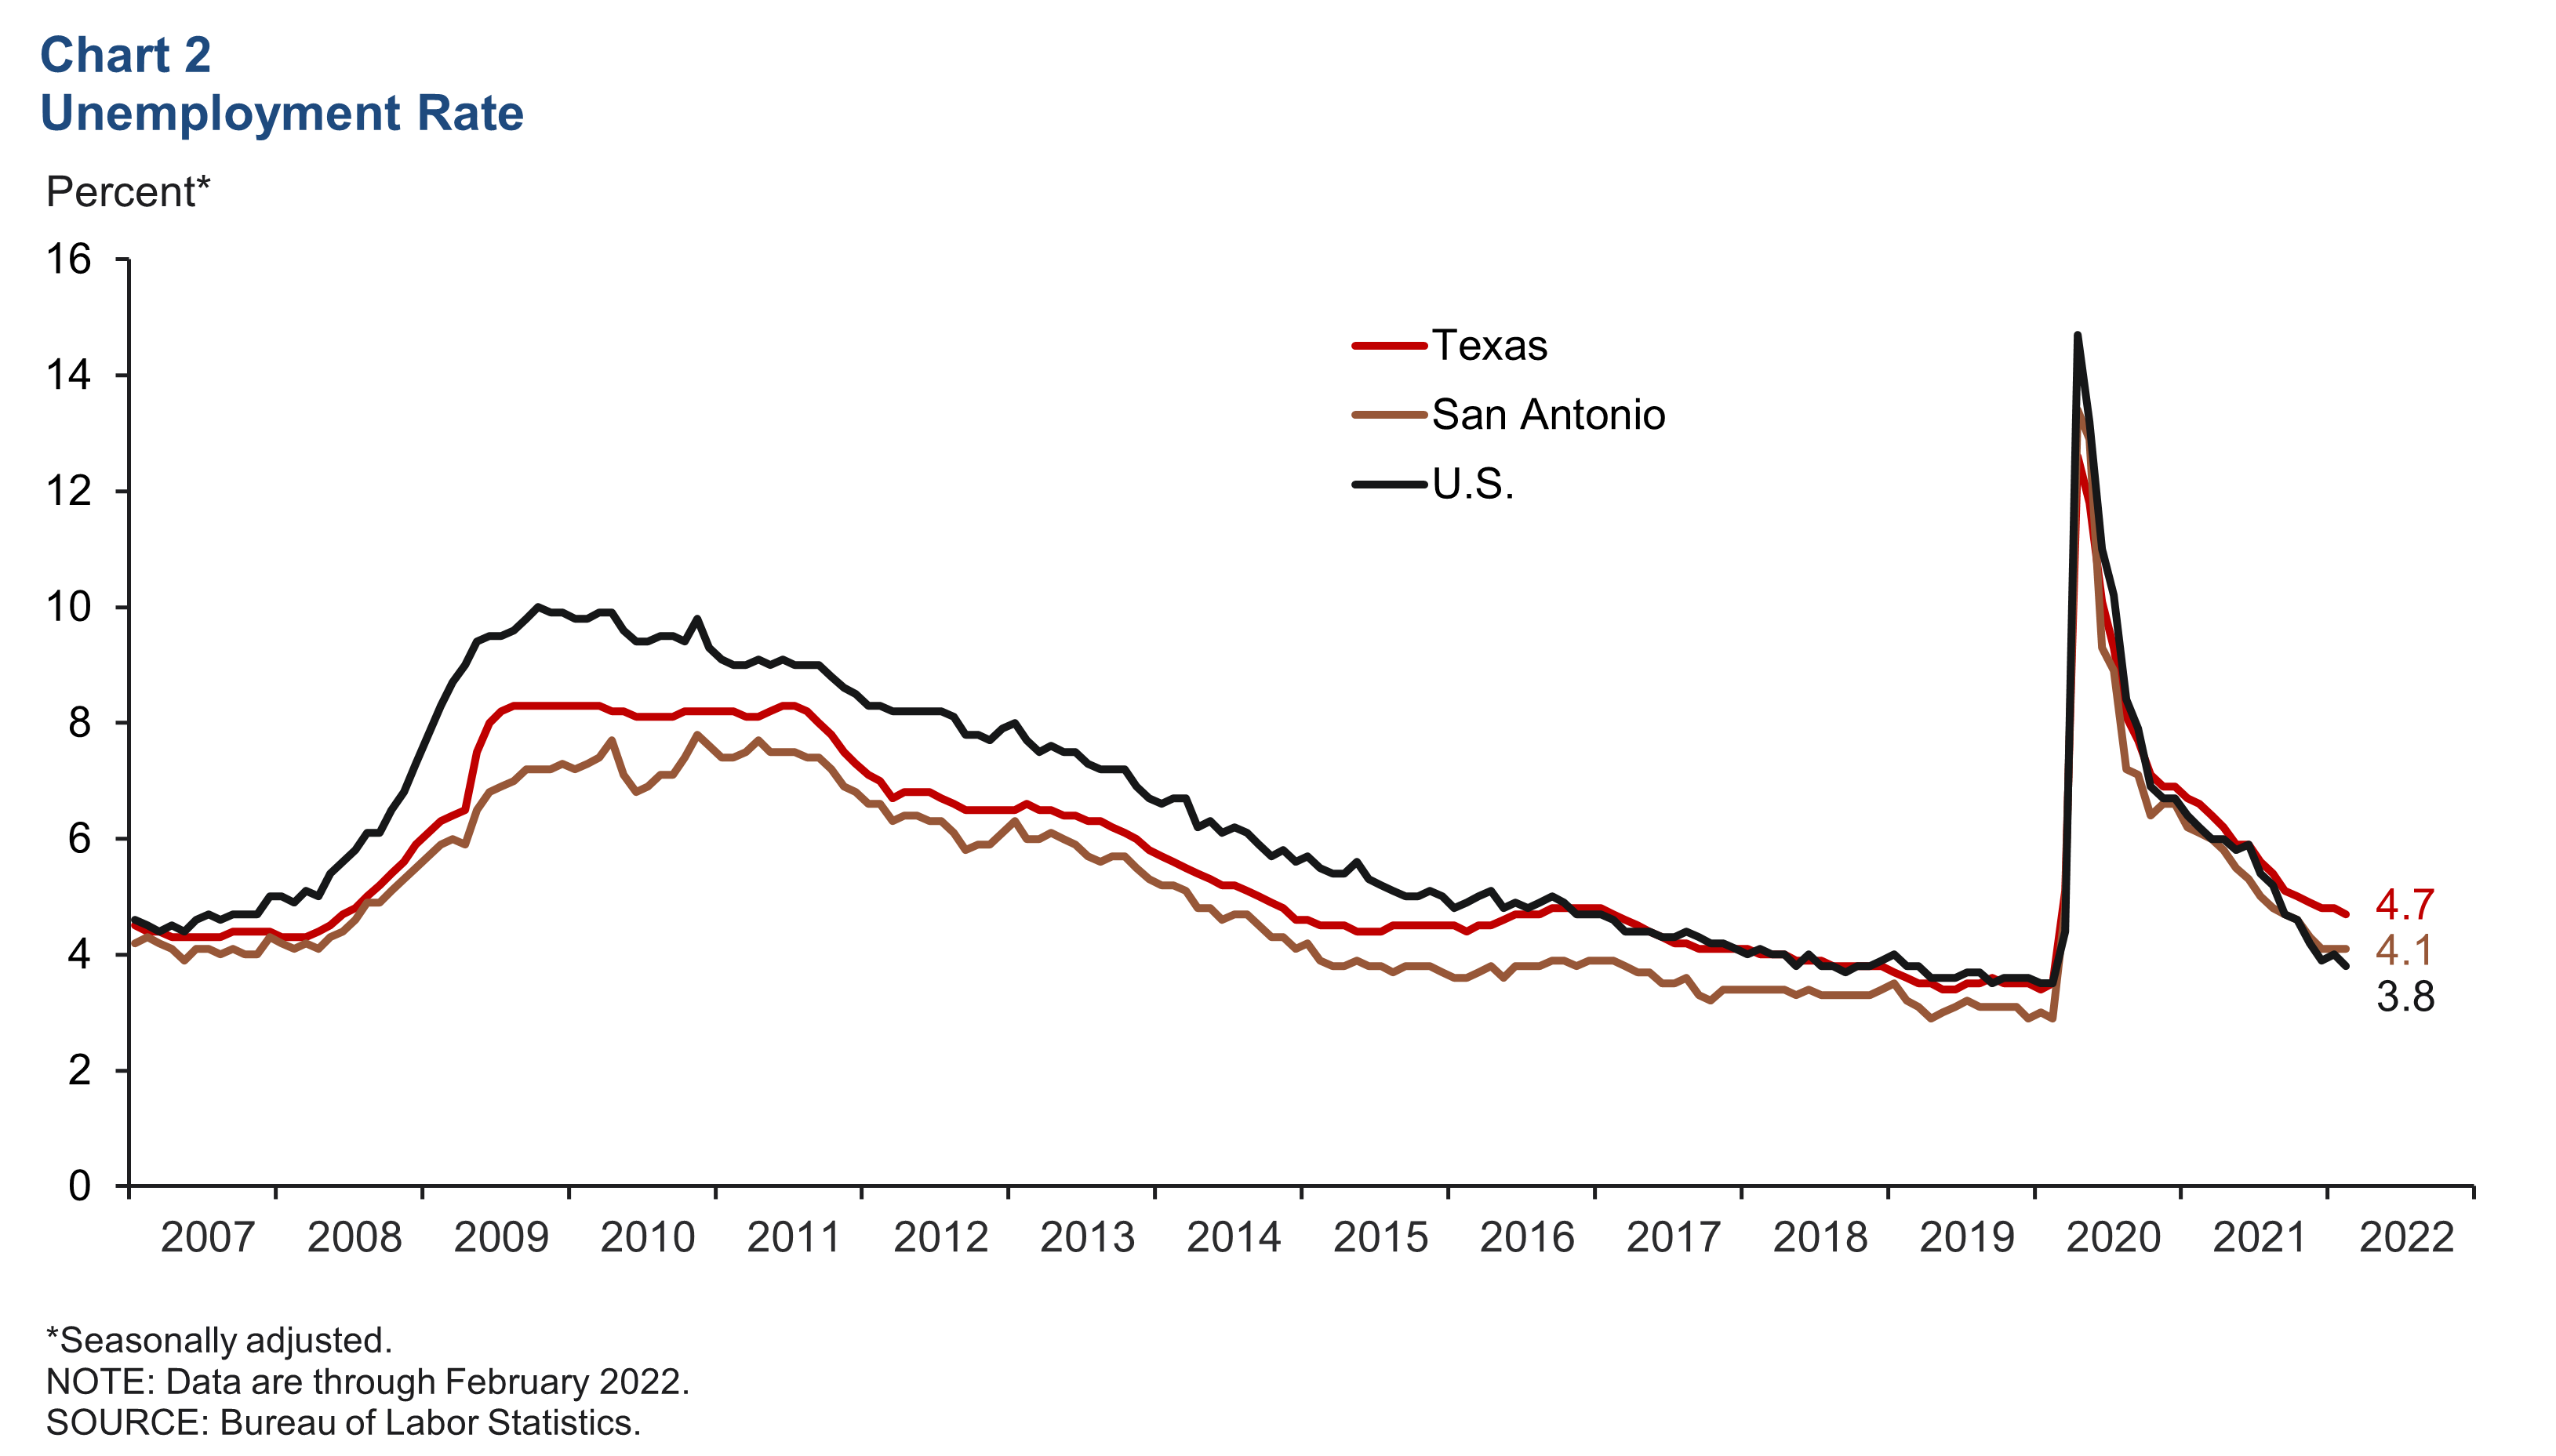
Unemployment rate holds steady near pandemic lows
The metro’s unemployment rate remained constant in February at 4.1 percent, one of the lowest rates since the start of the pandemic (Chart 2). The state’s jobless rate fell slightly to 4.7 percent, and the nation’s rate fell to 3.8 percent. San Antonio’s labor force expanded an annualized 7.5 percent in February, well above Texas’ gain of 3.4 percent and the nation’s gain of 2.3 percent.
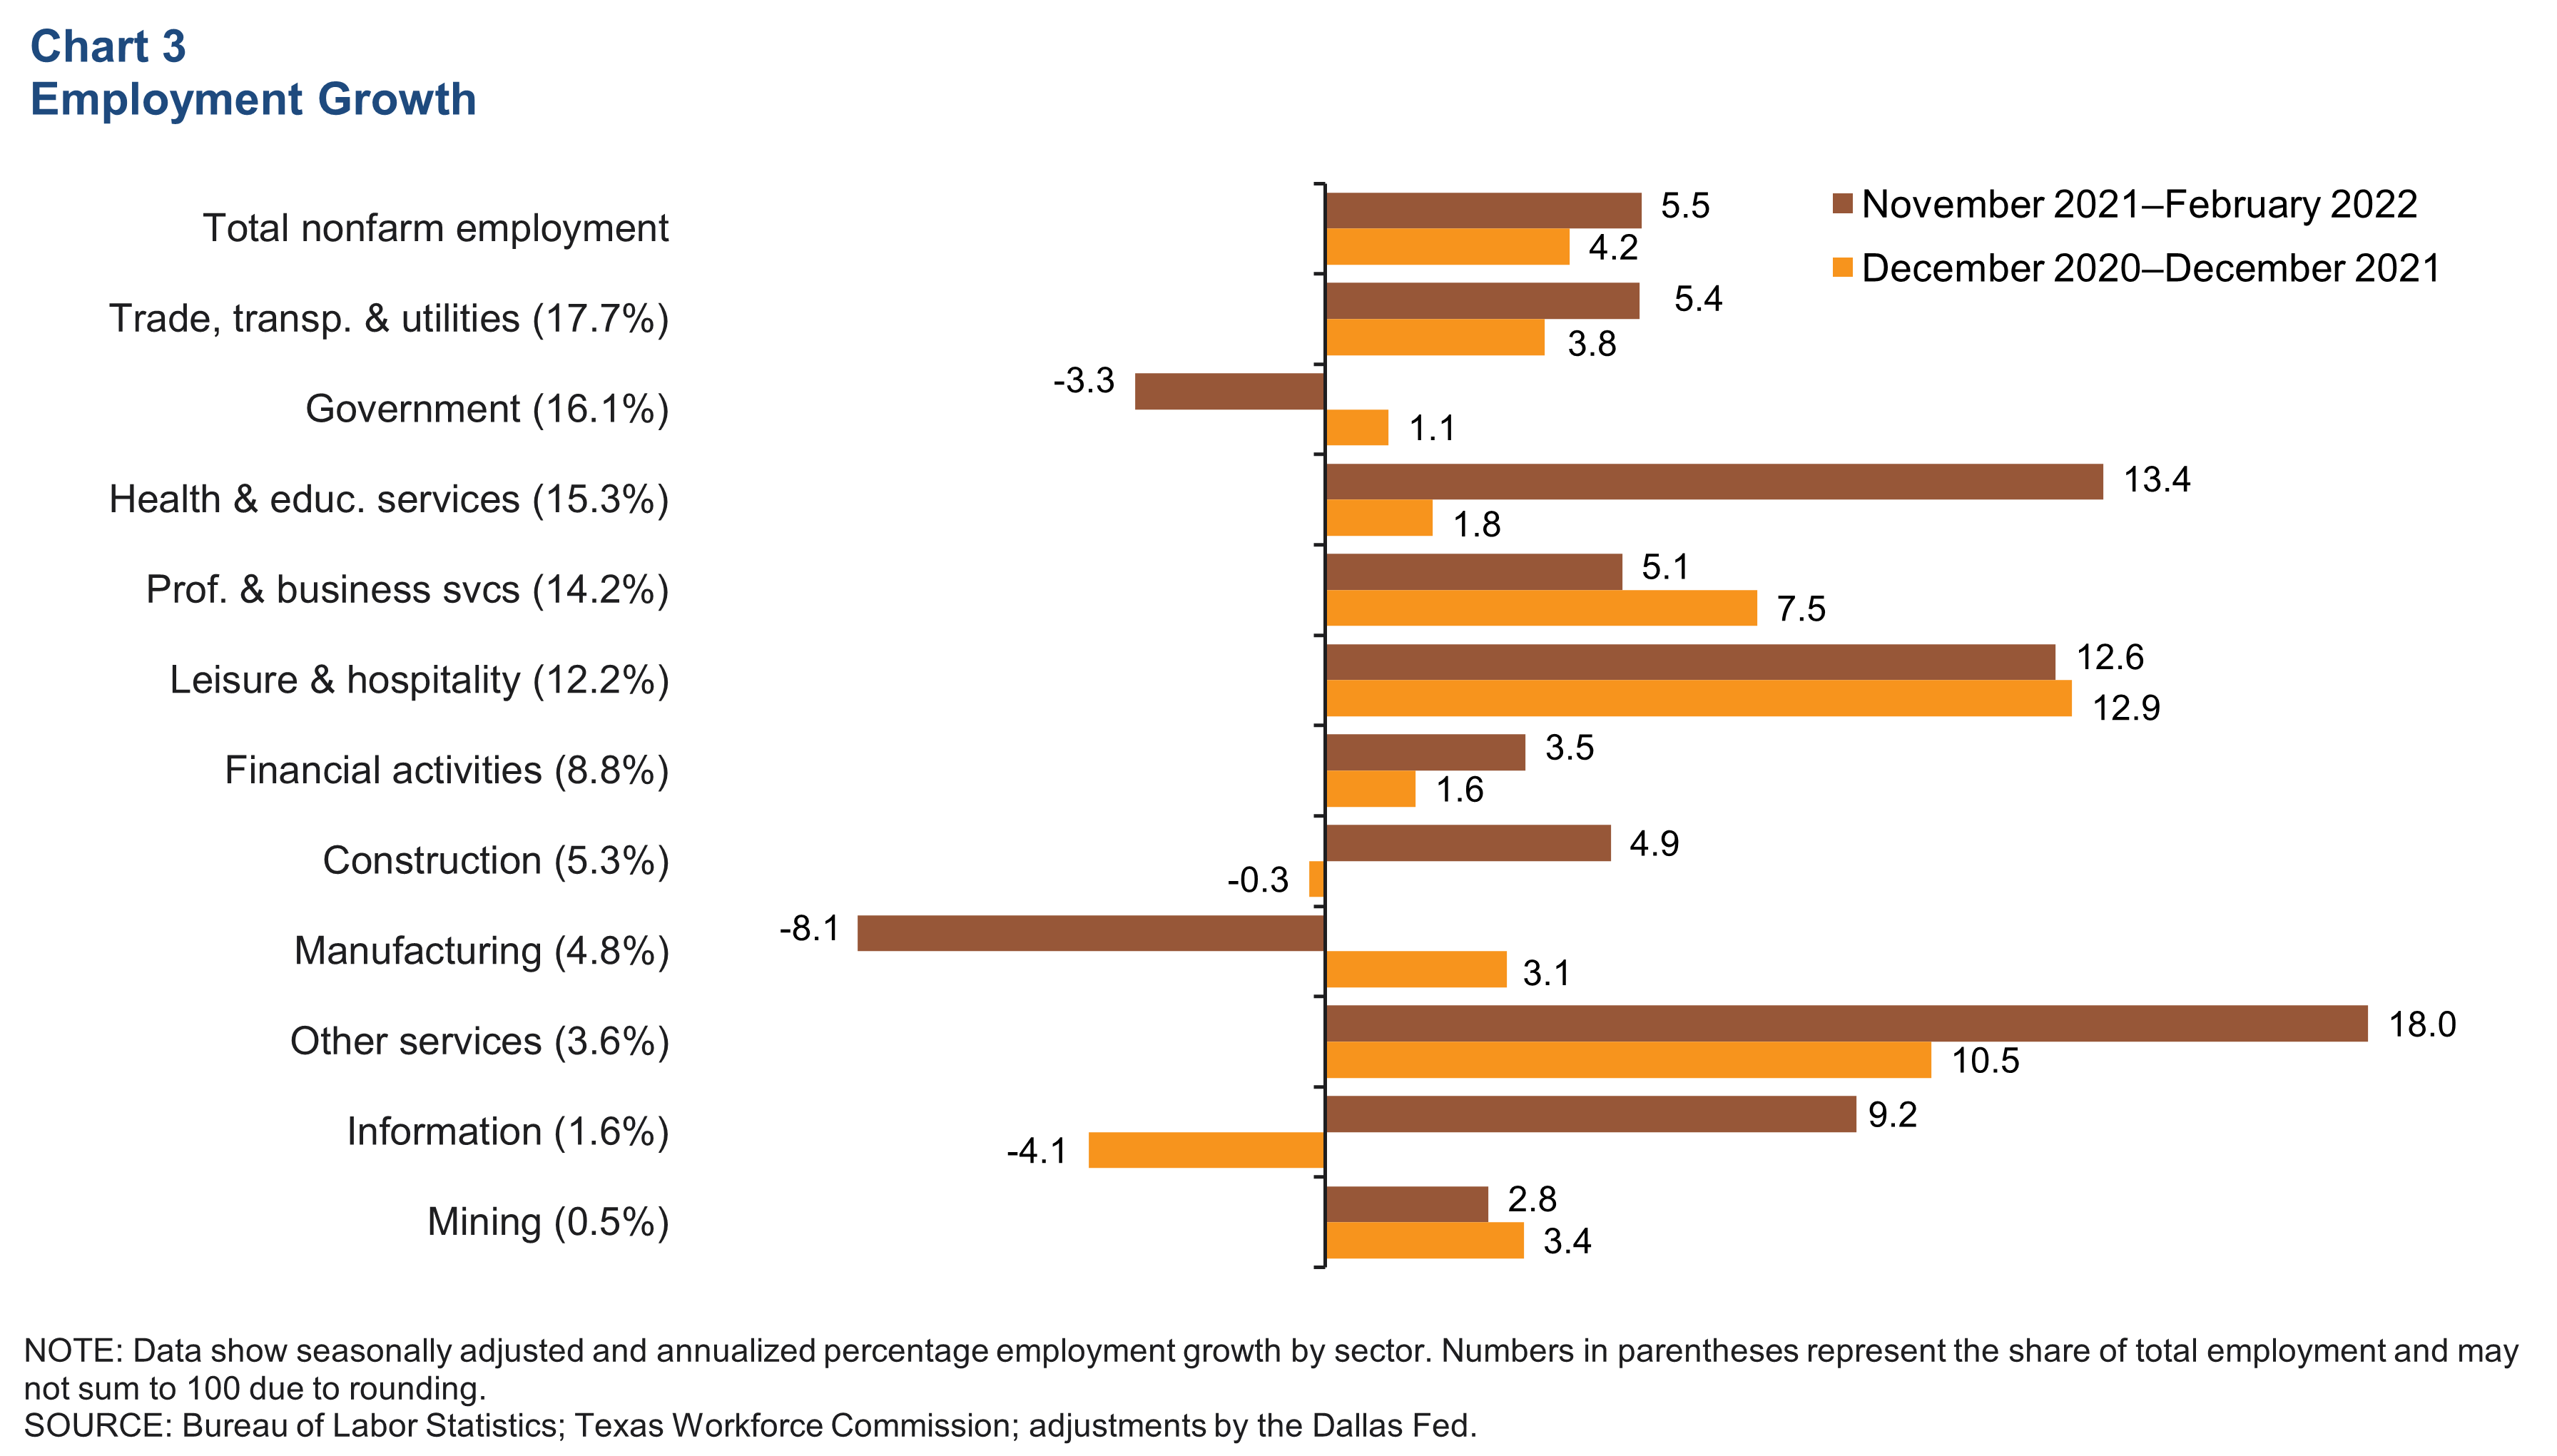
Recent job gains mostly positive
San Antonio payrolls expanded an annualized 5.5 percent (14,430 jobs) in the three months ending in January (Chart 3). Among the major sectors, health and education services (13.4 percent, or 5,269 jobs) led three-month growth, followed closely by leisure and hospitality (12.6 percent, or 3,954 jobs). Industries that posted contractions the past three months were manufacturing (-8.1 percent, or 1,082 jobs) and government (-3.3 percent, or 1,444 jobs). In March and April 2020 combined, 138,332 jobs were lost in the metro as the pandemic hit. As of February 2022, all jobs had been recovered and employment was 0.3 percent above prepandemic levels.
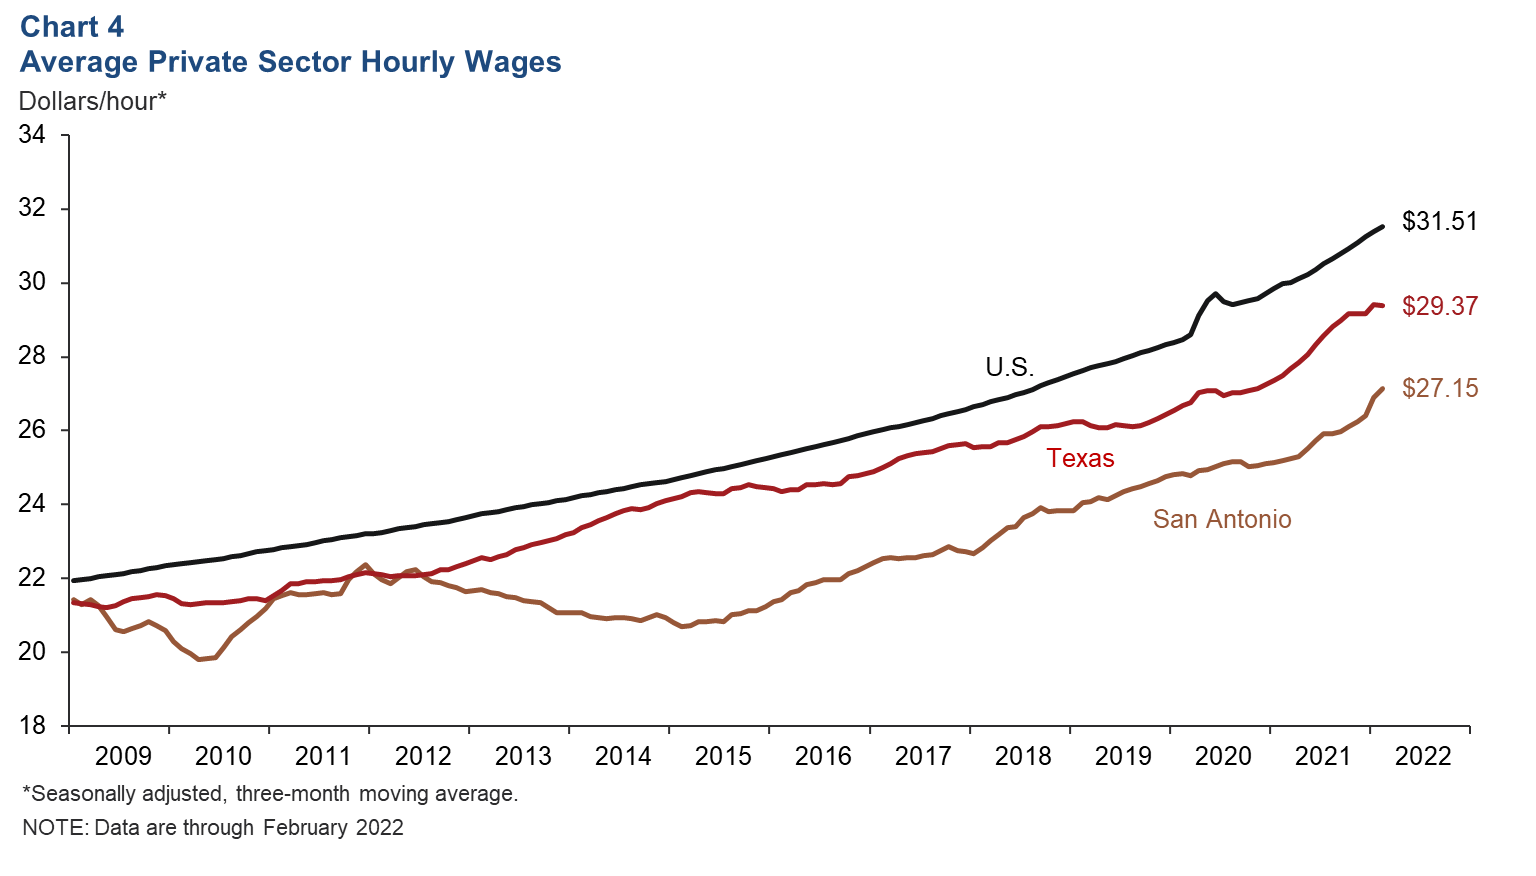
Wages
Average private hourly wages continued to reach new highs in San Antonio, climbing to $27.15 as of February 2022 (Chart 4). This represents an annualized increase of 12.5 percent from the previous month, well above the Texas and U.S. rates of -1.1 and 4.6 percent, respectively. Over the past 12 months, San Antonio wages have grown 7.8 percent. This, too, is well above the Texas rate of 6.8 percent and the U.S. rate of 5.2 percent.
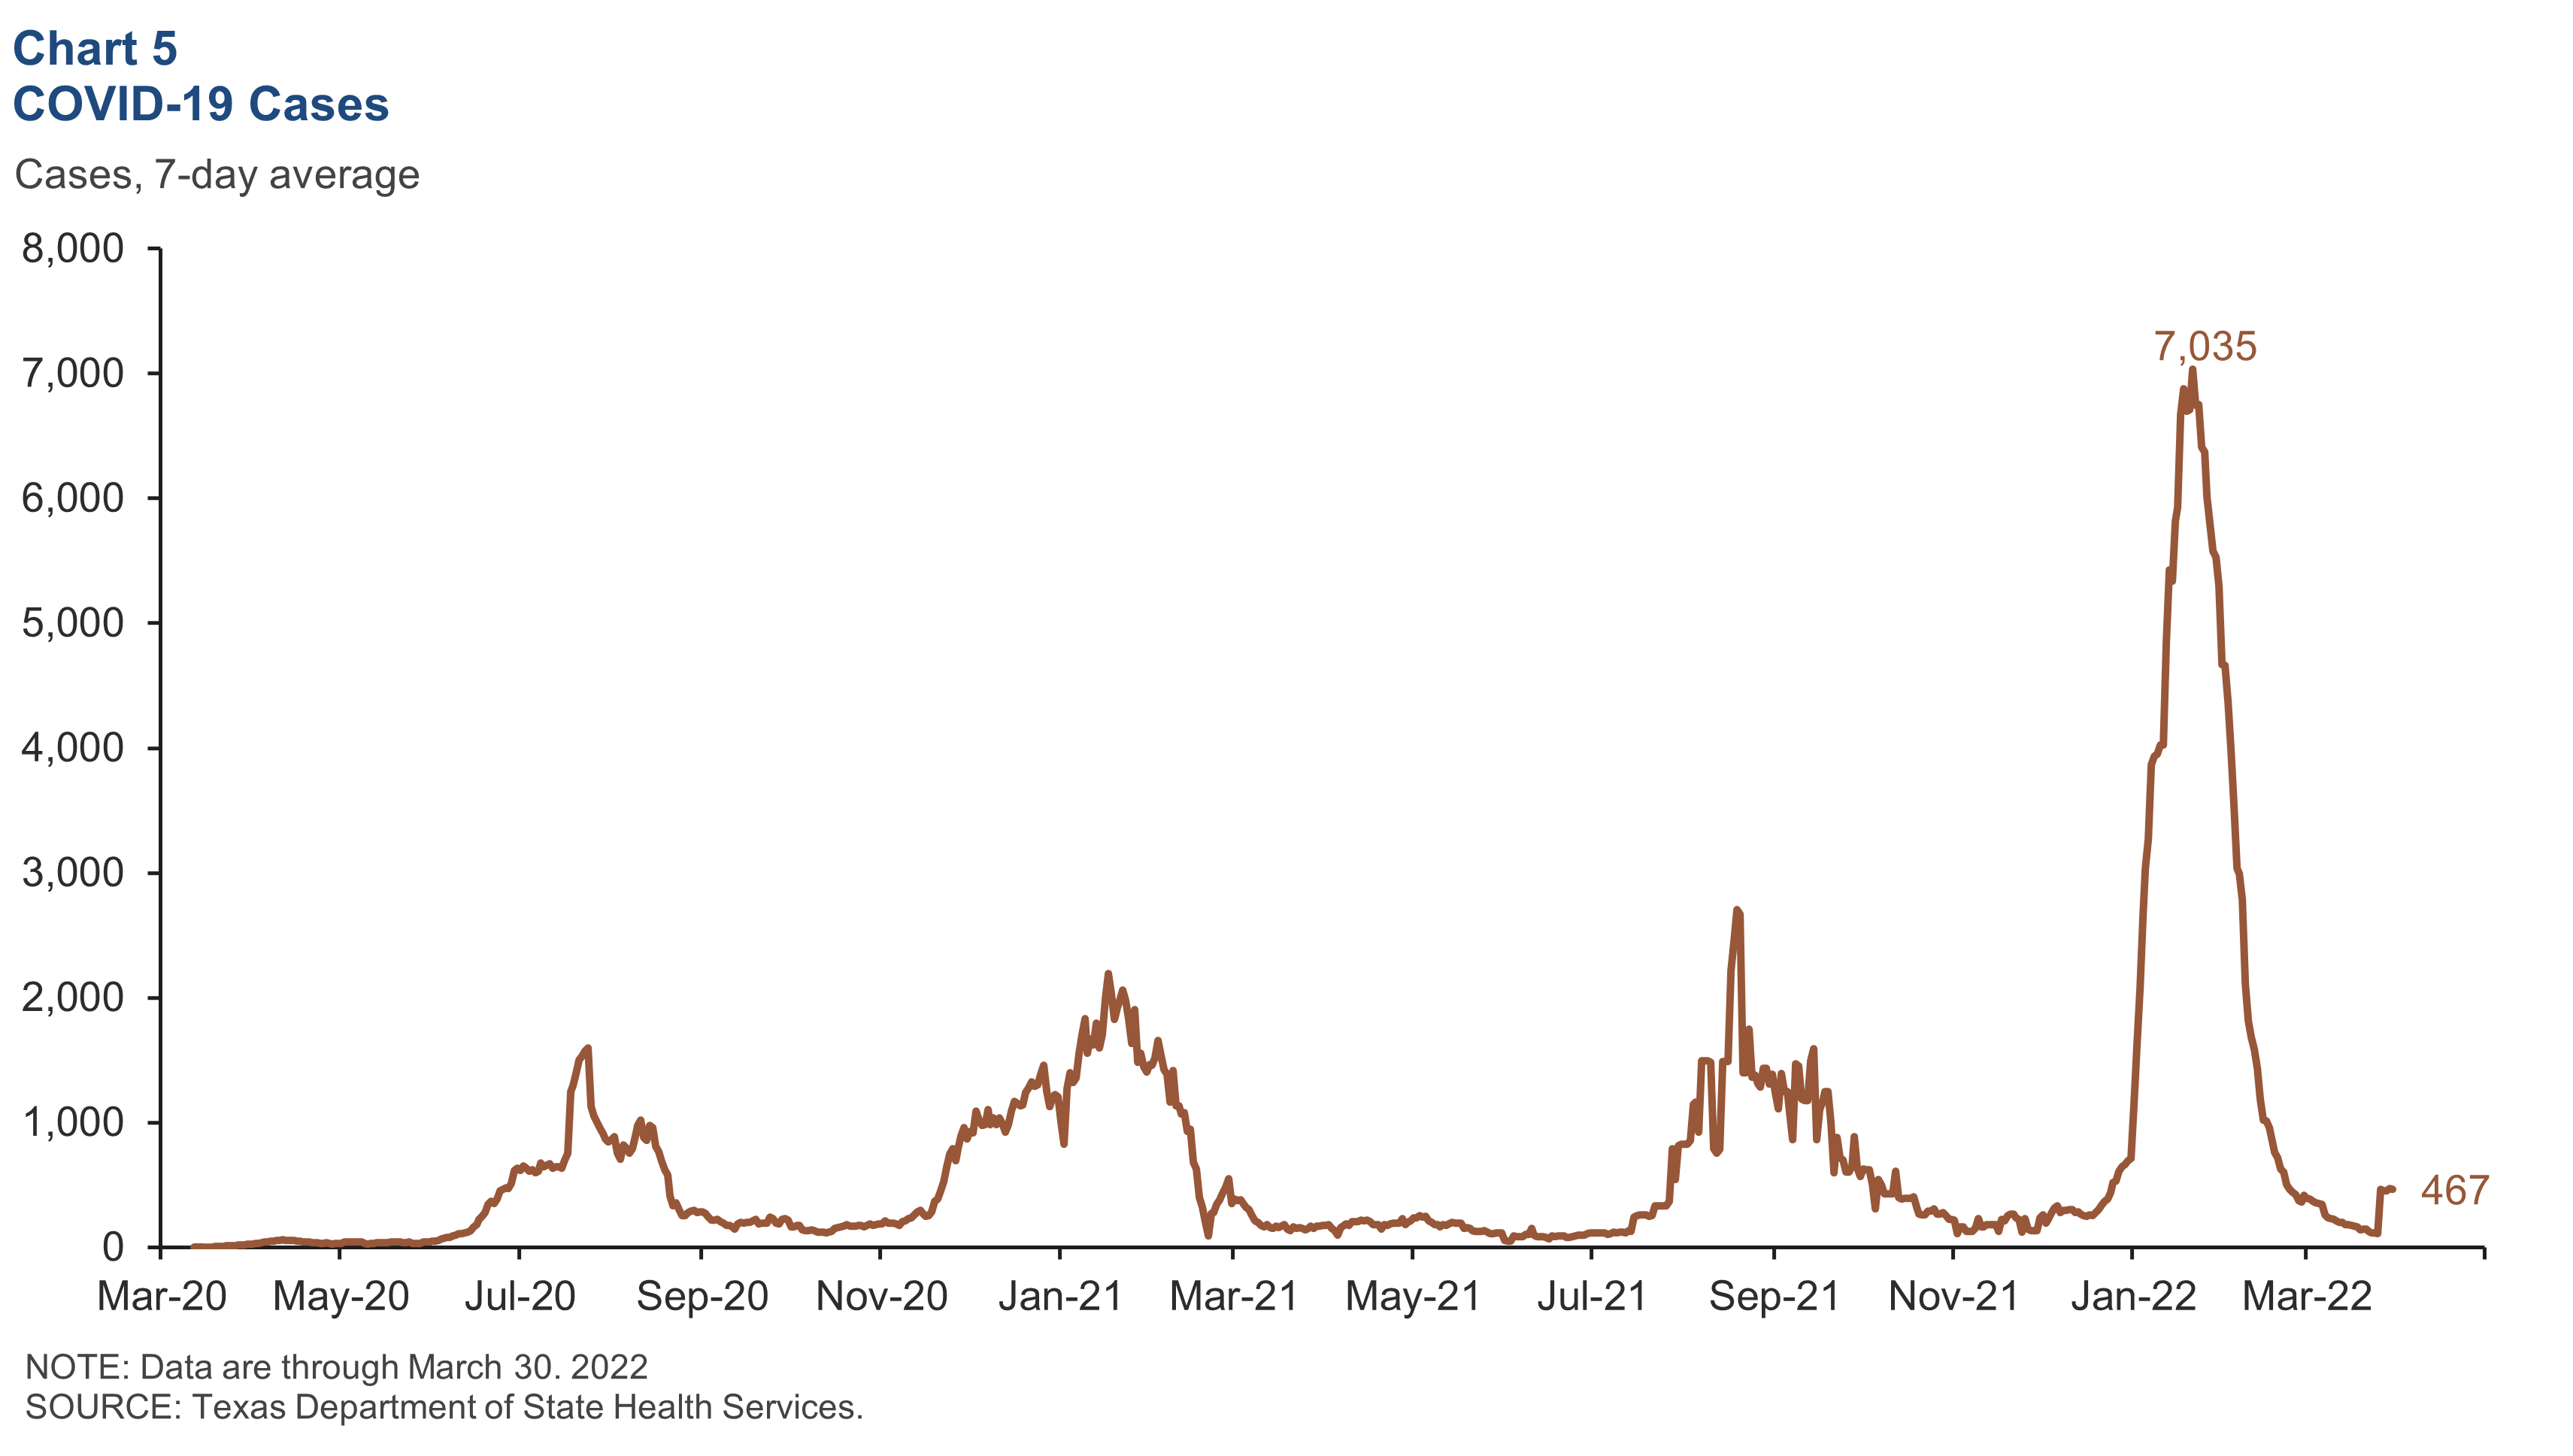
COVID-19
During the omicron wave, daily case counts in San Antonio reached levels as high as 7,035 per day based on a seven-day average (Chart 5). As of March 30, however, cases had fallen 93.4 percent to a daily rate of 467.
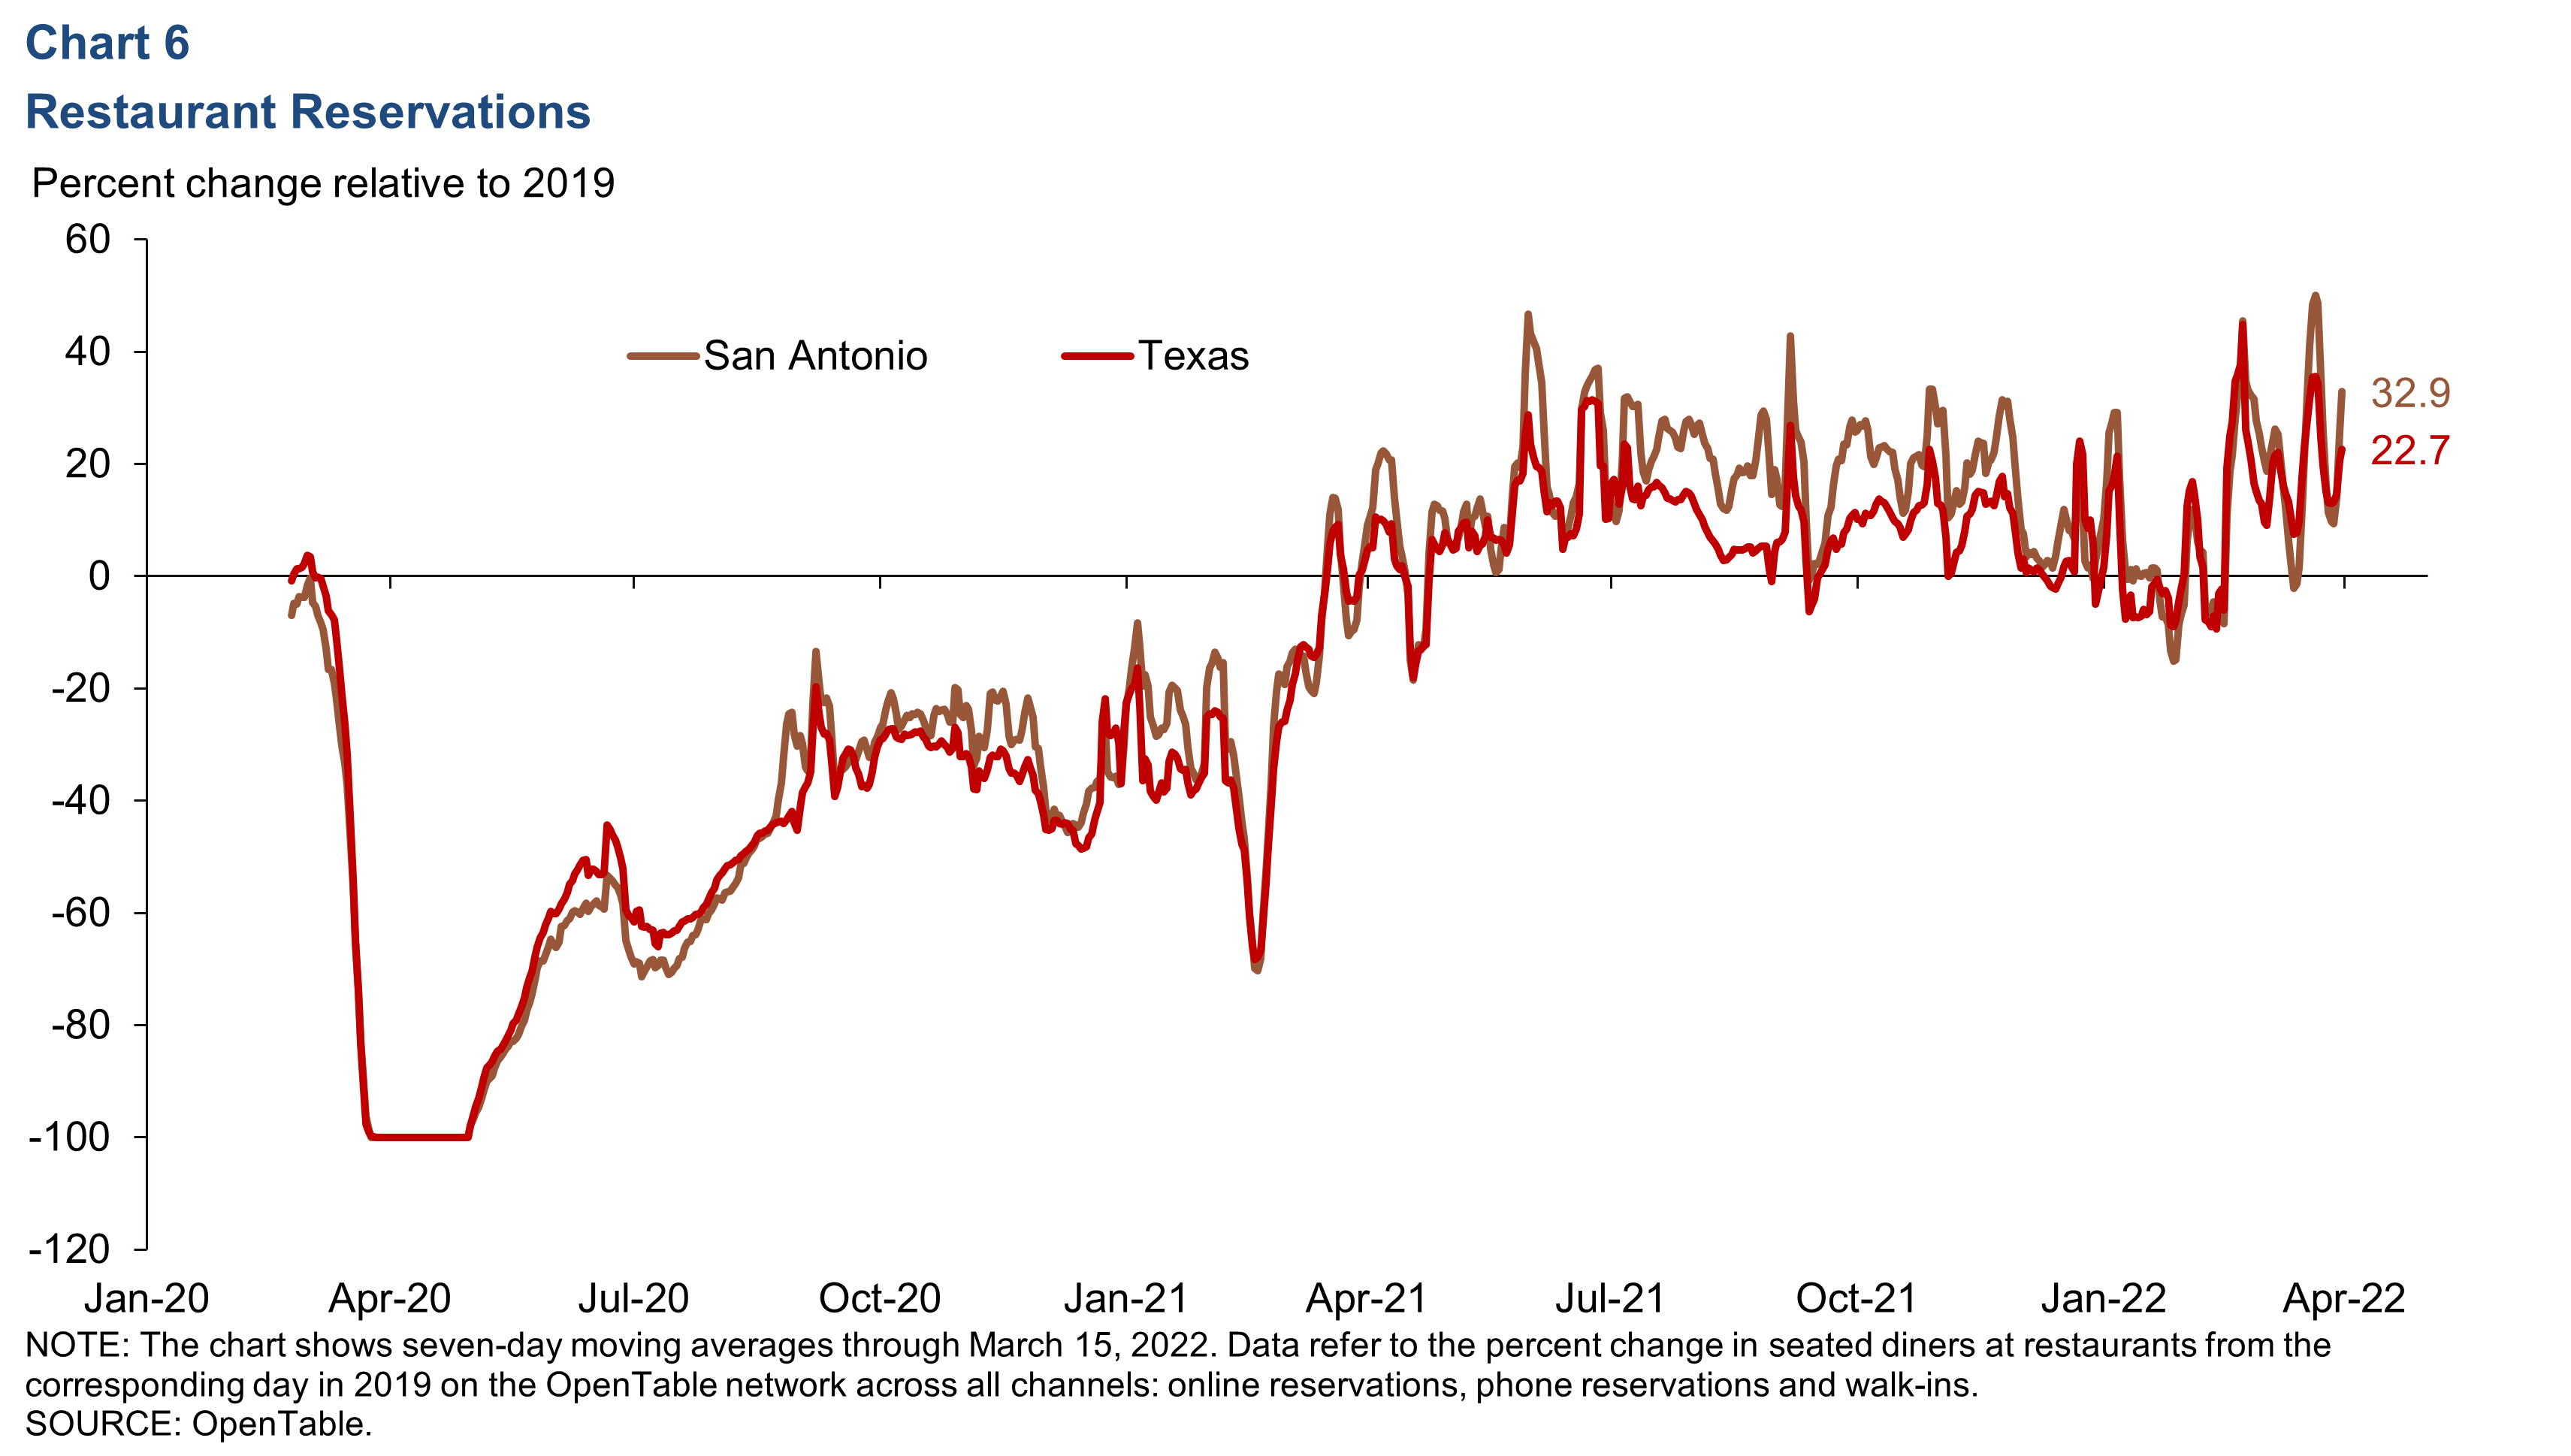
Dining activity
San Antonio dining activity fell briefly near the beginning of 2022 but has since recovered robustly (Chart 6). While dining levels in January fell as far as 15.2 percent below 2019 levels, they are now 32.9 percent higher.
NOTE: Data may not match previously published numbers due to revisions.
About San Antonio Economic Indicators
Questions can be addressed to James Lee at James.Lee@dal.frb.org. San Antonio Economic Indicators is published every month during the week after state and metro employment data are released.